ABSTRACT
LEE, LASHANDA ELAINE. Assessing Interactive System Effectiveness with Usability Design Heuristics and Markov Models of User Behavior. (Under the direction of David Kaber.)
The purpose of this research was to create a new measure of usability to aid researchers in determining whether the intent of system designers is realized and to objectively assess user behavior as a basis for interface design recommendations. Contemporary human-computer interaction (HCI) research has focused on methods to promote usability in interactive systems. Unfortunately, there are few quantitative, objective measures of usability, among many
subjective measures. A measure that can combine both objective and subjective data may be valuable in determining user perceptions of system designs and whether performance goals are achieved.
The present research utilized an existing HCI framework developed by Abowd and Beale and a mathematical model of the average number of user actions at an interface (e.g., mouse clicks) required for task performance in order to determine an overall system usability effectiveness score. Part of the score involves usability ratings by users, while considering designer interests in interface development. The components of the Abowd and Beale framework include the user, input, the system and output, which are interconnected by links that affect system effectiveness. Some links represent computational load, while others represent the complexity of articulation and system state observation for the user; that is, cognitive resources expended in performance.
and Beale framework, and the rankings were averaged across designers. Designers were expected to consider user articulation and observation as the most important aspects of the interface design because they represent cognitive load.
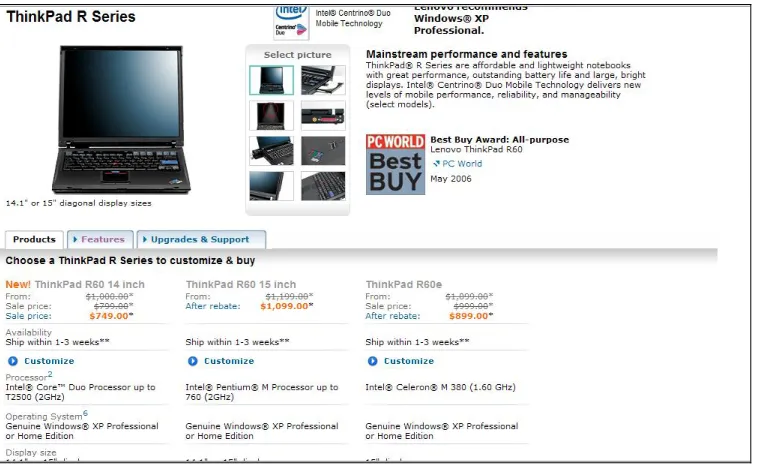
Twenty users, divided into two equal groups, were asked to complete the task of buying a certain type of computer (ThinkPad R60) using an existing and new prototype web interface. The new prototype was designed to increase usability with consolidated pages, more pronounced buttons and a multi-level menu structure. The users then considered the links in the Abowd and Beale framework and rated the specific design alternatives to provide a subjective assessment of whether the designer’s intent was achieved. It was expected that the new interface would receive higher average ratings than the old interface, based on the design changes.
Because subjective analysis of an interface is typically insufficient for identifying all serious usability problems, and for justifying design changes from a management perspective, it was necessary to include an objective component in the system usability effectiveness score. In web applications, the average number of clicks can be used as a measure of system performance efficiency. Markov Chain models can be used to predict human motor behaviors at an interface, such as the average number of mouse clicks in a task, based on small samples of actual
performance data. In the present study, on-line interface state transitions elected by users were recorded by a java script and used to establish probabilities for each system state. The
probabilities were included in a Markov model to predict the average number of clicks in task performance.
score (ratio of usability per interface action) can be said to have higher usability and represent a better match to the intent of the designer. The actual number of user clicks at the two web interfaces was also recorded during the study. It was expected that the new interface would reduce the number of clicks necessary to optimally reach the computer purchase goal; therefore, increasing the overall system effectiveness score. It was also expected that using Markov models would accurately predict the average number of clicks.
Assessing Interactive System Effectiveness with Usability Design Heuristic and Markov Models of User Behavior
by
Lashanda Elaine Lee
A thesis submitted to the Graduate Faculty of North Carolina State University
in partial fulfillment of the requirements for the Degree of
Master of Science
Industrial and System Engineering
Raleigh, North Carolina 2007
APPROVED BY:
_________________________ _________________________ Dr. Gary Mirka Dr. Robert St. Amant
Committee Member Committee Member
________________________________ Dr. David Kaber
DEDICATION
BIOGRAPHY
Lashanda Lee was born on June 11, 1983, in Raleigh, North Carolina, were she also grew up. When she was a child, her parent’s often encouraged here to be involved in many activities and that academics were the most important focus. She was heavily involved in volunteer work at a young age. She participated in girl scouts and often worked at the Food Bank of North Carolina. She was especially interested in science and math and her parent’s encouraged those interests, driving her to achieve important goals. She graduated from high school knowing she wanted to be an engineer, largely based on her involvement in many programs such as the MSN pre-college program, DECA, a marketing club, and national honor society. She earned her Bachelor of Science degree in Industrial Engineering at North Carolina Agricultural and Technical State University, where she also participated in many activities. Lashanda was the secretary and vice president of Institute of Industrial Engineers and the vice president of Alpha Pi Mu, the industrial engineering honor society. She coordinated a mentoring program for new students in the
ACKNOWLEDGEMENTS
TABLE OF CONTENTS
LIST OF TABLES ... vii
LIST OF FIGURES ...viii
1.0 MOTIVATION ... 1
2.0 LITERATURE REVIEW ... 3
2.1 HCI FRAMEWORKS...3
2.2 USABILITY PARADIGMS AND PRINCIPLES...8
2.2.1 Collaborative systems ...10
2.2.2 Ubiquitous computing ...11
2.2.3 Intelligent systems ...12
2.2.4 Virtual reality ...14
2.2.5 WIMP interfaces ...15
2.2.6 3D interfaces ...17
2.2.7 Summary ...18
2.3 MEASURES OF USABILITY...18
2.3.1 Qualitative Measures ...19
2.3.2 Quantitative Measures ...24
2.3.2.1 Quantitative Subjective Measures ...25
2.3.2.2 Quantitative Objective Measures ...27
2.3.2.3 User Modeling...29
2.3.2.4 Summary of Quantitative Measures ...32
2.4 OPERATIONS RESEARCH METHODS OF USABILITY...32
2.4.1 Markov Chain models ...33
2.4.2 Probabilistic Finite State Models...37
2.4.3 Critical Path Models ...39
2.4.4 Summary on OR methods ...42
3.0 SUMMARY AND PROBLEM STATEMENT ... 44
4.0 METHOD ... 48
4.1 OVERVIEW OF SYSTEM EFFECTIVENESS SCORE...48
4.2 WEIGHTING FACTOR DETERMINATION...49
4.3 EXPERIMENTAL TASK...50
4.4 DEVELOPING THE MARKOV CHAIN MODELS...54
4.5 RATING SYSTEM EFFECTIVENESS BASED ON THE ABOWD AND BEALE FRAMEWORK...57
4.6 CALCULATING THE OVERALL SYSTEM EFFECTIVENESS SCORE...58
4.7 MARKOV MODEL VALIDATION...58
5.0 RESULTS ... 59
5. 1COMPUTATION OF AVERAGE NUMBER OF CLICKS...59
5.2 PARTIAL SYSTEM EFFECTIVENESS SCORE...64
5. 3 OVERALL SYSTEM EFFECTIVENESS SCORE...66
5.4 REDUCING EXPERIMENTATION...66
6.0 DISCUSSION ... 68
7.0 CONCLUSION ... 75
REFERENCES... 81
Appendix A: Designer Survey... 85
LIST OF TABLES
LIST OF FIGURES
Figure 1: Norman’s (1998) model of human-computer interaction (from Newman and Lemming
(1995))... 4
Figure 2: Pipe-Line model ... 6
Figure 3: Abowd and Beale et al (1991) model of interaction ... 7
Figure 4: Series page from the existing interface ... 52
Figure 5: Series page for the new interface ... 54
Figure 6: Transitional probability matrix for the new interface ... 60
Figure 7: Transitional probability matrix for the existing interface ... 60
Figure 8: Normalized transitional probability matrix for the new interface... 61
Figure 9: Normalized transitional probability matrix for the existing interface ... 61
Figure 10: Average number of steps from state i to state k for the existing interface ... 62
Figure 11: Average number of steps from state i to state k for the new interface ... 63
Figure 12: Actual versus predicted clicks for the existing interface... 72
1.0 MOTIVATION
Humans and computers are complex biological and mechanical systems that differ in terms of methods of communication and the ways in which they analyze tasks. In order for human computer interaction (HCI) to be successful, interfaces must be designed to effectively translate the intentions, actions and inputs of the operator for the computer, and translate machine outputs effectively for human comprehension. In HCI applications, data translations like these often fail because of interface usability problems. For this reason, contemporary HCI research has focused on methods to promote usability in interactive systems. Unfortunately, from a usability engineering perspective, there are few quantitative measures of usability as basis for design, among many subjective measures.
subjective analyst input. However, with objective usability analysis methods, specific design changes may be identified that can lead to compatibility of user input and system states. Such measures can also decrease the problems programmers have in addressing changes
recommended by usability analysts.
In recent years, several comprehensive interactive system design frameworks have been developed, such as Abowd and Beale (1991) and Norman (1988), as bases for guiding HCI application development from a usability perspective. Such frameworks can be useful for classifying usability problems and identifying aspects of system designs that are considered critical to usability and effectiveness. Norman’s model describes cycles of execution and evaluation in HCI and focuses on the objectives and actions of the user, as well as system responses. Based on Norman’s model, Abowd and Beale created an analogous interactive framework that includes four major components, which focuses more on the role of the interface and machine in the overall interaction framework. Studying this research can help researchers develop approaches to classify, assess and direct re-design of interactive systems.
In order to facilitate robust and accepted usability analyses, a simple framework like Abowd and Beale, can be used to organize and structure a design problem. It may also allow for criteria to be established providing the usability analyst with direction in design. Usability analysts may also apply Operations Research techniques to provide quantitative information as a basis for design. With such a combined approach, the usability analyst may be able to
2.0 LITERATURE REVIEW
2.1 HCI Frameworks
HCI frameworks describe interaction in complex systems between the human and computer. Newman et al. (1995) described the manner in which humans process information and communicate in a HCI application. The authors suggested human information processing involves multiple processors (cognitive, perceptual, and motor). Each processor is like a
subsystem, which must be available for perception of auditory and visual information and vocal communication, etc. Newman et al. stated each processor is associated with separate memory stores. Similarly, the computer possesses different components that are metaphorically named after the components of the human brain, such as a processor and memory, and these processors function in a conceptually similar manner. In effective HCI, the processor and memory
capabilities of the human and the computer should complement each other. The methods of communication, including verbal and visual, should also be made compatible through the system interface.
There are several models, like Newman et al. that attempt to describe the methods of communication between the human and the computer. The purpose of modeling the interaction between the human and the computer is to provide a basis for explaining how and why
Abowd and Beale’s interaction framework (an extension of Norman’s model) and the Pipe-Line information processing model (Mulhem and Nigay, 1996).
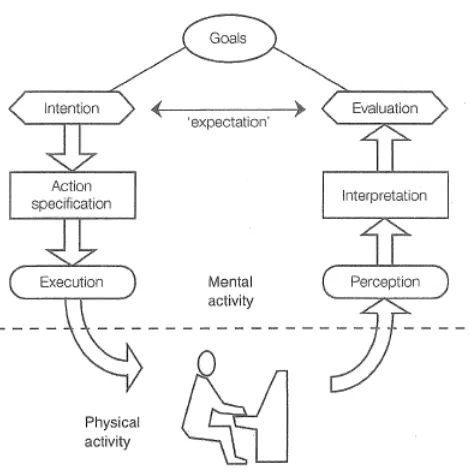
Norman’s model is based on a cycle of interaction that contains two major phases. The first phase, execution, consists of four separate steps. The user must first establish a goal. Next, the user forms the intention, followed by deciding on an action sequence to reach the goal. Lastly, the user executes the action sequence. The second phase, evaluation, consists of three steps. After the user has executed the action to reach the goal, the user then perceives the system state. Next, the user interprets the state of the system and, finally, he or she evaluates the system state based on the original goals and intentions (see Figure 1).
In order to evaluate the effectiveness of the communication between the human and the computer, Norman proposed that there are gulfs that separate the user’s actions and goals. The gulf of execution is considered the difference in the intention of the user’s action to reach the goal and the allowable actions of the system. For effective interaction (usability), the interface design for the system should try to reduce this gulf. The gulf of evaluation is the figurative distance between the display of the system state and what the user expects the interface to display. Therefore, to reduce this gulf, the output should be presented in terms of the
expectations of the user. Norman’s model describes HCI primarily in terms of the objectives and actions of the user; however, it only considers the system as an interface and does not focus on the continual (parallel streams of) communication between the human and the computer.
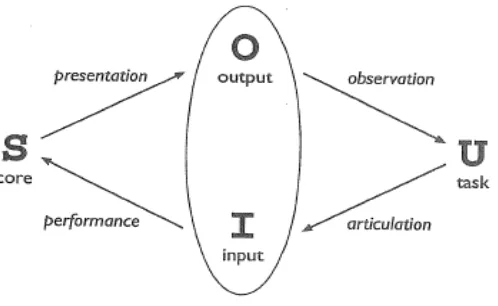
In Mulhem and Nigay’s (1996) Pipe-Line model of human information processing in complex systems, human goals and mental processes represent one level of abstraction
(encompassing the stages in Norman’s model). The Pipe-Line model (see Figure 2) shows two pipes that represent the output of the system interface and the human input to the interface. They operate in parallel. At the beginning of the pipes, there are physical actions that can be
it can be related to an existing database of relevant commands for execution. The system output then passes through another adapter for translation back to the user’s language.
Figure 2: Pipe-Line model
Because the Pipe-Line model is relatively complicated it is best to describe it using an example. In research done by Mulhem and Nigay (1996), a query system was used as an
example of the model. First, the user types a command, which is considered the physical action. Then, the system identifies the information input units (the information typed) entered by the user. Next, the user hits the enter key and the system determines an action to be preformed. The system then takes the information and adapts it into computer language, matches it to a command database, and restores it to a language the user can understand. Next, the query results are
ranked for the user and presented based on relevance. This is considered the output information unit. The user can then pick the result that best fits their needs. The Pipe-Line model is
system works to translate user commands and to retrieve data for the user. It also represents the highly parallel nature of input and output in HCI.
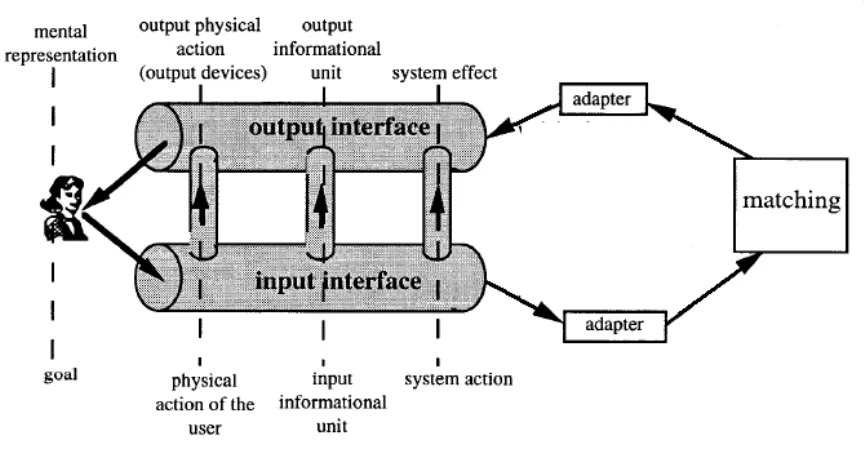
Abowd and Beale’s model of interaction is an extension of Norman’s model. Because the interface lies between the user and the system, an interactive cycle was defined to reflect this physical arrangement. The interaction cycle contains four distinct steps, as opposed to the two represented in Norman’s model, and it is less complex than the intricate pattern of interaction presented through the Pipe-Line model. According to Abowd and Beale (1991), the first step begins with the user’s formulation of goals, where the goal is articulated into input language (see Figure 3). Next, the input is translated to the system language. This stage is not usually
considered in usability evaluation because is represents the time and effort by the system designers and programmers for accommodating user psychological intentions. The step, however, should be considered in any model of HCI, because when trying to create usable designs the capabilities of the programmers may be limited, resulting in design ideas that cannot be implemented or that do not account for user needs. Next, the system presents the output on the interface. Lastly, the user observes and evaluates the display.
The Abowd and Beale interaction framework is robust in representing the stages of HCI yet more parsimonious than Norman’s model. It is also not as complex to understand as the Pipe-Line interaction model. Abowd and Beale’s model of interaction represents the entire cycle of communication between the human and the computer. It is a simple model that can be used to describe the actions that take place during communication. It details the continual cycle of communication between the human and the computer, which is important in describing how people use computers. The representation of the system interface also captures the connection of input and output in a parallel way. The Pipe-Line model is very accurate in describing the interaction cycle; however, it is complex and focuses mainly on how the system processes information sent by the user. The Abowd and Beale model, allows for easier interpretation in terms of identifying communication failures. Based on the attributes of Abowd and Beale’s model, the framework was used in this research as a basis for defining a new measure of system usability and effectiveness to improve design and prevent various types of user errors. This measure was combined with another objective usability evaluation.
2.2 Usability Paradigms and Principles
effectiveness from a user needs perspective. Many historical usability paradigms are still used today but a plethora of new paradigms have begun to surface as technology has become more intricate. Some historical paradigms include command line interfaces and large mainframe computers that were shared by groups of users. Newer paradigms include collaborative systems, ubiquitous computing, intelligent systems, virtual reality and more.
The purpose of this section is to describe several paradigms and principles in use today, describe some usability tradeoffs associated with each, and show how these paradigms and principles can minimize confusion in the communication between the human and the computer. With each type of paradigm, different usability measures can be used to identify acceptable levels of performance and user satisfaction and to address different usability principles. Some usability principles include error prevention, flexibility, portability, consistency, robustness, parsimonious, recoverability, learnability and efficiency. Flexibility describes the many ways the computer and user exchange information. Learnability is defined by Dix et al. (1993) as how easy it is for a user to begin effective interaction and perform optimally. Robustness represents how easy it is to apply the interface to a range of applications. How closely an interface
2.2.1 Collaborative systems
According to Rosson and Carroll (2002), collaborative systems are used for several applications, where groups of people need to collaborate remotely or locally and in real time or at different times. Some examples of collaborative systems include video conferencing, email, list-serves, shared file systems and intranet, as well as digital whiteboards. Collaborative systems have several tradeoffs. In some systems, nonverbal communication cues are missing (e.g., user hand gestures and facial expressions); however, addressing such limitations through addition of interfaces can cause the display to become cluttered and distract users in comparison to other desktop applications. Other collaborative system designs can lead to reduced
interpersonal communication, which may promote awkward or risky discussion, not normally present in face-to-face conversation. Collaborative systems, such as email, can store archived data, which can help manage group discussions, but the cost of archiving is usually paid by persons who do not benefit directly from the systems.
for example, task completion time, time in mode and time until an event. In order to ensure that these systems provide efficiency and they are used to effectively transfer ideas and resources, the time that it takes a person to complete a task is important but may be difficult to test. However, issues such as inconsistency in design, etc. should be eliminated through inspection methods, which can be implemented easily. Collaborative systems are not successful in regards to robustness because this type of interface cannot be applied to certain types of displays, for example, an online ordering system for use by independent workers.
2.2.2 Ubiquitous computing
Ubiquitous computing is a term first used by Mark Weiser in 1991 to represent a future where computers are incorporated into our everyday tasks. Some other terms synonymous with ubiquitous computing are pervasive computing, calm technology and “everyware”. Examples of ubiquitous computing include: PDAs, pocket PCs, and mobile phones, which enable mobile computing. With ubiquitous computing there are also usability tradeoffs. According to Rosson and Carroll (2002), when using these devices flexibility and portability are increased; however, complex tasks cannot be supported because of the limited display space and memory in small devices. Because ubiquitous computing devices are small and easy to carry, they are considered portable. Yet there is often a problem of creating menus in small ubiquitous computing devices that are easy to navigate.
Ubiquitous computing is used to achieve certain usability principles and certain usability measures can be used to evaluate these types of systems. Rosson and Carroll (2002) also
increasing overall efficiency. Usability measures such as verbal reports, guidelines, and walkthroughs should be used in advance of empirical evaluations of task completion time, average number of clicks, etc. to evaluate these types of systems. Measures such as guidelines should be used to eliminate initial problems with consistency and functionality. However, collection of empirical data should also be considered. The time required to complete tasks is important in gauging how efficiently a user can use the device. The number of clicks (interface actions) can help evaluate the structure of a menu system in a PDA, where fewer clicks to reach a desired option means better usability for the user. Ubiquitous computing is not effective in recoverability because it is often hard to show system states and paths out of menus with such a small interface display.
2.2.3 Intelligent systems
The goal of an intelligent system is to collect and organize enough information about a user, task or situation, to create an accurate prediction of what the user needs and wants to see or do. Intelligent systems learn during their existence. They receive information from the
specific applications and process the data further for ease of use. Software agents can be compared to personal computing assistants (e.g., Microsoft “paperclip”). However, this technology may reduce the feeling of control for the user and may not exhibit the type of etiquette humans have come to expect in human-human interaction.
Intelligent systems are used to achieve usability principles and a specific set of usability measures can be used to evaluate this type of system. The usability principles addressed by intelligent systems are efficiency and system parsimony. NLP systems do not require any thought for the users, the user can simply ask a question in their own language and the computer should understand and present the desired information to the user in their language. These types of systems promote efficiency because they eliminate the time a user would spend to interpret system feedback and the time it takes to input information into the system in a manner that the machine can understand. As stated by Rosson and Carroll (2002), the user does not have to interpret information or system feedback. This allows a user to complete more work in a shorter period of time therefore promoting efficiency. Usability measures useful in evaluating these types of systems include inspection methods (heuristic methods and guidelines) applied before collecting empirical data, such as number of correct tasks completed and task completion time. Guidelines, etc. should be used to eliminate initial and obvious usability problems.
Because these systems should promote efficiency, task completion time is helpful in evaluating usability. Because NLP and intelligent systems are considered parsimonious they should be simple to use in completing all tasks given to the user. By recording the number of tasks
completed correctly, it is easy to determine how well this paradigm promotes parsimony. These systems, however, are not effective in portability because the programming and memory
capabilities that are required to create the technology cannot be compressed into a small computing device.
2.2.4 Virtual reality
Virtual reality (VR) is a technology that allows a user to interact with a computer-simulated environment. An issue in designing virtual environments is creating the appropriate degree of veridicality, or achieving a high degree of correspondence with the real world. Some example uses of VR are skill training, behavioral therapy, and design. Through the use of standard input devices, such as a keyboard and mouse, or through multimodal devices, such as a data glove (e.g., the Cyberglove), users can interact with a virtual environment. According to Rosson and Carroll (2002), VR and simulation can help ease learning of complex systems and allow for forms of unnatural interaction, such as extending an arm longer than naturally possible to reach an object in an environment, to more effectively perform tasks. Immersive virtual VR environments can also enhance user situation awareness on displayed information.
imaging and data communication technologies become more powerful and cost-effective. Even though virtual reality can be used for several applications, in order to provide veridicality several objects may need to be placed in the VR space. With this condition, the work area may become cluttered making it hard for users to focus, leading to a short attention span (Roussou, 2000).
Virtual reality systems are used to achieve usability principles and a certain set of usability measures can be used to evaluate such systems. The usability principles supported by VR systems are efficiency, flexibility and learnibility. When a person uses VR systems, they can perform tasks in several different environments that may occur in the real world. The capability of using such systems to achieve goals in several environments provides flexibility and efficiency. Because VR environments mimic real world environments, users can use mental models from past experience to learn how to use a system easily. Usability measures that are effective in evaluating these types of systems include guidelines, heuristic methods and walkthroughs. More importantly, quantitative measurement data, such as error rates and task completion time should be recorded because VR is typically used with specific tasks in mind. Task completion time is a good measure of efficiency and error rates can determine how fast a user can learn to use a system. VR systems, however, are not typically effective in recoverability because error correction procedures are difficult to model.
2.2.5 WIMP interfaces
metaphors to real world systems. Icons in such interfaces represent actions and feedback mechanisms. Menus and controls include dropdown menus, popup menus, radio buttons,
checkboxes, selection lists and dialog boxes. Some examples of pointing devices are the mouse, which is the most common, the trackball, the trackpad and pens. Metaphors are design tools used to help the user associate the actions of the interface with something that is already commonly used in other real-world tasks. Each element in a WIMP interface is easy to learn; however, maneuvering through several of these can increase the complexity of the interface (Biström et al, 2005).
WIMP interfaces are used to achieve usability principles and a certain set of usability measures can be used to evaluate such systems. The usability principles followed by WIMP interfaces include efficiency, ease of learning and recoverability from errors, robustness, and customizability (Biström et al, 2005). WIMP interfaces can also be considered portable, flexible, and parsimonious. The WIMP interface may be easy to learn because they map what a user is doing in real space to the display space. Within WIMP interfaces, programs allow “undo” and “back” functions in order to provide for quick error recovery. These interfaces are robust because they can be used across several applications. A WIMP interface can exist within a ubiquitous computing device and collaborative systems. For this reason, these interfaces are also considered portable. In many programs delivered through a WIMP interface, it is possible to customize the types of options and the way they are presented. WIMP interfaces are also efficient in completing several tasks simultaneously by providing multiple windows.
usability prior to collecting empirical data for quantitative usability analysis. Empirical data that is helpful in determining the effectiveness of the WIMP interface include task completion time, time in mode, and time until an event, input rate (e.g., words per minute), mental effort (assessed using tools like NASA’s Task Load Index (Hart and Staveland, 1988)), number of correct tasks completed and average number of clicks and task performance accuracy (error rates, spatial accuracy and precision).
2.2.6 3D interfaces
3D interfaces are also used as part of WIMP interfaces, including buttons, scroll bars, and icons. These elements are made to appear as if they have three dimensions. In order to create a 3D look, shading is used, for example, to imitate an object crafted in stone. According to Dix et al. (1993), when designers use this feature sparingly, the 3D objects can be used to identify active objects and areas, which help with decision making and understanding information. 3D features can also be used with workspaces, which are much more complex. Size, light, and occlusion can create a visual allusion of distance in a workspace. When an object in the interface moves further away, it also appears much smaller and takes up less space in the 3D workspace. 3D interfaces allow users to do tasks in a quasi real-world simulation. Disadvantages of 3D interfaces include: (1) for novice users, it may be hard to tell where objects are placed in the 3D environment; and (2) designers often use 3D technology for every feature in the interface, diluting its use as an indication for activation. This type of interface addresses the same usability principles as the WIMP interface and is conducive to evaluation with the same usability
2.2.7 Summary
In the previous sections, several of the most common usability paradigms and principles were presented. All of these paradigms can be used to address the figurative distance of
articulation in Abowd and Beale’s model and to improve performance between humans and computing systems. Each paradigm can be evaluated by several usability measures and each is generally considered effective at addressing certain usability principles. For example, intelligent interfaces that use NLP may provide for the greatest reduction in articulation distance for users, but they represent alternatives furthest from the system language, in design. It takes a long time for a system to translate the information from a NLP interface into a command language. On the other hand, a command line interface represents a design alternative closest to the system
language, without requiring users to use binary terms. This type of interface is also the farthest away from the user’s language in the Abowd and Beale interaction framework. With command line interfaces the computer does not have to interpret the information it has received from the interface. However, the user has to recall the specific language and know which commands to use to generate certain system actions. The WIMP interface is a design alternative that is basically equal in distance between the user and the system in the Abowd and Beale interaction framework. It is easy for both the system and user to interpret, respond to, and choose the next action. In this research, new integrated usability evaluation measures were developed and applied to WIMP interface design alternatives for an online ordering system.
2.3 Measures of Usability
categories, quantitative and qualitative. These types of measures are used in certain instances in the design or evaluation phases of an interface and offer both pros and cons for assessing
usability. Quantitative measures can be divided further into objective and subjective measures. Subjective measures are based on opinions (e.g., survey ratings) whereas objective measures are collected empirically (e.g., task completion time) and are based on observations. The purpose of this section is to describe quantitative and qualitative measures of usability and discuss how each measure is applied to HCI, as well as describe the pros and the cons of the measurement
techniques.
2.3.1 Qualitative Measures
was completing tasks. They can also be used to gain subjective opinions and suggestions on how to make the interface more useful to its customers.
Each of these methods has several benefits, such as low cost and quick discovery of design problems, and is discussed in detail below. It has been suggested that inspection based methods are a good complement to user testing (Clamann and Kaber, 2004). They can help eliminate usability problems before testing begins and reduce analysis and reporting time. Inspection methods are also considered low cost, low skill methods. According to Cockton et al. (2002), there are five specific types of inspection methods that are used today: principle-based methods, heuristic methods, guidelines, style and rule inspections, and walkthroughs. Heuristic evaluations are completed by usability experts that determine strengths and weaknesses of a system by taking on the user’s perspective as they analyze the system components and the interface. Research has shown heuristic evaluations methods to be thorough in correctly identifying problems; however, the problems that heuristic evaluations tend to miss are considered severe (Cockton et al., 2002; Molich and Nielsen, 1990). Previous research also suggests that because heuristic evaluations are typically performed by experts, they may not reflect the user’s perspective (Mosqueira-Rey et al., 2004; Chang and Dillon, 2006). Cognitive walkthroughs methodically cover the application space and procedures and provide a good resource for candidate problem discovery. However, CW methods may not find all problems that affect the user as he or she completes a work related task because the analysis typically focuses on a single action sequence.
not provide enough evidence to create design recommendations and invalid predictions often prevent formulation of firm design or redesign recommendations. According to Rosson and Carroll (2002), analytic summative evaluations are also considered as an inspection method. Summative evaluations are done at the end of the design process to measure the quality of a product and answer questions such as “does the system meet its specified goals?” Analytic summative evaluations produce interpretations and are only observations of the system to determine if usability guidelines were followed (Rosson and Carroll, 2002). They also suffer from user response bias and recall issues because they are completed after task performance.
their design features and all relevant positive and negative implications of each design feature are listed. This approach can help to select among alternative designs, and clarifies the questions to be analyzed through user testing by stating how the design should work as a set of well-defined claims. Over the course of ten weeks, the analyst analyzed the system using their given UEM. The resulting lists of problems were given to a developer and he decided which problems were real usability problems that he wanted to change, which was considered the persuasive power metric. Given the decisions made by the developer, cognitive walkthroughs, the GOMS model, and reading produced the fewest non-usability problems. After the developer fixed the problems he felt were worth fixing, the researchers then conducted a usability test. The problems that were not fixed were monitored. After the test was completed the results were put into the
effectiveness tree. Most of the problems from the walkthrough and heuristic evaluations were fixed. About half of those problems resulted in fewer problems when users used the new system. However, the other half either resulted in the same problems or more problems. Because of these results it is probably best to use UEM methods in conjunction with other methods.
interactive system use, user responses are then based on afterthoughts, which may be influenced by the information they have learned while completing the rest of the task. On the positive side, verbal reports are a good way to gain insight into cognition and information from someone’s short-term memory. Through research, it has been shown that verbal reports are good for iterative design changes but not formal evaluations (Karat, 1997).
Surveys and questionnaires can be implemented in many ways. Surveys can have free- form questions, rating questions, and even “Yes” or “No” questions. Questionnaires, like inspection-based methods, are fairly inexpensive and easy to distribute. Questionnaires should ask about specific user experiences, not hypothetical situations, and can assist in finding usability problem spots present in an interface (Karat, 1997; Gould, 1988). The use of rating scales, rather than short answer questions, can allow data to be quantified and put into charts (but typically not submitted to statistical analysis). Because the information received through surveys and
questionnaires is gathered after the completion of a task, some information about the experience will be lost due to human memory limitations. Even though some questionnaires can be
quantified, free-form surveys cannot. It has been recommended that questionnaires accompany verbal reports in usability analysis in order to serve as a means for validating verbal report responses (Karat, 1997; Gould, 1988). Karat (1997) said questionnaires should be used during iterative design in order to use the feedback to create better designs.
these methods can be low cost, such as the surveys and expert evaluations (heuristic-based evaluations), while others can be rather expensive, such as verbal reports developed through user testing. The setup cost, including creating a usability lab, for such analyses can be expensive, but it is a one-time cost. Much of the overall cost comes from subject recruitment and
honorarium fees for participation in test runs. For these reasons, often companies outsource usability analysis work; however, this may be more expensive than doing a test in house.
The low cost method of usability inspection, as stated before, may only be
complimentary to user testing. Surveys do not provide as much insight into problems as user testing; therefore, in order to obtain useful information, iterative user testing is still needed. An interface that was first inspected by an expert, then tested by users, resulting in verbal reports, and followed by surveys, is a good way to gain enough information to create a user centered design. Therefore, the money that it takes to do testing will still be applied later on, iteratively in the design cycle.
2.3.2 Quantitative Measures
to sales, the researcher can show how the percentage of persons that could not complete the task directly impacts business and profit.
According to Wixon and Wilson (1997), however, sometimes in usability testing, goals are too ambitious or there are too many goals. A process may also be too complex for testing or the design team is unwilling to cooperate and does not completely explain to the usability engineer how the product works. Beyond this, usability tests cannot cover entire systems and participants may not show up for testing. This is a sample of the problems that occur in usability testing in attempting to generate quantitative measures. Some of the most common quantitative measures include measures of satisfaction and fuzzy sets theory and objective measures such as correct tasks completed, task completion time, and time in a particular mode of system operation. These methods and their specific advantages and disadvantages are presented here.
2.3.2.1 Quantitative Subjective Measures
when a researcher asks how easy was this task on a scale of 1 to 10, with 1 being very difficult and 10 being very easy, the user may say 9. However, during the task the user may not have been able to complete the task without prompting.
Fuzzy sets apply set theory to fuzzy logic. In set theory, an item either does or does not belong to a set; however, with fuzzy sets, functions are defined to determine a grade of
membership of an observation into a set using values between 0 and 1 (probabilities). If an element maps to the value of 0, it is not included in a set, but if its value is 1, it is a full member of the target set. With respect to usability evaluation, fuzzy sets theory has been used to assess which interface design alternatives are superior, based on the opinions of users (Nagasawa, 1999). In logic, if a person says that alternative A is better than B and B is better than C, then A must be better than C. However, in sensory evaluations this is not always true. Seeing that sensory evaluation cannot always be evaluated with logic, Nagasawa (1999) applied Fuzzy structural modeling to usability evaluation in order to deal with frequent inconsistencies in user sensory evaluations. He took 8 VCRs and recruited 12 panelists to evaluate them in terms of usability dimensions, such as ease of operation and understandable sequences of operations. The panelists gave responses like “fairly good” and “fifty-fifty” in evaluating pairs of VCRs against each other. Nagasawa next obtained means for the various evaluation grades. He then used fuzzy sets theory to find a range for comparison of each pair of VCRs in each category between 0 and 1 in order to create a fuzzy reachability matrix. The matrix showed the relationship between each pair of VCRs. The numbers were used to create hierarchical structures to
determine the design features needed to create a highly usable VCR. This method was based on user testing and did not attempt to reduce the effects of learning and trial order effects in subject use of the evaluation methodology.
2.3.2.2 Quantitative Objective Measures
Objective measures are measures based on data, such as the number of correct tasks completed or task completion time. Many objective measures, according to Hornbaek (2005), are measures of effectiveness and efficiency. Measures of effectiveness include: binary task completion, number of correct tasks completed, and task performance accuracy (error rates, spatial accuracy, and precision) as mentioned earlier. Precision is considered the ratio between correct information retrieved from a system for performance and the total amount of information retrieved. Measures of efficiency include: task completion time, time in mode, time until an event, input rate (e.g., words per minute), mental effort, usage patterns (how users make use of an interface to solve tasks), use frequency, information accessed (the amount of information users access or employ to complete a task), and degree of variation from an optimal solution (the ratio between actual behavior and an optimal method of solution). All of these measures take a count of concrete occurrences during interface testing and are not based on the opinions of users.
Fuzzy sets have also been used to assist in an objective evaluation of interfaces. Chang and Dillon (2006) used fuzzy sets to evaluate if an interface was “good”, “average”, or “poor” (as a measure similar to the measure of effectiveness). First, heuristic evaluations were completed to identify “good”, “average” or “poor” system interfaces (for several web
applications) in terms of usability. Fuzzy sets logic was then applied to determine the number of interface inadequacies associated with evaluator judgments of “good”, “average” or “poor”. Next, the researchers used test subjects to complete a set of work-related tasks with the same system and each instance of inadequacy was recorded across six dimensions (system feedback, consistency, error prevention, performance/efficiency, user dislike and error recovery). The fuzzy sets logic determined that between 0-3 instances of inadequacies on any dimension was considered “good”, 4-7 “average” and 8-10 “poor”. For each task interface, using the six dimensions and the number of inadequacies, an aggregate score was produced. All of the
and reduces the need for iterative user testing. It also applies variable weighting factors on the dimensions of system effectiveness.
2.3.2.3 User Modeling
With user modeling, a researcher can collect quantitative and empirical data. User modeling is a fairly new development and has been used to predict interface action sequences based on prior use data. It can sometimes be used to determine if a user does not perform a correct action based on what a program expects a user to do. According to Fischer (2001), an early example of user modeling was the WEST system. The WEST system was a coaching system for “How the West Was Won”, a game similar to “Chutes and Ladders”, where the players had to form mathematical equations from spinning a wheel to determine the amount of spaces they could move. The users did not always select the best strategy and the WEST system coach pointed out the optimal move on a board. The WEST coach is an example of where user modeling is used to determine optimal interface action needs. This system also showed that humans do not always act as a programmed computer would, seemingly a flaw in user modeling. User models often do not take into account cognitive processes such as learning, and memory retention; therefore, representation of actual human performance may be limited in some cases.
User modeling is also used to observe human behavior. Fischer’s research (2001) also referred to help systems that employ user modeling. An example of a help system is Activist.
for Activist to help, it recognizes what the user is attempting to do, evaluates the user’s method in achieving a goal, constructs a model (from information over long usage periods) of the user, and it decides when and how to interrupt performance with useful information for completing the task at hand.
A common user modeling technique that has been researched over the last few years is GOMS modeling. It is used to predict and explain real-world task performance with interactive systems. A GOMS model shows how a user interacts with a system and shows how he or she performs tasks based on the hierarchical structure of Goals, Operators, Methods and Selection Rules (Card et al., 1983). According to Mosqueira-Rey et al. (2004), the goal is what the user is attempting to accomplish with the software or application. These goals may be subdivided and put into a hierarchical structure. Operators are atomic actions performed to complete the goals. Methods are the sequences used to achieve the goals that may also be performed simultaneously. Selection rules are rules used to decide which method is optimal in performing a specific goal, chosen from a group of feasible goals. According to Rosson and Carroll (2002), a GOMS model is first created by using human performance data to estimate the time required to complete each task. An advantage of using GOMS modeling is that it can produce accurate predictions of user actions; however, the model takes time to create and cannot account for higher level human cognitive behaviors such as learning and problem solving.
to estimate their duration, based on other tasks recorded in the log. The VISNU tool was used to integrate the two methods. First, the GOMS model was created for the system in its design phase. Next, the prototype was given activity logging capabilities, which were used to complete empirical studies to capture user data. The log files were analyzed with the different tasks identified and the data was used to instantiate the initial GOMS model comparing the a priori predictions with real a posteriori data. The researchers used this model with an email tool. The initial GOMS model found the same errors as the refined model based on the empirical data.
According to Kobsa (2001), some of the benefits of user modeling include: (1) the demonstration of notions about one or more types of users through models of individual users, (2) the depiction of pertinent common characteristics of users that apply to specific user
subgroups working with application systems, (3) the organization or grouping of users in either one or more of the subgroups, (4) the incorporation of typical characteristics of user subgroups into individual user models, (5) the logging of user behavior, (6) and the development of assumptions about the user based on past interaction history. Kobsa (2001) also suggests that new user modeling techniques are focused on personalization for individual users. They have qualities that help with personalization such as quick adaptation, extensibility (where a company can integrate company goals into the model personalization process), load balancing to
2.3.2.4 Summary of Quantitative Measures
Quantitative measures can provide meaningful information to companies. Statistical analysis can be prepared with quantitative data. Along with statistical analysis, charts and graphs can be created to present usability evaluation results. Software development company
management can determine the impact of usability issues in the design of a system, from such outcomes. Quantitative data is most useful when it is objective because user’s bias in opinion does not influence results. Quantitative data is, however, usually gained through user testing, which can be expensive, especially when it is used in iterative design processes.
Quantitative measures appear to be better than qualitative measures for detailed usability problem analysis and formulating design recommendations. However, qualitative measures may be necessary because they can eliminate some problems before user testing begins. Since
quantitative measures are often necessary to gain support from management for addressing usability problems in design, a method is needed to reduce the requirement for recruiting subjects for testing during iterative design. User modeling is a quantitative measurement approach that can decrease the cost of iterative testing. Combining user modeling with subjective usability measures may provide an integrated analysis approach that is effective in terms of finding problems and providing an adequate basis for interface redesign.
2.4 Operations Research Methods of Usability
optimization including linear and nonlinear programming, stochastics, game theory, graph theory and simulation. Operations Research has been instrumental in improving the design of entire systems versus specific elements (e.g., Polaris Missile Project (Ravindran, Phillips & Solberg, 1987); or a distribution center’s logistic issues). Operations Research is often used in facility layout, telecommunication network design, manufacturing system design, and scheduling. Only a few HCI studies have historically used OR methodologies as a technique for improving
usability. However, a considerable amount of research is currently being conducted in this area to determine how usability can be assessed and improved using Operations Research methods. Some of the techniques currently being used to advance usability in HCI are stochastics and optimization. Some stochastic methods include Markov models and probabilistic finites state models. An optimization method that is also being used is the critical path model. The purpose of this section is to present some examples of how OR methods have been used to improve usability in the past and to provide further direction to the current work in developing an objective, model-based measure of usability.
2.4.1 Markov Chain models
Markov chains are stochastic processes that take on a finite or countable number of possible values. There is a set of states X. The process is said to be in state i at time n. Whenever the process is in state i, there is a fixed probability Pij that it will next be in state j.
There is a conditional distribution of any future state Xn+1, given the past states X0, X1,…, Xn-1
and the present state Xn. The Markov chain value is independent of the past states and depends
only on the present state. Pij represents the probability that the process will, when in state i ,
a transition into some state,Pij ≥0,i,j≥0, 1 0 =
∑
∞ = j ijP , ,...i=0,1 . P denotes the matrix of
transition probabilities Pij,so that P=
L L L L M M M M 3 2 1 0 13 12 11 10 03 02 01 00 i i i
i P P P
P P P P P P P P P .
Using Markov chains in the above work created a better user experience by helping the customer to access information needed at the correct time. The system used the stochastic model to provide output that was most expected by a user in order to complete a given task. It also helped the company provide web services that guided users to buy items based on the models considering previous behavior data. Even though this research provided useful output for users, promoting website usability in terms of access to relevant information, the modeling approach did not help eliminate other usability issues (e.g., effective navigation within the menu system).
Markov models have also been used to model user behavior and create algorithms that predict user actions in order to determine measures such as the number of mouse clicks it takes to find relevant information on a website and the number of steps needed to complete a task by simulating human actions. According to Kitajima et al. (2005), usability specialists can use algorithms created by Markov chains to determine the average number of clicks it takes to find, for example, relevant articles on a website. The algorithm was first applied to the original website interface and then used again after applying usability improvement techniques to the site in order to determine if the average number of clicks was reduced. In order to create such Markov models, user testing was initially completed. Behavior state observations were then coded in transitional probability matrices, and an algorithm was created and validated by
comparing it to the initial data. This research was considered as a key basis for the new usability evaluation approach developed in this study.
Thimbleby et al. (2001) applied Markov chains to several applications such as a
to get to a specified state, then the interface operation was considered “hard” and if it only took a few steps, it was considered “easy”. This analysis was restricted to homogenous Markov chains so the probabilities were not conditional (based on prior action or learning).
In this research the authors modeled the devices to estimate the average number of button presses to an absorption state. This method of modeling a “random” user produced step counts unrepresentative of actual user behavior in learning a new system. Consequently, the
improvement facilitated by the simple device redesign was less than convincing. Modeling actual user behavior can provide a more realistic approach to finding the average number of steps to reach a desired device goal state.
Markov Chains are easy to simulate and this method is fairly accurate. According to Thimbleby (2004), a model interface can be built with a matrix program to capture transitional matrices. It is then easy to simulate a user’s actions and analyze task time and/or number of steps to complete actions. A usability specialist could use this type of method during a
prototyping process to determine the level of difficulty of an interface and to formulate specific design changes. The analyst could then use the method later on in the design process with the same state transitional probability matrices with another iteration of the system prototype in order to determine if the degree of difficulty was reduced by design modifications.
2.4.2 Probabilistic Finite State Models
comparison between alternative human computer interfaces. The purpose of the research was to show the modeling technique only. The modeling technique used an approach in which
probabilistic state models of use of prospective human computer interfaces were constructed from data collected during experiments. Traditional models have a certain set of parameters that include transition probabilities, a set of time distributions, etc. These parameters are defined for each interface. Time distributions and state transitions probabilities must be developed through experimentation.
To collect the data in this research, a group of software engineers were trained, evaluated, and ranked on use of two alternative simulator interfaces. After they were ranked, they
state splitting, etc. and the data collected from the homogenous population, the algorithm for the interface converged to a single probabilistic finite model that could be used for evaluating interface design alternatives (Sholl et al., 1991). This research however only described the modeling technique.
2.4.3 Critical Path Models
Critical Path Analysis, or the critical path method (CPM), is an algorithm that determines the longest time between the start and finish of a project or action sequence. CPM is often used in project scheduling as an OR technique to determine how long a project will take. It can also incorporate stochastic predictions by using the Project Evaluation and Review Technique, commonly known as PERT. CPM involves use of a network that contains nodes and arcs that represent activities of the project and interconnections among activities as well as delay times. CPM takes the critical elements of an action sequence that must be completed and determines the longest time that it will take to complete the sequence. Using this method the time of a project can be determined.
exclusive, alternative, concurrent, and synergistic. The types of models depended on whether the tasks and/or goals were either independent or dependent. Exclusive models included
independent goals and dependent tasks. Alternate models included dependent goals and dependent tasks. Concurrent models included independent goals and independent tasks. Synergistic models included dependent goals and independent tasks.
An exclusive model was developed on the task sequence in viewing vehicle registration numbers that were scrolled across a display screen. The user was then required to enter the numbers into a computer by either using speech entry or keyboard entry but no correction was available for either condition. The user could also change the rate of the numbers that scrolled across the display. The cursor keys could be used or the user could say faster or slower to increase and decrease the scroll rate (NLP). The alternative model was used in target identification where the users were required to select a geometric shape, using speech or a trackball. Once the shape was selected, a zoom command was used by speech selection or manual activity and detailed information on the object was reported. Task dependency was demonstrated in this task because one task had to end before another could begin. For the
concurrent sequence, the user had to identify targets while also completing an extra activity. The users were given a number before they were asked to look at targets. During target identification they were asked to add and subtract from the given number. In the synergistic model, the
Each of the previously discussed scenarios was modeled to predict transaction times for a given situation. To validate the models, Baber and Mellor (2001) tested them against user transaction times with the same tasks. A simple regression was conducted on the predicted and observed results yielding an R-squared value of 0.987, suggesting that the models accurately depicted real-world actions.
In Gray et al. (1992), CPM-GOMS was used to evaluate workstation designs for the telephone assistance operators (TAO) including an existing system and a proposed workstation. Samples of actual operators used each station and the validity of GOMS modeling for predicting performance was assessed against the human performance data. The existing workstation had functionally related keys that were color coded and spatially grouped and, as a result, common sequencing keys were spread apart. The proposed workstation tried to minimize those distances and icons were added to the display interface. Because TAOs perform tasks in parallel, the method used for modeling their actions was a critical path model. A critical path was used to determine the longest time it took to complete calls of different categories using both systems. The critical path for the proposed system took 0.8 seconds longer than the current system and was projected to result in a $2.4 million increase in operating cost.
real-world performance. Results demonstrated that the models explained about 70% of the behavior in using the workstations. The GOMS model was considered to do a good job of predicting the actual behavior of the TAOs. This method can be considered a bridge between GOMS models and OR models, in particular, critical path models.
2.4.4 Summary on OR methods
3.0 SUMMARY AND PROBLEM STATEMENT
In order to facilitate usability improvements in complex interface design, there needs to be a foundation or framework to describe how humans and computers communicate. If
researchers can model this communication, they can effectively create designs that reduce cognitive and computational loads for performance, effectiveness and efficiency. Of the three frameworks discussed, Norman’s model, Abowd and Beale’s model and the Pipe-Line model, Abowd and Beale’s model of interaction was observed to describe human interaction with computers in a more robust and parsimonious way than the other two models. Norman’s model is more concerned with the human thought process and not the continual (parallel)
communication cycle between the computer and the human. Furthermore, it does not explicitly represent the interface between the human and machine system in modeling interaction. The Pipe-Line model focuses more on the computational process of the computer and to a lesser extent on the human cognitive process. Abowd and Beale’s model takes into account the human, the computer and interfaces, and represents a more continual cycle of interaction. Using this framework, designers and users can conceptually categorize different systems and begin to evaluate usability for selection between a set of usability paradigms; that is, alternative interface designs for particular applications.
Usability paradigms and principles are important because they help usability analysts determine what types of new technologies are available to improve systems and they provide direction in how to evaluate system usability. In this research, different paradigms are
NLP interface represent extremes of user articulation and machine command translation, they can also be seen as representing the maximum and minimum distances between the user or system and the interface in Abowd and Beale’s HCI framework. In this research, the WIMP interface paradigm was tested for accommodating both the user and the system in terms of a new measure of usability. Using a WIMP interface as a basis for an online ordering system design was expected to reduce the conceptual distances between the user and the interface, or the system and the interface, as much as possible (relative to other paradigms), without making the task of language translation complex for either entity.
There are many subjective measures that are used today as a basis for improving usability. Usability analysts use subjective data to make design decisions. These decisions are based solely on the opinions of users. Even though a user may say a task is easy they may have had enough trouble with an interface to cause a test moderator to help the user complete the task. This example suggests that using subjective data alone may not be a sufficient method of
measuring and evaluating usability. Beyond this, qualitative data is not easy to analyze. A usability analyst cannot create charts and graphs to present to company management with qualitative data from open-ended survey questions and the ability to conduct statistical analysis on such data is limited. Even though subjective measurement methods tend to be low cost, they are also usually low in discovery of major usability issues, which might otherwise be discovered if user testing was conducted.
quantitative data requires iterative user testing it can be very expensive. Given this expense, a method that can reduce the amount of testing involving end-users for quantitative data would be preferable to companies. For this reason, various approaches to user modeling, including GOMS have been developed to predict user behavior. These methods have been demonstrated to be successful in quantitative evaluation of complex interfaces in real applications. Because some subjective measures are instrumental in revealing usability problems and objective, quantitative measures are important for identifying design solutions to actual problems that may be
encountered in real work environments, it is generally recommended that both types of measures be used to evaluate the effectiveness of a system.
Operations Research has been used to optimize entire systems but has not been used frequently to evaluate usability. Operations Research techniques can be used to create user models and generate quantitative evaluation data, possibly eliminating the need to recruit and pay large samples of users for testing interfaces. Use of Markov Chains is easy to implement and appears to be an accurate way to determine specific quantitative attributes of an interface that influence usability and performance. Markov Chains can be constructed to model user behavior and they can be integrated into interactive systems to drive the presentation of more meaningful output for users (e.g., in web-based applications). Currently, Markov Chains have been used to either measure usability in terms of user input requirements or to predict more meaningful display output for users in search tasks.
4.0 METHOD
4.1 Overview of System Effectiveness score
The Abowd and Beale interaction framework and designer and user surveys were used in conjunction with Markov model predictions of the average number of clicks at an online
interface in order to determine the system effectiveness score. Each link between the nodes in the Abowd and Beale model represents a user or system language translation that affects overall system effectiveness (See Figure 3). More specifically, the link between the user and the
interface input (articulation) represents how well the user’s goal matches the input state of the system. The link between the input and the system (performance) determines if each input has a logically mapped function. The link between the system and the interface output in the
framework (presentation) represents the accuracy and completeness of system state information provided to the user. The link between the output and the user (observation) represents how well a user can interpret the output from the information display. In order to determine a system effectiveness score, all of these links need to be evaluated.
When designing a system for “optimal” usability, designers may consider some links in the framework to have a higher priority than others. The priority or importance of each link may also vary across design paradigms. With this in mind, for usability assessment, there is a need to capture the designer’s perception of importance or weight of each link of the Abowd and Beale framework in design. If users are able to rate system design in terms of the links in the