BUSHEL, PIERRE ROBERT. Clustering of Mixed Data Types with Application to
Toxicogenomics. (Under the direction of Gregory C. Gibson.)
DNA microarray analysis provides unprecedented capabilities for simultaneous
measurement of genome-wide alterations in transcription levels. Toxicogenomics
bridges gene and protein expression analyses with conventional toxicology to elucidate a
global view of the toxic outcomes and mechanistic changes elicited by toxicant exposure
and environmental stressors to biological systems. Inherent in toxicogenomics data are
systematic error, stochastic variation and disparate measurement domains and types
which complicate the acquisition of significant, meaningful and broad biological
interpretations from analysis of the data. In this dissertation, a classification regimen
comprised of analysis of replicate data, outlier diagnostics and gene selection procedures
was employed to utilize microarray data for categorization of sub-classes of biological
samples exposed to pharmacologic agents. To assess contrasts of centrilobular
congestion severity of the rat liver subsequent to exposure with acetaminophen (APAP),
microarray data, clinical chemistry evaluations and histopathology observations were
integrated in a database and analyzed using mixed linear model approaches. Finally, the
k-prototype algorithm with a mixed objective function comprised of the sum of the
squared Euclideandistance to measure the dissimilarity of samples based on microarray
array and clinical chemistry numeric data features and simple matching to measure the
objective function included weighting terms for the microarray, clinical chemistry and
histopathology domain data in order to computationally integrate the data as well as
constrain the clustering of the APAP-treated samples according to similarity of gene
expression and toxicological profiles. Simulated annealing optimization of the Modk
(SA-Modk) –prototypes algorithm was used to validate the clustering of the
APAP-treated samples. The clusters were vetted for gene expression and toxicological (VETed)
k-prototypes features that discerned clusters from one another. The VETed k-prototypes
are shown to be ideal for distinguishing between zero, minimal, and moderate levels of
necrosis of the hepatocytes and centrilobular region of the rat liver that are end-point
representations of the clusters of APAP-treated samples.
In this dissertation, chapter 1 is an introduction to general toxicology, microarray gene
expression array platforms, experimental designs, preprocessing of the data and gene
selection approaches, toxicogenomics as it applies to compound classification and
phenotypic anchoring of gene expression, databases and informatics resources for
toxicogenomics and clustering of mixed data types. Chapter 2 is dedicated to statistical
validation and significance of differentially expressed genes as well as sub-categorization
of samples exposed to phenobarbital and peroxisome proliferators clofibrate, gemfibrozil
and Wyeth 14, 643. Chapter 3 presents integration of microarray data with clinical
chemistry and histopathology data to contrast levels of centrilobular congestion of the rat
liver by mixed linear modeling of gene expression ratio values acquired from rats
version of the Modk (SA-Modk)-prototypes objective function, for computational
integration of microarray, clinical chemistry and histopathology mixed numeric and
categorical data. It also includes partitioning of APAP-treated biological samples into
clusters which contain vetted expression and toxicological (VETed) k-prototypes features
that distinguish between levels of necrosis of the hepatocytes and centrilobular region of
the rat liver. In chapter 5, a conclusion of the research, development and analyses
Clustering of Mixed Data Types with Application to Toxicogenomics
by
Pierre Robert Bushel
A dissertation submitted to the Graduate Faculty of North Carolina State University in
partial fulfillment of the requirements for the Degree of Doctor of Philosophy
BIOINFORMATICS
Raleigh
2005
APPROVED BY:
_____________________________ ______________________________
Gregory C. Gibson Spencer V. Muse Chairman of Advisory Committee
_____________________________ ______________________________
Russell D. Wolfinger Robert C. Smart
Dedication
This thesis is dedicated to my loving wife Geri and my wonderful children Ariel Cierra
and Jerrel Garnet Charles. You are my world, my heart and my life. Thank you for your
Biography
Pierre Robert Bushel was born in Brooklyn, New York on July 10, 1963 to Gloria
Delphine and Charles Joseph Bushel. In 1980 he finished his high school education at
Clara Barton High School for the Health Professions in Brooklyn, New York. Pierre
attended the University of Massachusetts, Amherst from September 1980 to May 1984
where he received a Bachelor of Science degree in Zoology. Returning to Brooklyn,
New York, Pierre attended the City University of New York, Brooklyn College from
September 1984 to May 1985 to study graduate level biology. In the summer of 1985 he
transferred to Long Island University, Brooklyn, New York, from 1986 to 1990 he
worked fulltime with Dr. Arthur Bank and then Dr. Maggie Allan as a laboratory
technician at Columbia University College of Physicians and Surgeons Genetics and
Development department with a dual appointment with the department of Medicine
performing amniocentesis screening of Sickle Cell Anemia and engaged in basic research
on transcription regulation, and in September 1989 he received a Master of Science
degree in Molecular and Cellular Biology from LIU.
Armed with junior level experience and training in molecular biology, Pierre worked
with Dr. C. Chandra Kumar as an associate scientist from 1990 to 1996 in the Tumor
Biology department at the Schering Plough Research Institute in Kenilworth, New Jersey
investigating serum response elements mediate transcriptional repression and applying
transcription factor-DNA binding complex research to drug screening assay development.
and data analyst in the Genomic and DNA sequencing core laboratory at the Novartis
agribusiness facility in Research Triangle Park, North Carolina from 1996 to 1998 and
from management of the DNA sequencing facility at Synaptic Pharmaceuticals in
Paramus, New Jersey in the summer of 1998.
Returning to North Carolina in the fall of 1998 Pierre worked for the OAO Corporation
as the scientific expert providing bioinformatics contract support services and database
development to the National Institute of Environmental Health Sciences, Microarray
Center directed by Dr. Cynthia (“Cindy”) A. Afshari and the Laboratory of Molecular
Carcinogenesis headed by NIEHS’ scientific director, Dr. J. Carl Barrett. In May of
2000, Pierre was provided a government position with NIEHS to serve as the
Bioinformatics Manager for the Microarray Center and was solely responsible for
developing the NMC MicroArray Project System database. For his efforts, on December
15, 2000, Pierre was awarded the National Institutes of Health Award of Merit for
dedicated, innovative development of a functional bioinformatics and analysis program
for the NIEHS Microarray Center. With the encouragement of Dr. Barrett and the
support of Dr. Afshari and Dr. Kenneth Olden, the Director of NIEHS, Pierre applied to
the North Carolina State University Bioinformatics Ph.D. program in December 2000 and
since August of 2001 he has been studying for his doctorate degree by taking a variety of
statistics, genetics, toxicology and computer science courses while researching hidden
Markov models and optimization of statistical objective functions for clustering gene
While attending graduate school at NCSU and working under the direction of Dr.
Raymond (“Ray”) Tennant for the National Center for Toxicogenomics along with
managing the NCT\NIEHS Microarray Center bioinformatics group under the
coordination of Dr. Richard (“Rick”) S. Paules, Pierre has served as staff member for the
NCT Chemical Effects in Biological System knowledge base development efforts
providing bioinformatics expertise, technical oversight and project guidance related to
informatics implementation. On December 14, 2001 Pierre was awarded the NIH Award
of Merit for his part in conceptualizing, initiating, implementing and effectively
executing the Toxicogenomics Research Consortium and the following year on June 19,
2002 Pierre was awarded the prestigious NIH Director’s Award for his part in furthering
the NIEHS Toxicogenomics Research Consortium.
As the demand for microarray services grew at NIEHS, Pierre’s responsibilities extended
beyond managing the NMC bioinformatics group to implementing statistical analysis
methods, researching artificial intelligence strategies, exploring knowledge discovery
techniques and developing novel computational algorithms for mining gene expression
data acquired from toxicological experiments. As a result, Pierre was presented the NIH
Award of Merit on December 19, 2003 for superior accomplishment in the successful
application of Toxicogenomics to understanding the toxicity of acetaminophen and other
hepatotoxic agents. In February 2005, Dr. Tennant bestowed Pierre with the designation
of coordinator of bioinformatics for the CEBS knowledge base to oversee and direct the
Acknowledgements
First and foremost I give honor and praise to my Lord Jesus Christ for blessing me
throughout life with good health, drive, determination and all of my faculties to pursue
education on all levels and for a rewarding livelihood is science. I give Him all the credit
and lift Him up for all of my accomplishments, past, present and future. I acknowledge
and give thanks to all the scientists, my family, friends, colleagues, employers, educators
and fellow graduate students who supported me and afford me the opportunity to apply
myself to the challenges and mysteries in the field of science. To Dr. Dennis Curley,
Professor Emeritus, thank you for seeing me through my Master of Science thesis and
graduate program at Long Island University, Brooklyn, New York. The appreciation of
molecular biology that I acquired at LIU was invaluable to my Ph.D. training in
bioinformatics. You are an inspiration to me. To Dr. Arthur Bank, Division Chief of
Hematology and Professor of Medicine, you started me off on my career of science at
prestigious Columbia University College of Physicians and Surgeons. Thanks for seeing
the potential in me, believing in me and opening the door to the practical world of science
to me. To Dr. Maggie Allan, I owe the world to you my dear! Thank you for teaching
me the fundamentals of hypothesis formulation, critical thinking, persuasive writing,
presenting and analyzing scientific material with confidence at a high-level so early in
my career in science at Columbia University College of Physicians and Surgeons.
You’ve molded my mind for science in an immense way, showed me how to really
appreciate molecular biology and left an indelible impression upon my life. To Dr. C.
appreciate all the opportunities you provided for me to apply basic science principles to
pharmaceutical research and development, exploratory and investigative science but most
of all for introducing me to the basic understanding of tumor biology. To Dr. Cynthia
(“Cindy”) A. Afshari, Associate Director of Toxicology at Amgen Inc., words cannot
express the impact you have had on my life while employed at the National Institute of
Environmental Sciences. The experience and opportunities you afford me carried over
distinctly into graduate school. Thank you for the unconditional and unfaltering
confidence and trust that you place in me to apply biological knowledge and informatics
to devise bioinformatics solutions for the NIEHS Microarray Center. I deeply appreciate
your support, encouragement and guidance in all fashions of my life. I owe all gratitude
to you for your generosity and for the backing you gave me to advance my scientific
education and profession. To Dr. J. Carl Barrett, Scientific Director and Laboratory
Chief of the Laboratory of Biosystems and Cancer, National Cancer Institute, your
question to me on the plane back from Washington, D.C. regarding “so when are you
going to get your Ph.D.?” rang ever so loudly and clearly! You lit the fire under me to
start the Ph.D. process and initiated my pursue for formal instruction in biosciences.
Thanks for sounding the alarm, for the encouragement for me to get what I so rightly
deserved and needed for my career in science as well as for making yourself very much
approachable and available to me considering the substantial demands on your time while
you served as the Scientific Director at NIEHS. To Dr. Raymond (“Ray”) Tennant
Director of the National Center for Toxicogenomics and Dr. Richard (“Rick”) S. Paules,
Director of the NCT Microarray Group, I am deeply thankful for the provision of a
absorbed in graduate school. Thanks to NIEHS as a whole for support through
employment and intellectual stimulation during my graduate training. To Dr. Bruce
Weir, William Neal Reynolds Professor of Statistics and Genetics, Director of the
Bioinformatics Research Center and Coordinator of the Bioinformatics Ph.D. program,
North Carolina State University, and Dr. Barbara Sherry, Professor of Virology College
of Veterinary Medicine and Director of Genomic Sciences graduate program, NCSU, I
sincerely thank you both from the bottom of my heart for opening the door for me to
enter into the Bioinformatics Ph.D. program and for helping to make my transition into
and through the training process a manageable one for me. You two never cease to
amaze me with your profound devotion and commitment to the students in the Genomic
Sciences program and the way you embrace student’s interest in furthering their learning
in biosciences, genetics and mathematical statistics. I sincerely hope that my career in
science will, at the very least, emulate what I’ve absorbed and taken away from my
interaction with you since your unique style and respect for the sciences and people
across the world in general are not able to be duplicated. To Dr. Robert C. Smart,
Professor and Director of Molecular and Cellular Toxicology Concentration, NCSU, I
greatly thank you for your guidance and influence in the realm of toxicology as it applied
to my graduate research. You made fusing the discipline into my field of study a
recognized importance. To Dr. Spencer V. Muse, Associate Professor of Statistics and
Genetics, NCSU, I thank you for instilling the challenges of statistical theory into my
graduate program and my educational learning. With your encouragement I built up a
fair degree of confidence for statistical theory and appreciation for the importance of
career. To Dr. Russell D. Wolfinger, Statistician and Director of Genomics Analytical
Solutions Division at SAS Institute, Inc., I appreciate the time and consideration you
extended to me throughout my graduate training and in my professional life. I thank you
wholeheartedly for sharing your expertise, interest, advice and desire to merge
fundamental statistical inference with biological data analysis. I sincerely hope that as I
further my career in bioinformatics, we will have more opportunities to combine our
expertise for the betterment of biomedical scientific data analysis and interpretation. To
Dr. Gregory C. Gibson, Chair of the North Carolina Task Force on Genomics and Public
Health and Associate Professor of Genetics, NCSU, thank you ever so dearly for
overseeing my Ph.D. program. I thank you from the bottom of my heart for embracing
me as a graduate student and leading me through the challenges of the graduate program.
I respect you as a scientist, mentor, teacher and person. I am fortunate to have had you as
my graduate committee chair and director of my research, and to have benefited from
your appreciation of biology and genetics as well as your avid teaching style. You never
let me give up or give in when the going got tough. Thank you immensely for standing
in for me when warranted and for holding me to my promise of seeing the graduate
program through. I hold you up in high regard as my mentor for meeting with me, the
challenges of exploring and assimilating cutting-edge bioinformatics into my research
program. I sincerely thank you for all the time, effort and consideration that you
put\invested into my development into Ph.D. scientist. The rewards of your commitment
To my mother, Gloria Delphine Bushel, my father, the late Charles Joseph Bushel and
my grandmother, the late Edna Williams, a child could not ask for better parents. Thank
you for bringing me into this world, raising and nurturing me and instilling honest, hard
work, dedication and perseverance. Thank you for the support and uplifting throughout
my life and for believing in me with my desire to become a doctor. To my brother
Antoine Charles Bushel and sister Deirdre Franceker Helene Smith, thank you so much
for pulling for me all these years and as a sibling, making a difference in my life. I owe
you two big time! To my mother-in-law, Meedia Grant, and dear friends Kathy and
Connell Price, I thank you for praying me through this graduate program. God has heard
your prayers! Thank you fellow bioinformatics graduate students Wen-Ping Hsieh,
Lingkang Huang and Jianying Li for the support and feedback with hidden Markov
models, clustering and computational programming respectively. I hope to be just as
supportive and helpful to you for your graduate degree as you were to me. I thank Dr.
Pablo Tamayo, Senior Computational Biologist and Manager, Cancer Genomics
Informatics, Massachusetts Institute of Technology, and Dr. David S. Lalush, Assistant
Professor, NCSU, for their computer code, help with, and discussions about, simulating
microarray gene expression data. Thanks to the NIEHS Toxicology\Pathology group
and other scientists for generation of the toxicogenomics data and for feedback and
advice with ways of analyzing the data from a biological perspective. I also thank
Juliebeth "Jb" Briseno, Graduate Secretary for Genomic Sciences and Debra Hibbard,
Executive Assistant to the Bioinformatics Research Center Director, both of NCSU for
their administrative assistance with tracking my fulfillment of the graduate school
thank, respect, honor, appreciate and admire my wife Geri, daughter Ariel Cierra and son
Jerrel Garnet Charles for unwavering patience and tolerance during my training in
graduate school at NCSU. Geri you have been an extremely supportive wife while I’ve
been essentially unavailable to you and the family during my Ph.D. training. You are a
strong woman; the rock that holds us together. As it goes, behind every great man is a
greater woman. You are great in my eyes and the Lords eyes not just for being a
supportive wife during this critical time of my life, but for the unconditional love you
continuously exuded on an ongoing basis. Your energy and favor radiated and were the
fuel that kept me going through the graduate program. I love you for that and thank you
ever so dearly for being one with me. Ariel (“Arie”) and Jerrel (“Rel-Rel”) I cherish
being blessed with such wonderful and understanding children. I’m fortunate to have had
the chance to have you share and witness in my dedication to studying, learning, reading
and writing for the love and mystique of science. I thank you for bouncing back your
interest in what I was enduring and for keeping interest in my pursuit of a doctorate
degree over the past four years. Thank you Arie and Rel-Rel for waiting patiently for me
to finish my school work and for understanding the importance, and necessity of, me
prioritizing, as well as balancing, my responsibilities. I pray that the completion of my
doctorate degree is an inspiration to you, and memorable for you, as you grow and chase
your dreams. Mine have come true as I have a beautiful daughter and handsome son both
of whom I thank and worship God for and I’ve completed my longtime desire to become
a doctor. Remember to always assess your situations, adjust to changes and adapt to
new ways of doing things. These practices and principles, as well as commitment to the
life. We did it as I could not have completed my Ph.D. training and dissertation without
you. This was as much for you and it was for me. Thank you for being there for me and
putting up with me during the difficult and challenging times of managing my Ph.D.
Table of Contents
LIST OF TABLES... xviii
LIST OF FIGURES ... xx
1 Introduction... 1
1.1 General Toxicology ... 1
1.1.1 Basic Principles... 1
1.1.2 Liver Anatomy, Structure and Pathology ... 3
1.1.3 Mechanisms of Hepatotoxicity ... 4
1.2 Microarray Gene Expression Analysis ... 5
1.2.1 Microarray Platforms ... 5
1.2.2 Experimental Designs for Microarray Analysis... 8
1.2.3 Preprocessing Microarray Data... 11
1.2.4 Selection of Differentially Expressed Genes ... 13
1.3 Toxicogenomics ... 16
1.3.1 The State of Toxic Ignorance... 16
1.3.2 Chemical Classification and Compound Signatures ... 19
1.3.3 Phenotypic Anchoring of Gene Expression ... 22
1.3.4 Databases and Informatics ... 24
1.4 Clustering Mixed Data Types... 27
1.4.1 Data Types and Scales ... 27
1.4.3 Clustering Algorithms... 30
1.5 References ... 37
2 Computational and Statistical Selection of Differentially Expressed Genes... 53
2.1 Abstract... 53
2.2 Introduction ... 55
2.3 Methods ... 57
2.3.1 Gene Expression Data Analysis ... 57
2.3.1.1 Data Collection ... 57
2.3.2 Pattern Recognition Analysis... 58
2.3.2.1 Statistical Validation of Expression Profiles ... 58
2.3.2.2 Hierarchical Clustering ... 59
2.3.2.3 Relevance Analysis... 60
2.3.3 Gene Selection for Class Determination ... 61
2.3.3.1 Single-Gene Analysis of Variance... 61
2.3.3.2 Linear Discriminant Analysis ... 62
2.4 Results ... 63
2.4.1 Differential Gene Expression Analysis... 63
2.4.1.1 Gene Expression Profile Variability ... 63
2.4.1.2 Gene Expression Signature Outlier Detection ... 64
2.4.1.3 Toxicant Gene Expression Pattern Correlation Analysis... 66
2.4.1.4 Hierarchical Cluster Analysis of Expression Profiles ... 66
2.4.3 Comparison of Genes Selected as Informative ... 70
2.5 Discussion... 72
2.6 Acknowledgements ... 76
2.7 References ... 77
3 Integration and Statistical Modeling of Microarray Gene Expression Data with Associated Histopathology Observations and Clinical Chemistry Evaluations .... 94
3.1 Abstract... 94
3.2 Introduction ... 96
3.3 Methods ... 99
3.3.1 Microarray Gene Expression Analysis... 99
3.3.2 Mixed Linear Models Normalization and Gene Selection... 100
3.3.3 Mixed Linear Model Multiple Comparisons ... 101
3.3.4 Toxicological Measurements ... 103
3.3.5 Hierarchical Cluster Analysis ... 104
3.3.6 Data Integration Process ... 104
3.3.6.1 MAGE-ML ... 104
3.3.6.2 SQL Join ... 105
3.4 Results ... 106
3.4.1 Data Management and Integration ... 106
3.4.2 Selection of Differentially Expressed Genes ... 107
3.4.3 Modeling Centrilobular Congestion of the Liver... 110
3.5 Discussion... 112
3.7 References ... 117
4 Clustering Biological Samples Based on Microarray Gene Expression and Toxicological Data Using a k-Prototypes Objective Function ... 139
4.1 Abstract... 139
4.2 Introduction ... 141
4.3 Methods ... 146
4.3.1 Microarray Gene Expression Analysis... 146
4.3.2 Histopathology Observations and Clinical Chemistry Evaluations... 147
4.3.3 Simulation of Numeric Data ... 148
4.3.4 Heart Disease Mixed Data ... 148
4.3.5 Hierarchical Clustering ... 149
4.3.6 Modified k (Modk) –Prototypes Algorithm ... 149
4.3.7 Simulated Annealing of the Modk (SA-Modk) –Prototypes Algorithm ... 151
4.3.8 Determination of Cluster Number (k), Validation and Accuracy of Cluster Assignment... 153
4.3.9 Generation of Vetted Expression and Toxicological (VETed) k -Prototypes... 156
4.4 Results ... 158
4.4.1 Clustering Simulated Numeric Data ... 158
4.4.2 Validation of Clustering Simulated Numeric Data ... 161
4.4.4 Validation and Accuracy of Clustering Acetaminophen
Mixed Data... 164
4.4.5 Weighting Schemes for Clustering Acetaminophen Mixed Data... 165
4.4.6 Vetted Expression and Toxicological (VETed) k-Prototypes... 167
4.5 Discussion... 171
4.6 Acknowledgements ... 175
4.7 References ... 176
List of Tables
Table 2.1 MicroArray Project System modified Z-score outlier detection of
differentially expressed genes from samples treated with gemfibrozil ... 83
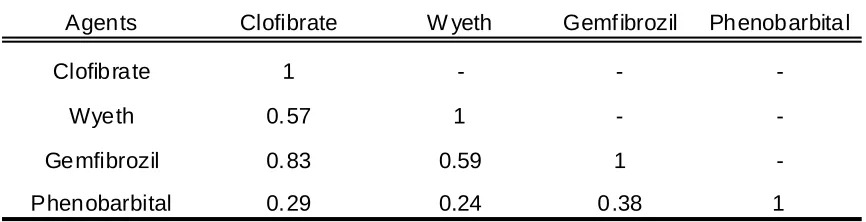
Table 2.2 Pairwise correlations of ratio intensity values of genes identifies as
differentially expressed from a sample treated with phenobarbital or one of the
peroxisome proliferators ... 84
Table 2.3 Linear discriminant analysis top ranking gene-pairs separating peroxisome
proliferators from phenobarbital ... 85
Table 2.4 Comparison of differentially expressed genes selected and ranked as
informative in the phenobarbital vs peroxisome proliferator contrast... 86
Table 3.1 Biological categories of genes from comparison of APAP-treated
samples at 6hr vs samples at 24hr or 48hr ... 124
Table 3.2 Genes identified as significantly differentially expressed between repeat
treatments of samples with 2000mg/kg APAP for 24hr ... 125
Table 3.3 Genes identified as significantly differentially expressed in at least
Table 4.1 Validation of clustering of simulated data with k set at 6 using the
SA-Modk-prototypes algorithm ... 184
Table 4.2 Count of rats with livers having a level of necrosis of the hepatocytes or
centrilobular region... 185
Table 4.3 Cluster assignment for the heart disease data ... 186
Table 4.4 Toxicology\pathology expert advice on weighting domain data... 187
Table 4.5 Validation of acetaminophen-treated sample cluster assignments
according to weighting schemes ... 188
Table 4.6 Clinical chemistry and histopathology features that distinguish between
levels of necrosis of the hepatocytes and centrilobular region of the rat liver ... 189
Table 4.7 Genes that distinguish between levels of necrosis of the hepatocytes and
List of Figures
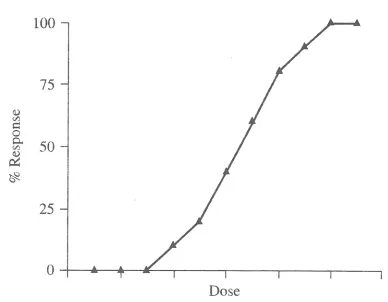
Figure 1.1. Dose response curve ... 52
Figure 2.1 Scatter plots depicting intensity and ratio values dependence and
illustrating the correlation between biological replicates ... 87
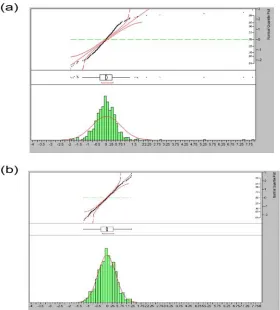
Figure 2.2 Distribution of the residuals from a one-way analysis of variance
(ANOVA) of the ratio intensity values ... 88
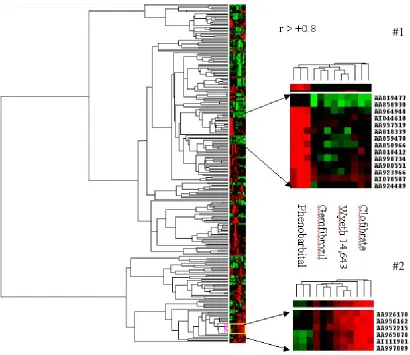
Figure 2.3 Two-way hierarchical cluster analysis of validated gene expression
profiles ... 89
Figure 2.4 Single gene analysis of variance (ANOVA) and linear discriminant analysis
(LDA)... 91
Figure 2.5 Simplified model for the gene expression classification and prediction
process... 93
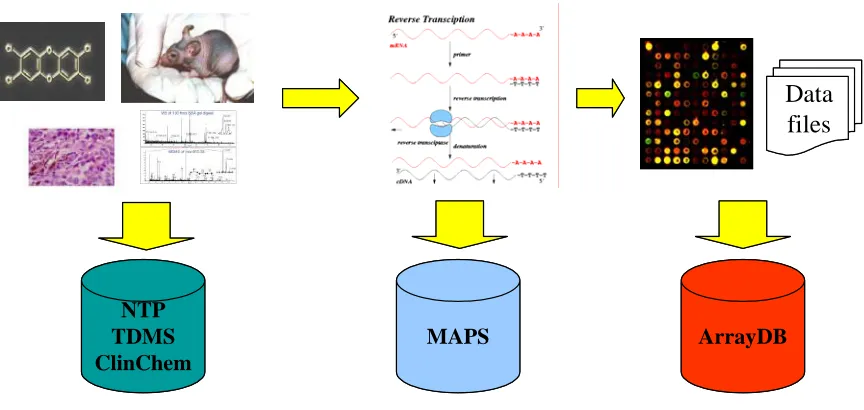
Figure 3.1 Storage domains for the Toxicogenomics data ... 127
Figure 3.2 Abridged MicroArray Gene Expression Markup Language
Figure 3.3 Mapping MAGE-ML to relational schema and database table view ... 130
Figure 3.4 Meta-data captured and integrated for analysis... 132
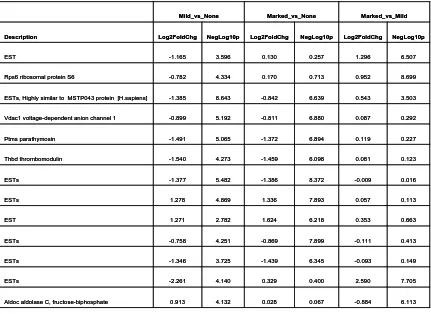
Figure 3.5 Volcano scatter plots displaying significantly differentially expressed
genes from comparisons of 6 hr treated samples to 24 hr or 48 hr treated samples .... 133
Figure 3.6 Two-way hierarchical clustering of samples and significantly differentially
expressed genes from the low dose vs high dose comparison ... 134
Figure 3.7 Principal component analysis (PCA) on genes selected as significantly
differentially expressed from at least one of the “C” comparisons ... 135
Figure 3.8 Expression profiles of the genes selected as significantly differentially
expressed from the “B” class of multiple comparisons ... 137
Figure 3.9 Volcano scatter plots displaying significantly differentially expressed genes
from contrasts of levels of congestion of the centrilobular region of the rat liver... 138
Figure 4.1 Hierarchical clustering of simulated data ... 191
Figure 4.2 Modified k- (Modk) and Simulated Annealing of Mod k- (SA-Modk)
Figure 4.3 Determination of k clusters in simulated data where k = 6 is known ... 195
Figure 4.4 Stability of the validity indices for determining k clusters... 196
Figure 4.5 Validation of the cluster assignments for the simulated data with k
clusters set at 6 ... 198
Figure 4.6 Determination of k clusters in heart disease and acetaminophen data sets
using Modk-prototypes ... 199
Figure 4.7 Hierarchical clustering and validation of the cluster assignments for the
acetaminophen data... 201
Figure 4.8 Pairwise comparisons of expression prototypes... 204
Figure 4.9 Distribution of pairwise expression prototype differences and Chi-square
Chapter 1.
Introduction
General Toxicology
Basic Principles
Basic principles of toxicology are centered on the tenets of Paracelsus (circa 1500 AD):
“All substances are poisons; there is none that is not a poison. The right dose
differentiates a poison and a remedy.” Therefore, toxicology is essentially the study of
the adverse effect(s) of a toxicant on living organisms. Toxicity of an agent depends on
the chemical properties of the toxicant, the dose exposed to, and individual as well as the
inter-specific variation in the metabolism of the agent (Hodgson, 2004). The relationship
between the dose of a chemical and the response produced follows a sigmoid curve
where, for many agents, there is a dose which no effect is observed, a portion of the curve
where response and dose are linearly related and a maximal response or effect section
where higher doses of an agent elicits no more effect (Figure 1.1). At very low amounts
of certain compounds, a no observable effect level (NOEL) or no observable adverse
effect level (NOAEL) can be determined. Dosage of a compound is often described as a
lethal dose (LD) where the response being measured is mortality (Williams et al., 2000).
For example, LD50 is the dosage, extrapolated from the dose response curve, which is
DNA of the living organism (genotoxic in nature), the shape of the curve is debatable and
for regulatory purposes, assumed to be without a threshold (Klaassen, 2001).
Acute toxicity refers to the immediate adverse effects on, or mortality of, organisms
following a single or multiple exposures within a short period of time. On the other hand,
chronic toxicity describes adverse toxic effects manifested after a long term of exposure
to a toxicant administered in small quantities. Acute effects are not elicited and lethality
is generally not manifested. Usually, the most frequent manifestation of chronic
exposure to a toxicant is chemical carcinogenesis; however, other types of chronic
toxicity such as reproductive toxicity and behavioral effects are possible. Given these
differences, the toxicity of a chemical is typically a function of dose, duration and
frequency of exposure as well as route of administration and target of exposure.
Therefore, absorption, distribution, metabolism and excretion (ADME) of toxicants are
central factors that determine the toxicity of compounds. For instance, certain toxicants
undergo phase I metabolism by Cytochrome P450 enzymes, which are involved in
oxidation and reduction reactions to metabolize compounds into intermediates species.
On the other hand, toxic agents may undergo phase II metabolism by glutathione
S-transferases, for example, which conjugate toxicants with cofactors to form metabolites
for elimination. Individual variation (age, gender, genetic, species, and strain
differences) of an organism affects ADME of a toxicant and hence the toxicity of the
Since there is the large number of xenobiotic (a chemical that does not occur in a normal
metabolic pathway) metabolizing enzymes in the mammalian liver, these are the main
source of metabolism and biotransformation of chemicals, compounds and substances.
The liver also functions to store fatty acids and glycogen. Glycolysis and
gluconeogenesis, the respective processes where glucose is converted to glycogen, stored
and converted back to glucose when needed for energy, are examples of metabolic and
biochemical synthesis processes occurring in the liver. Fatty acids are also metabolized
and converted to lipids which are then conjugated with proteins synthesized in the liver
and released into the bloodstream as lipoproteins. The liver also synthesizes functional
proteins such as enzymes and blood-coagulating factors. Fat, fat-soluble vitamins and
other nutrients are also stored in the liver (Stryer, 1988).
Liver Anatomy, Structure and Pathology
The basic structure of the rat liver consists of median, left, right and caudate lobes (2
divisions each for the later two) containing hepatic (hepatocytes or parenchymal) cells
surrounded by sinusoids (spaces) that are perforated by blood capillaries. The sinusoid
walls contain Kupffer cells which phagocytize (engulf) and destroy solid particles, dead
blood cells and other material. The main blood supply to the liver comes from the
intestinal vascular system. In the liver, blood vessels from the spleen and stomach merge
with the intestinal vascular system to form the portal vein which subdivides and drains
The nature of the injury experienced by the liver depends on the toxic agent, the severity
of the exposure, type of exposure and whether an acute or chronic toxic response is
observed (Hodgson, 2004). For example, acetaminophen, a widely used analgesic that is
safe at therapeutic dose levels, can cause acute centrilobular necrosis of the liver at toxic
levels. Acetaminophen-induced necrosis maybe localized affecting only a few
hepatocytes or may involve an entire lobe. Necrosis, in general, is a degenerative
process that leads to cell death of the tissue. Biochemical events that lead to necrosis
include binding of reactive metabolites to proteins or unsaturated lipids, disturbance of
calcium ion homeostasis (sustained equilibrium of biological systems in the cell) or shifts
in sodium and potassium ion balance, and interference with metabolic pathways and
inhibition of protein synthesis. Other types of hepatic injury are fatty liver (accumulation
of fat in hepatocytes), apoptosis (programmed cell death) distinguishable from necrosis
by morphological criteria, cholestasis (suppression or blockage of bile flow), cirrhosis
(deposition of collagen) throughout the liver which restricts blood flow and interferes
with metabolism and detoxification processes, hepatitis (inflammation of the liver) which
is usually not observed in animal models but manifested in susceptible humans,
carcinogenesis (cancer and tumors) and oxidative stress which is caused by reactive
oxygen species interaction with cellular macromolecules leading to liver cell damage and
death.
Mechanisms of Hepatotoxicity
Mechanisms of hepatotoxicity involve a series of events whereby a chemical or
toxicant is either detoxified by the liver or causes molecular changes and\or alterations in
biochemical processes in the liver cells. The cells either recover or the mechanistic
changes are irreversible. Finally, these non-recoverable alterations in the biochemical
and biological processes of the liver cells may culminate in necrosis and cell death.
Hepatocellular injury can be initiated by inhibition of liver enzymes, depletion of
cofactors or metabolites, depletion of energy stores in hepatocytes, interaction with
binding receptors or alteration of cell membranes involved with diffusion of chemicals
across barriers. The role of biotransformation, to convert chemicals to reactive
metabolites, has been given much attention as a source of initiation of cellular toxicity.
Reactive metabolites, such as free radicals, can bind covalently to DNA, RNA, proteins,
cofactors, lipids and polysaccharides, altering their biological properties and
characteristics. For example, phenobarbital increases liver toxicity by inducing
cytochrome P450 enzyme activation of reactive metabolites whereas inhibitors of
cytochrome P450 enzyme activity generally decrease toxicity.
Microarray Gene Expression Analysis
Microarray Platforms
The advent of toxicogenomics proclaimed the bridging of conventional toxicology and
evaluation with modern day genomics, including microarray-based gene expression
analysis (Afshari et al., 1999; Nuwaysir et al., 1999). The development of
revolutionized monitoring of gene expression analysis. Rather than assaying the
expression of genes one at a time, microarray analysis provides the ability to survey
genome-wide expression of genes simultaneously. Since its inception, three major
platforms for microarray analysis have matured (Heller, 2002). The cDNA array
technology (Schena et al., 1995) utilizes double-stranded cDNA representatives of
transcribed genes generated from a cDNA library, spotted with a robotic, contact pin
arrayer onto a typical 75 x 25 x 1mm glass microscope slide in subarray patterns to
maximize the density of the cDNA features on the glass substrate. A similar microarray
platform which is spotted on a glass slide but differs in the probe features arrayed on the
slide, is the long-oligonucleotide (oligo) microarray. Oligo arrays are manufactured by
synthesis of single-stranded oligonucleotide sequences from particular coding regions of
expressed genes and deposited onto a glass substrate either by ink-jet fabrication or in
situ synthesis (Okamoto et al., 2000; Hughes et al., 2001; Lockhart et al., 1996; Pease et
al., 1994). The oligo spotted arrays are thought to be better than cDNA arrays for the
homogeneity of the feature spots, detection of splice variants and efficient production of
consistent quality microarrays. Interrogation of the features on the cDNA and oligo
arrays is by competitive hybridization of fluorescently labeled, or biotinylated, cDNA
generated from messenger RNA obtained from two or more biological samples for
comparison to the probes on the array. Typically in a two-color array setup, one sample
is labeled with a Cy3 dye and the other with a Cy5 dye. The two samples are hybridized
competitively to the array and excited by a scanning laser at 570nm and 670nm
wavelengths respectively. Fluorescence emission occurs and is capture, digitized and
two images superimposed upon one another visually represents a gene as red if
over-expressed in one samples as opposed to the other, green if under-over-expressed, yellow if
equally expressed, and degrees of color between depending on the level of differential
expression. Data from the pixel images are acquired using image analysis software and
ratio values from background subtracted pixel intensity measurements of the features
from each scanning channel, are derived to represent relative fold change of gene
expression between the two samples (Chen et al., 1997). Commercialization of a
photolithographic process for producing high-density microarrays provides the third type
of array platform that is commonly used for gene expression analysis (Lockhart et al.,
1996; Pease et al., 1994). Rather than the oligo being spotted on a glass slide, Affymetrix
GeneChipTM arrays are generated by synthesizing 25 mer perfect oligos corresponding to
gene regions directly on silicon wafers. A corresponding mismatch oligo sequence, with
a one base change at the 13th position (middle of the oligo), is introduced and synthesized
on the array directly beside the perfect match to serve as a control for non-specific
hybridization. Several (between 9 and 16) perfect match and mismatch probe pairs
representing different coding regions of a gene, are synthesized through out the array at
random locations to minimize spatial effects, increase coverage of expression from
regions of the gene and also to allow for averaging across replicate gene reporters. The
GeneChipsTM are also hybridized by fluorescently-labeled or biotinylated cDNAs, but
from a single sample. In other words, the in situ synthesized Affymetrix microarrays are
single color hybridizations to individual DNA chips (Fodor et al. 1993). The pixel
intensities acquired from two separate hybridizations and image analyses are then
Experimental Designs for Microarray Analysis
Since the advent and early utilization of microarray analysis, the experimental designs for
comparison of biological samples have become more sophisticated and creative as
scientific questions and studies have become more complicated. The goal of setting up
an experimental design for a microarray experiment is to maximize opportunities for
gleaning technical or biologically meaningful information from the samples interrogated
on the array platform. Fundamentally, a good experimental design should make the
analysis of data and the interpretation of results simplistic yet powerful, given the
purpose of the experiment and the constraints of the experimental material (Yang and
Speed, 2002). Designing a microarray experiment has been decomposed into three
distinct parts (Churchill, 2002): 1) replication of biological samples to draw valid and
significant inferences from the data, 2) technical replication to increase the reliability and
precision of parallel experiments, 3) selection, randomization and replication of features
on the array platform to provide quality control and robustness to the experiment.
The reference experimental design for a microarray experiment uses a reference RNA or
a biological control as a common sample hybridized to each array in a competitive
fashion with the test sample of interest. Hamadeh et al. (2002a) performed a reference
design microarray experiment by comparing samples collected from rat liver specimens
exposed to chemical agents to a pooled control sample comprised of RNA from a group
relative to the abundance of mRNA hybridized to a feature on the same array as the
reference/control sample (Simon and Dobbin, 2003). The disadvantage of such a
reference design is that it is an inefficient experimental setup since half of the data
collected is generated from the extraneous, of-no-interest reference/control sample.
The balanced block experimental design has been proposed as a superior alternative to
the reference design since it is devoid of a reference sample and doubles the amount of
information collected from the test samples which are of biological interest to the
experimenter (Kerr and Churchill, 2001). For instance, a comparison of breast cancer 1
(BRCA1) mutated tumor samples to BRCA1 non-mutated breast tumors, whereby equal
replications of tumor samples are available, is possible on an individual array provided
that the investigator is not interested in drawing inferences from other cross comparisons.
The balanced block design has gained popularity for analyzing microarray data since one
of the many analysis of variance (ANOVA) models can be used for statistical analysis.
The loop experimental design for microarray comparisons features the linking of samples
competitively hybridized on arrays in a loop pattern such that all pairs of samples are
contrasted (Simon and Dobbin, 2003). Using the same number of arrays as the reference
experimental design, the loop design collects twice as much data on the treatments of
interest. More complex experimental loop designs can be devised for microarray analysis
via series of pairwise direct comparisons among samples arranged in a set of connected
loops (Churchill, 2002). However, drawbacks to loop designs for microarray analysis are
to indirect contrasts and cluster analysis of the data tends to be inferior compared to the
clustering of the data collected from reference design experiments since the variance
accumulates as the distance between nodes in the loop increases for a given contrast.
Same vs. same and reverse dye labeling of samples are experimental designs that permit
controlling for gene variability and dye bias in the microarray analysis, respectively. In
the case of the same vs. same experimental design, repeated array analyses of a single
sample labeled with both dyes and competitively hybridized to the same array are
performed to construct a gene specific error model that captures the amount of variability
at the gene level for a given array platform and data acquisition method. Such error
models have been shown to be effective for guarding against differentially expressed
genes detected as false-positives particularly at the low intensity end of the array
scanning dynamic range where the variance of the measurements tends to be higher
(Hughes et al., 2000). On the other hand, reversing the labeling dyes used for two
different samples to be compared on an array captures dye effects as a source of
variability in statistical analyses (Wolfinger et al., 2001).
The series experimental design approach is similar to the reference design in that a
measurement point dose or time is treated as the reference and every other measurement
is compared with the reference point. Experimental design choices for microarray series
experiments such as time-course and dose-response regimens can be of several types
previously described (Yang and Speed, 2002). The design options depend on the
or untreated sample is used as the common reference for comparison to all test samples or
used as the lead contrast sample for sequential comparisons between consecutive
treatment points. A basic loop experimental design might be more appropriate if
comparisons between consecutive treatment points are more interesting than those that
are several intervals apart.
Preprocessing Microarray Data
Once the microarray experiment has been setup and the analysis performed,
preprocessing of the pixel intensity data and ratio values is essential in order to account
for systematic error and stochastic variation in the data. Since many models and methods
for preprocessing and analysis of microarray data rely on an assumed distribution of the
data, taking either the log2 or log10 of the pixel intensity and ratio values generally
transforms the data to a more normal distribution (Quackenbush, 2002). The logarithms
of gene expression ratio values are symmetrical in that a gene up-regulated by a factor of
2 has a log2 ratio of 1.0, a gene down-regulated 2 fold has a log2 ratio of –1.0 and a gene
with an equal level of expression in two samples with a ratio of 1.0, has a log2 ratio equal
to 0.
Data generated from a microarray experiment are influenced by experimental error
attributed to variation in specific steps of the analysis and data acquisition processes
(Brown et al., 2004; Spruill et al., 2002). Sources of variation have been attributed to the
of the lab, the labeling process, gene dye biases, hybridization, scanning, and even the
data acquisition software, just to name a few (Novak et al., 2002; Draghici et al., 2001;
Wolfinger et al., 2001; Nadon and Shoemaker, 2002). This systematic error in the data is
unavoidable but can be eliminated or minimized using normalization procedures. A
general normalization is performed by computing an adjustment factor by summing the
measured pixel intensity values in both scanning channels and then dividing one by the
other. Then, one of the channels is scaled by the adjustment factor to bring the mean
ratio of the pixel intensity values equal to 1.0. Scaling individual pixel intensity values
so that the mean or median intensities are the same within a single array or across all
arrays, or using a core set of a large number of features which are not differentially
expressed in either sample, are variations on, or alternatives to, this type of general
normalization.
Locally weighted linear regression (Lowess) normalization has been proposed by Yang et
al. (2002) to account for spatial variation in pixel intensity due to subarray pin-tip
differences in the arraying process. Lowess uses a weight function that diminishes the
contribution of features having values far from the distribution of the data when plotted
on a ratio by intensity (R-I) plot, where the measured log2 ratio value for each feature is
viewed as a function of the log10 of the product of the intensities. The dependence of the
log2 ratio on the log10 intensity is used, on a gene-by-gene basis, to correct the ratio
values according to variation in intensity measurement. Chou et al. (2005) utilized a
systematic variation normalization (SVN) approach to adjust gene expression data such
systematic variation. The first step is background subtraction determined from the
distribution of pixel intensity values from each data acquisition channel and log
conversion which allows arithmetic operations on measured gene expression values. The
second step is linear or non-linear regression followed by a restoration or correction of
the distribution of control and test data to rescale intensities for a single array or across
multiple arrays.
Standardization of gene expression values across arrays or within an array is typically
performed by mean centering the data or transforming the values to Z-scores. Filtering
out gene features based on an intensity cutoff, pixel standard deviations, or modified
Z-score of replicate measurements, and also weighted averaging of gene expression
measurements across technical and biological replicates, are other preprocessing
approaches to account for systematic variability in microarray data (Bushel et al., 2002).
In the case of missing data, imputing the values with the sample group mean, median or
the average of the features from the k-nearest neighbors in n-dimensional space, are
common practices in data analysis (Troyanskaya et al., 2001; Jian and Dubes, 1988).
Selection of Differentially Expressed Genes
There are numerous classical methods to detect differentially expressed genes in a
microarray data set. These are more sophisticated than selecting genes with expression
values beyond a 2-fold standard deviation, and typically have either a common statistical
(1997) developed one of the first statistical methods for identifying differentially
expressed genes. The method uses the distribution of the pixel intensity ratio values to
compute fixed confidence intervals for all the gene features on the array. The ratio values
for each gene feature is normalized to either all the genes on the array or a set of control
genes which have expression values that are not altered in either sample being compared
on the microarray, in order to balance the two scanning channels to a ratio of
approximately 1.0. Genes with a normalized ratio intensity value outside the confidence
interval are considered differentially expressed. More recently, Chen et al (2002)
proposed an adaptive confidence interval approach for detecting differentially expressed
genes by constructing individual gene confidence intervals which are based on the level
of quality from the pixel intensity measurements. Hughes et al. (2000) presented an
approach to identify differently expressed genes similar to the ratio distribution
confidence interval method but based on an error-weighted model which captured
intensity dependent additive and multiplicative error from gene expression
measurements. Gene features with ratio values that are computed from pixel intensity
values that contribute to a high deviation in measurement, are less likely to be determined
as up or down regulated.
To capture and account for the multiple sources of variation in the pixel intensity values
from each scanning channel, analysis of variance (ANOVA) models were constructed to
analyze microarray data for differentially expressed genes. Kerr et al. (2000) proposed a
Latin-square design of experiments to ascertain confounding sources of variability and to
developed to assess statistical significance of genes detect as differentially expressed
(Wolfinger et al., 2001). The models are considered mixed since they contain fixed and
random variables terms. The microarray data is first fitted to a normalization model to
account for variability in the pixel intensity values from the dye scanning channels.
Then, residuals from the normalization model are carried into a gene model that assesses
the significance of gene expression difference between treatments or comparisons. Given
sufficient replication, mixed linear models permit genes features with a low probability of
being detected as differentially expressed by chance (type I error) and small fold
expression change, to be assessed as statistically significant. The spread of the
distribution of –log10p-values with the fold change of the genes is depicted by a Volcano
plot where any gene with a p-value above a level of significance are assessed as
differentially expressed. Empirical Bayesian methods for ascertaining statistical
inference on differential gene expression has also been explored (Newton et al., 2001).
Non-parametric approaches for analyzing gene expression data do not rely on any
distribution model but rather permutation computations to assess significance of
differential expression. For comparing gene expression between two samples, Callow et
al. (2000) utilized a t-statistic on the average difference between average log ratio values
and permutations of the t-statistics to compute an adjusted p-value for each gene’s test of
altered gene expression significance. Tusher et al. (2001) also used a t-statistic for
significance analysis of microarray (SAM) by assigning a score to each gene on the basis
of change in gene expression relative to the standard deviation of repeated measurements.
repeated measurements to estimate the percentage of genes identified by chance, the false
discovery rate (FDR). Draghici et al. (2001) describes an ANOVA model for microarray
gene expression data that uses estimated noise from replicate gene features spotted on the
same array to empirically obtain a zero mean error distribution with confidence levels
that indicate boundaries beyond which genes with expression values are truly
differentiated.
Pepe et al. (2003) and Yang et al. (2004) both introduced ranking methods for detecting
differentially expressed gene from microarray analysis. To identify significance of
altered expression, the former approach uses receiver operating (ROC) curves to
characterize separation between distributions of gene expression data and the latter
integrates differing statistics through a differential expression via distance synthesis
(DEDS) scheme to rank genes according to strength in the direction of an extreme origin
of differential expression.
Toxicogenomics
The State of Toxic Ignorance
Paraphrasing Dr. Kenneth Olden’s, the Director of NIEHS from 1991 to 2005, profound
and provocative statement at the NIEHS, Toxicogenomics Research Consortium meeting
at the University of North Carolina William and Ida Friday Center , December 6-8, 2004,
“we are living in a state of toxic ignorance”. Meaning, although a wealth of data has
ramifications from exposure to toxic, environmental and physical stressors, currently
little is known about the key biological mechanisms leading to idiosyncratic toxicity or
human genetic susceptibility to toxic agents.
Toxicogenomics offers a new paradigm to the study of toxicology (Inoue and Pennie,
2003). Rather than approaching toxicology from a traditional forward (inductive)
direction starting from the phenotype elicited from exposure to a toxicant and then to the
analysis for target genes involved in the mechanism of toxicity, a reverse toxicological
(deductive) approach is deemed more practical and suitable given the access to genomics
and informatics technologies, to start from a signature of genes and\or protein expression
which can be mapped back to the biological end-points observed to be perturbed
following toxic exposure. The supposition is that toxicogenomics, specifically reverse
toxicology, opens the door to toxicological investigation on a broader scale from at least
five aspects:
1) merging scientific disciplines such as pharmacology, toxicology, pathology,
molecular biology, biochemistry, genetics, statistics and bioinformatics
2) shifting from “analog science” to “digital science” with respect to leveraging
computerized data for experiments in silico
3) visualizing unknown idiosyncratic changes behind homeostasis
4) inter-species extrapolation
5) shifting more toward deductive toxicology to discern biomarkers of adverse
Clearly, the power of toxicogenomics lies in the integration of ‘omics' data generated
from toxicological experiments, the synergism of disparate computational tools and
methods for analyzing the data as well as the amalgamation of the multiple scientific
disciplines and expertise needed to manage the data and interpret the results from the
analysis of the integrated data. Being able to discern, on molecular and gene expression
levels, the difference between pharmacological responses and toxicological responses to
chemical agents or stressors, will undoubtedly assist in distinguishing the point of
departure from a physiological state of normality in a cell to one that is subtoxic, toxic or
lethal to cellular function and human health.
Presently, there are two major problems in toxicology research, drug discovery and
environmental health risk assessment: 1) the paucity of mechanistic data to explain toxic
responses and 2) the lack of knowledge of intrinsic toxicity for the large number of
compounds introduced into the environment or exposed as pharmaceuticals. The
quandary is that in the past, simple models and reductionists approaches to understand the
development of a complex phenotype characteristic of a toxic response, have been
utilized to assess human risk to chemical exposures, xenobiotics and environmental
pressures (Hamadeh and Afshari, 2004). Subsequently, current understanding and
knowledge of toxicity remains grossly descriptive and the molecular mechanisms elusive.
Here in lies the current state of toxic ignorance. Fortunately, toxicogenomics promises to
new light on the mechanisms involved in incipient toxicity. New methods of data
analysis are needed if this endeavor is to be successful.
Nuwaysir et al. (1999) first introduced the concept of toxicogenomics and how
state-of-the-art microarray technology can be used to identify gene expression signature
associated with chemical exposure and toxic responses. However, a prototype of
toxicogenomics to investigate the inflammatory response to several agents and to identify
toxicological phenotypes on a smaller genomic scale, was underway by Heller et al.
(1997). Since then, and up to now, a couple of hundred review articles and research
papers on toxicogenomics have been published. Most, if not all, the manuscripts address,
in some fashion, toxicogenomics approaches for either toxic mechanism characterization,
biomarker identification, chemical classification and ascertainment of compound
signatures, anchoring of gene expression to phenotypes, end-points or pathophysiology of
a toxic exposure, risk assessment of chemical agents and environmental exposures and\or
a better understanding of the point-of-departure or bracketed maximum tolerated dose of
a toxicant for risk assessment, and to fully grasp the molecular dynamics and biology of
the dose response.
Chemical Classification and Compound Signatures
One of the initial challenges and proof-of-concepts for applying toxicogenomics to the
genomic-wide study of toxicology, was to classify compounds based on the gene
(2001) were one of the first to use transcript profiling to determine different classes of
compounds. The goal was to distinguish between two mechanistically un-related classes
of toxicants (cytotoxic anti-inflammatory drugs and DNA-damaging agents) based solely
on the correlation of approximately 250 gene expression profiles in HepG2 human
hepatoma cultured cells. The discrimination of the 100 compounds was not possible
given the large number of gene profiles and the limited replication in the data set.
However, when technical and biological replications were introduced into the
experimental design, a more definitive set of discriminators were obtained to distinguish
between cisplatin and a pair of non-steroidal anti-inflammatory drugs (NSAIDs). In
addition, this more focused finger-print of the compounds was ultimately useful for
discriminating between the database of 100 cytotoxic anti-inflammatory drugs and
DNA-damaging agents.
A more extensive investigation, albeit less sophisticated data analysis, to discern
compound class signatures using gene expression was performed by Bartosiewicz et al.
(2001). Gene expression patterns, assessed as significantly differentially expressed based
on a 2-fold criteria, of 5 classes of compounds exposed to liver and kidney tissues were
distinct from one another. The liver transcript response from the agents in the kidney
were, in most cases, less than the response in the liver, primarily due to the fact that some
of the toxicants have a greater toxicity in the liver, the toxicants reach a higher
concentration in the liver because of the intraperitoneal route of administration or the
Hamadeh et al. (2002a) leveraged a series of analytical approaches to subjectively
tease-out gene expression profiles from the livers of male Sprague-Dawley rats that were
specific for distinguishing phenobarbital, an enzyme inducer, from the peroxisome
proliferator agents clofibrate, gemfibrozil, and Wyeth 14,643. In addition, Hamadeh et
al. (2002b) used these distinctive gene expression patterns to predict, with a high degree
of success, the likeness of blinded compounds to either a compound in the database or
not. A more streamlined, less subjective computational approach to classifying the
phenobarbital and peroxisome proliferator compounds into classes and subclasses based
on the gene expression data was done by quality assessment of the data, hierarchical
cluster analysis, a one-way ANOVA or linear discriminant analysis, and mixed linear
models approach (Bushel et al., 2002). Based on the gene expression profiles, the
phenobarbital samples were distinguishable from the peroxisome proliferator and the
fibrates (clofibrate and gemfibrozil) were found to be distinct from the Wyeth compound.
A true test of using toxicogenomics to classify compounds, and probably the validation of
the proof-of-concept, was recently done by Steiner et al. (2004) using support vector
machines (SVMs, a supervised learning approach) to discriminate different classes of
toxicants based on transcript profiling. In the study, the SVMs derived classification
rules and potential biomarkers which could discriminate between hepatotoxic and
non-hepatotoxic compounds. Furthermore, the correct class of non-hepatotoxicant was predicted in
most cases. The investigation also demonstrated that predictive models built on transcript
also able to identify non-responders to the toxic agents, and are able to discriminate
between gene changes related to pharmacology and toxicity.
Phenotypic Anchoring of Gene Expression
Although chemical classification based on microarray data and derivation of gene
expression signature patterns for compounds have been successful, utilization of
toxicogenomics to tie transcription patterns to phenotypes and end-points observed
following toxic exposure, would be a more fruitful contribution to understanding the
biological mechanisms involved in toxic responses. Hamadeh et al. (2002c) embarked
upon phenotypic anchoring of microarray gene expression data to pathologic
observations observed in male Sprague-Dawley rats livers exposed to methapyrilene.
Although gene expression patterns were identified that classified the biological samples
in accordance with microscopic lesions in the liver, alterations in transcription were
detected for a number of genes at low-dose exposure levels that were not observed by
gross histopathology. Histopathological alterations such as hepatocellular necrosis, bile
duct hyperplasia, and other abnormalities were corroborated by gene expression changes
monitored by microarray analysis.
Gene expression profiles derived from cells give a good indication of the state of the
organ and the tissue that the cells were derived from. This phenotype can be defined by
several means including clinical readings, functional tests, clinical chemistry evaluations
expression to these alterations is key to finding hallmark biomarkers of adverse effects
and for derivation of testable hypotheses regarding mechanism(s) of action. Two studies
demonstrated the feasibility of phenotypic anchoring of gene expression to lesions
elicited by nephrotoxicants. In Huang et al. (2001), microarray analysis was used to
associate gene expression with cisplatin-mediated toxicity in male Sprague-Dawley rat
kidney samples. The gene expression pattern elicited suggested the occurrence of
apoptosis and the perturbation of intracellular calcium homeostasis. In addition, the
induction of multidrug resistance genes and tissue remodeling proteins suggested
development of cellular resistance to the drug as well as tissue regeneration. In Luhe et
al. (2003), marked transcriptional changes in genes involved in DNA damage response
and apoptosis, as well as oxidative stress and inflammation reactions, were detected
following exposure of male Wistar rat kidneys to a mycotoxin contaminant found in
cereals. Another toxicogenomics investigation (Amin et al., 2004) identified putative
gene-based markers from gene expression profiles that correlated with renal toxicity
causes and effects that were induced by one of three different nephrotoxicants (cisplatin,
gentamicin, and puromycin).
An expectation of toxicogenomics is that gene expression data suffice as a “digital
pathology” representation of the phenotype of toxicity for a given toxicant. A working
hypothesis is to define signature patterns of altered gene expression that indicate specific
adverse effects of chemicals, drugs, environmental pressure or physical stressors (Paules,
2003). In this vein, gene expression analysis of rat liver samples exposed to