DOI: 10.1534/genetics.103.021535
Maximum-Likelihood Estimation of Rates of Recombination
Within Mating-Type Regions
Naoki Takebayashi,*
,1Ed Newbigin
†and Marcy K. Uyenoyama*
,2*Department of Biology, Duke University, Durham, North Carolina 27708-0338 and
†School of Botany, University of Melbourne, Victoria 3010, Australia
Manuscript received August 21, 2003 Accepted for publication April 30, 2004
ABSTRACT
Features common to many mating-type regions include recombination suppression over large genomic tracts and cosegregation of genes of various functions, not necessarily related to reproduction. Model systems for homomorphic self-incompatibility (SI) in flowering plants share these characteristics. We introduce a method for the exact computation of the joint probability of numbers of neutral mutations segregating at the determinant of mating type and at a linked marker locus. The underlying Markov model incorporates strong balancing selection into a two-locus coalescent. We apply the method to obtain a maximum-likelihood estimate of the rate of recombination between a marker locus,48A, andS-RNase, the determinant of SI specificity in pistils ofNicotiana alata. Even though the sampled haplotypes show complete allelic linkage disequilibrium and recombinants have never been detected, a highly significant deficiency of synonymous substitutions at48Acompared toS-RNasesuggests a history of recombination. Our maximum-likelihood estimate indicates a rate of recombination of perhaps 3 orders of magnitude greater than the rate of synonymous mutation. This approach may facilitate the construction of genetic maps of regions tightly linked to targets of strong balancing selection.
I
N many organisms, reproduction occurs only be- coccus neoformansand Ustilago hordei). In C. reinhardtii, recombination suppression over a 1-Mb tract surround-tween individuals or gametes that express differentsexes or mating types. Many such systems show high ing the mating-type locus appears to derive from multiple inversions and translocations within the central 200-kb structural and sequence diversity among distinct mating
types and greatly reduced recombination across exten- domain (R) in which mating-type-specific genes reside
(Ferris et al. 2002). Not all genes embedded in this
sive genomic tracts surrounding the determinants of
mating type (Ferris et al. 1997; Hiscock and Ku¨ es region contribute directly to reproduction: many per-form general (“housekeeping”) functions or show maxi-1999). Suppression of crossing-over between the human
X and Y chromosomes appears to have occurred in mal expression in vegetative stages of the life cycle
(Ferriset al.2002). In the smut fungusU. hordei,
exten-a stepwise fexten-ashion, through exten-a series of chromosomexten-al
rearrangements, with the nonrecombining euchromatic sive rearrangements across a 500-kb region containing region of the Y now comprising some 23 Mb (Lahnand the determinants of mating type (transcription factors,
Page1999; Iwase et al. 2003; Skaletskyet al. 2003). pheromones, and pheromone receptors) appear to in-The majority of functional protein-coding genes in the hibit recombination between mating types (Lee et al.
male-specific (non-pseudoautosomal) region show tes- 1999). In the self-fertileNeurospora tetrasperma, the chro-tis-specific expression, occur in palindromes, and have mosomal segment in which the highly rearranged alter-their most closely related homologs dispersed through- native mating-type alleles lie fails to pair during meiosis out the genome (Rozen et al. 2003; Skaletsky et al. (Gallegoset al.2000). In the human pathogenC.
neo-2003). Most of the remaining protein-coding genes formans, alternative mating-type alleles also show exten-show ubiquitous expression, perform various metabolic sive rearrangements, with the region of reduced recom-functions, and have X-linked homologs (Skaletskyet bination spanning⬎100 kb (Lengeleret al.2002). As
al.2003). in Chlamydomonas, this region contains many genes
Two mating types exist in the unicellular green alga that perform a variety of primary functions, not
re-Chlamydomonas reinhardtiiand in some fungi, both asco- stricted to reproduction (Lengeleret al.2002).
mycete (Neurospora species) and basiodiomycete (Crypto- Homomorphic self-incompatibility (SI) in flowering plants prevents fertilization by pollen that express mat-ing specificities in common with the pistil. In the best-1Present address:Department of Biology and Wildlife, University of
known model systems, a single, large nonrecombining
Alaska, Fairbanks, AK 99775.
region (S-locus) encodes both pistil and pollen mating 2Corresponding author:Department of Biology, Box 90338, Duke
Uni-versity, Durham, NC 27708-0338. E-mail: [email protected] specificity. Genetic analysis ofS-locus regions may afford
insight into many issues of general relevance to sexual population-wide bottlenecks (Barton1998;Galtieret al.2000).
reproduction, including the genetic and evolutionary
mechanisms that permit genes to maintain function in Our objective is the obverse: we seek to use the relative magnitudes of neutral diversity at markers tightly linked the face of recombination suppression and enforced
heterozygosity. to the mating-type locus to infer their relative order.
Other approaches for the detection of recombination
Brassica oleraceaand its relatives represent the model
system for sporophytic self-incompatibility (SSI), in recognize incongruence among gene genealogies as
prima facie evidence of recombination (see Crandall
which the specificity expressed by an individual pollen
grain is determined not by its ownS-locus genotype but andTempleton1999;Wiufet al.2001).
Takebayashi et al. (2003) analyzed the pattern of
by the genotype of the plant that produced it. The
S-locus region comprises several open reading frames variation at 48A, a pollen-expressed, protein-encoding gene tightly linked toS-RNaseinNicotiana alata. Screens bearing sequence similarity to genes of known function,
some with no apparent relationship to SI or reproduc- of hundreds of plants have yielded no recombinants (Li
et al. 2000) and 48A exhibits complete allelic linkage
tion (Suzukiet al.1999;Casselmanet al.2000).S-alleles
segregating within Brassica populations differ greatly disequilibrium withS-RNase(Brewer1998). However, the great deficiency in the number of segregating neu-with respect to the physical distance between the
deter-minants of pollen and pistil specificity and to the orien- tral mutations at48Arelative toS-RNasedeparts highly significantly from expectation under the hypothesis of tation of those genes relative to one another and to
other genes embedded in the region (Nasrallah2000). complete linkage (Takebayashiet al.2003).
Here, we present a method for the maximum-likeli-In gametophytic SI (GSI) systems, the S-locus
geno-type of each pollen grain or tube determines its own hood (ML) estimation of the rate of recombination between a marker locus and a target of strong balancing specificity. In many species of the Solanaceae, a
func-tional ribonuclease (S-RNase), expressed in pistil, exhib- selection. It explicitly incorporates symmetric, multi-allelic balancing selection into a two-locus coalescent. its highly specific inhibition of pollen tubes that express
incompatible specificities (Leeet al.1994;Murfettet al. We base our ML estimate of the recombination rate on computed (rather than simulated) probabilities of 1994). Homologs of theS-RNasegene appear to mediate
GSI in the distantly related plant families Rosaceae and arbitrary numbers of neutral mutations observed segre-gating in a sample of haplotypes comprising two loci: Scrophulariaceae as well (IgicandKohn2001;
Stein-bachsandHolsinger2002). While the BrassicaS-locus one showing absolute linkage and the other partial
link-age to the target of selection. Our method assumes the spans some hundreds of kilobases (Boyeset al.1997),
the domain of reduced recombination surrounding absence of intragenic recombination and that neutral mutations arise at each locus at identical per-site rates
S-RNase comprises at least 1 Mb (McCubbin andKao
1999) and likely ⬎4 Mb (Wang et al. 2003). To date, or at known relative per-locus rates. Application to the
S-RNase-based system of GSI indicates a rate of recombi-dozens of open reading frames have been identified for
which linkage to S-RNase appears to be virtually com- nation betweenS-RNaseand48Aof perhaps 3 orders of magnitude greater than the rate of synonymous muta-plete (Li et al. 2000;McCubbin et al. 2000; Laiet al.
2002; Entaniet al. 2003;Ushijima et al. 2003). If the tion. Estimation of very low recombination rates, practi-cably undetectable by direct observation, may facilitate
S-locus region ofS-RNase-based GSI shares with Brassica
the feature of high gene density (one per 5.4 kb;Suzuki construction of genetic maps within mating-type re-gions. It also applies to other systems of symmetric
bal-et al.1999), a considerable number of expressed genes
may cosegregate withS-RNase. ancing selection, perhaps including the vertebrate ma-jor histocompatibility complex region.
The advent of genomic sequence information has raised the prospect of using the pattern of variability across sites of known location to identify candidate
tar-BALANCING SELECTION gets of selection (e.g.,Nordborg 1997;Kimand
Ste-phan2002). While neutral substitution at a given site Ancestral selection graphs provide a means of incor-porating selection into genealogical reconstruction proceeds at the rate of neutral mutation, independent
of linkage to targets of selection (Birky and Walsh (KroneandNeuhauser1997;NeuhauserandKrone
1997). Neuhauser (1999) represented GSI as the 1988), selection can truncate or expand the time since
the most recent common ancestor (MRCA) at the target strong-selection (lethal homozygosis) limit of symmetric overdominance, but concluded that the ancestral selec-and regions tightly linked to it (Hudson andKaplan
1988; Kaplan et al. 1989; Takahata 1990; Charles- tion graph approach cannot be applied to this system because the diffusive limit on which it relies does not
worthet al.1993). Implementation of this method of
recognizing candidate targets requires an understand- exist under selection pressures of this intensity. To ac-commodate GSI, we adopt a model that includes both ing of the joint effects of multiple kinds of selection
operating at nearby sites (KimandStephan2000;Kelly slow diffusion and instantaneous jumps.
Overdominance in viability: Under symmetric
dominance (SOD), individuals that bear any specificity to haplotypes under linkage sufficiently tight to justify ignoring recombination during jumps (contrastKaplan
in homozygous form survive to reproduction at rate
(1⫺s) relative to heterozygotes. Coefficients describing et al.1989 withWieheandStephan1993). Under these the drift (mean change) in frequency of a given specific- assumptions, jumps can induce multifurcating nodes in ity (x) and the diffusion (variation around the mean the gene genealogy, reflecting the simultaneous coales-change) generated by stochastic forces correspond to cence of multiple haplotypes expressing the same speci-ficity into the single ancestral haplotype in which the specificity-determining mutation first arose.
s(x)⫽
sx(F⫺x)
1⫺ sF ⫺ ux (1a) Invasion of new specificities: Upon its introduction
into the population in very low frequency, a new speci-2
s(x)⫽
x(1⫺x)
2N (1b) ficity wanders in a “boundary layer” (Gillespie1983),
primarily under the influence of drift, until it either (see, for example,Takahata1990), foru, the rate of declines to extinction or rises to sufficiently high fre-mutation to alleles not presently segregating in common quency to permit selection to dominate the evolutionary frequencies, and F, the homozygosity (inverse of the process. In the latter case, strong selection then medi-effective number of alleles;Kimuraand Crow1964). ates a jump to common frequency (1/n). Let repre-Under strong SOD, common alleles segregate in fre- sent the rate at which new specificities rise to common quencies near the deterministic expectation of 1/n, for frequencies. Under SOD (1),corresponds to
nthe number of common alleles maintained at
approxi-mate steady state; in this case,Fcorresponds closely to 4NsuF
1⫺sF (3)
1/n. Forsanduof order 1/2N, the coefficients in (1) describe a valid diffusion process. Under lethal
homozy-(Sasaki1989, 1992), and under GSI (2),
gosis (s →1), the change due to selection (1a) becomes
infinite in the diffusion limit (N→∞). 4NuF
(1 ⫺F)(1⫺2F) (4)
Gametophytic self-incompatibility: GSI differs from
the strong-selection limit (s → 1) of SOD. Wright’s
(Uyenoyama2003).
(1939) diffusion approximation for GSI has endured
Approximate stationarity of the number of common various criticisms (e.g., Fisher 1930; Moran 1962;
alleles (n) entails a balance between invasion of new
Ewens1964;Mayo1966), but nevertheless appears to
alleles and extinction of common alleles. This invasion/ provide a remarkably accurate description of GSI
evolu-tion (YokoyamaandNei1979;VekemansandSlatkin extinction process sets the timescale of coalescence 1994). After a succession of modifications, the canonical among allelic classes (Takahata1990). Because balanc-drift and diffusion coefficients for GSI have become ing selection promotes the increase of any rare allele, allelic lineages persist in the population for longer inter-vals than expected under neutrality.Takahata(1990) (x)⫽ x(F⫺x)
(1 ⫺F)(1⫺2F)⫺ux (2a) compared the process of coalescence of symmetrically overdominant alleles in a population of size 2Nto that 2(x)⫽x(1 ⫺2x)
2N , (2b) among neutral alleles in a population of size 2Nf, forf,
a scaling factor that represents the expansion of the foru(ⵑO(1/2N)), the rate of mutation to newS-alleles timescale of the allelic genealogy caused by balancing
(Wright1969, pp. 405–406). The difference between selection. Coalescence amongjneutral lineages occurs
the diffusion coefficients for SOD (1b) and GSI (2b) at rate reflects that GSI interactions between diploid zygotes
(pistils) and haploid gametes (pollen) cannot be re-
冢
j2
冣
冒
2Nf (5)duced to interactions among gametes alone, as is the case for SOD. Even so, GSI shares with strong SOD (s⬎
O(1/2N)) the property that in the diffusion limit (N→ and amongjoverdominant lineages at rate
∞), the mean change of the focal allele (2a) remains
finite in only two frequency domains: very close to zero
冤
(1⫺ 1/n)冢
j 2冣冥
冒
冢
n
2
冣
. (6)(x ⵑ O(1/2N)) and very close to the deterministic equilibrium ((F⫺x)ⵑO(1/2N)).
The latter expression reflects the invasion of a new speci-Our model of GSI evolution adopts (2) within these
ficity (), without the extinction of its immediate parent two domains, together with jumps of the process
be-specificity (1 ⫺ 1/n), and also the inclusion in the tween them (see Sasaki 1989, 1992; Gillespie 1983,
sample of descendants of both the offspring and parent 1994). A jump corresponds to the rise of an allele to
lineages (seeHey1992;Takahataet al.1992). Equating common frequencies that is virtually instantaneous
兺
i,j,kni,j,k(i⫹ k)⫽lA兺
i,j,k
ni,j,k(j⫹ k)⫽lB
兺
i,j,k
ni,j,k⫽n. (8)
The state of the process corresponds to the configu-ration of lineages within alleles. We represent the state within level (lA,lB) bySlA,lB⫽(n0,0,0,n0,0,1, . . . ,ni,j,k, . . . ),
for alli,j, and k. Transition matrixPlA,lBdescribes rates of transition of the process between states within level (lA,lB) andQlA,lBdescribes rates of transition from level (lA,lB) to lower levels (fewer lineages);UlA,lBandVlA,lBgive conditional transition rates, given that a transition has occurred,
Figure1.—Joint levels of concurrent marginal genealogies.
UlA,lB⫽ClA,lB ⫺1P
lA,lB (9a)
VlA,lB⫽ClA,lB ⫺1Q
lA,lB, (9b)
f⫽ n
2
4N, (7)
for ClA,lB a diagonal matrix, with the mth diagonal ele-forgiven by (3) for SOD and by (4) for GSI. ment (C
lA,lB(m)) corresponding to the total rate of
transi-tion from statemto any other state.
Recursive derivation: For state m on level (lA, lB), the
TWO-LOCUS LIKELIHOODS
probability that a transition in state has occurred more We describe a method for determining the probability
recently than a mutational event in any of the lineages is of any pattern of neutral segregating mutations
ob-served in a sample of haplotypes. Each haplotype
com-plA,lB(m)⫽
ClA,lB(m) ClA,lB(m)⫹lAvA⫹lBvB
. prises two loci: Ashows absolute linkage andBpartial
linkage to the specificity-determining region. We
as-The joint probability-generating function (pgf) of the sume no intragenic recombination and anr-cM
separa-number of new mutations accumulated in any of the tion between AandB. Neutral mutations arise within
lineages since the most recent transition in state
corre-AandBaccording to the infinite-sites model at the
per-sponds to locus, per-generation ratesvAandvB, respectively. The
population comprises N diploid individuals, among
flA,lB(a,b)(m)⫽
兺
∞
x⫽0
兺
∞
y⫽0
[1⫺plA,lB(m)]
(x⫹y)p
lA,lB
冢
x⫹y
x
冣
whichndistinct common mating specificities segregate in equal frequencies.
We first summarize the derivation of
probability-gen-⫻
冤
lAvAa lAvA⫹lBvB冥
x
冤
lBvBb lAvA⫹lBvB冥
y
erating functions of numbers of segregating sites and the recursive computation of likelihoods. We then
de-scribe the Markov transition matrices specific to the ⫽ ClA,lB(m)
ClA,lB(m)⫹lAvA(1⫺a)⫹lBvB(1⫺b)
.(10) evolutionary process under consideration.
Probability-generating functions: Transitions in state:
This expression reflects that the distribution of the total As an alternative to the analysis of full ancestral
recombi-number of mutational events since the most recent tran-nation graphs (Griffiths1991;Griffithsand
Marjo-sition is geometric with parameterplA,lB(m), and the num-ram1996), we study correlations between the marginal
ber of mutations in A (or B) lineages given the total genealogies using joint probability distributions. We
number is binomial. represent the ancestry of the sample as two distinct but
Within a sample of any given configurationSlA,lB, the concurrent genealogies: level (lA,lB) corresponds to the
segregating mutations arose either before or after the segment of the concurrent genealogies in whichlAlocus
most recent transition. Because the numbers of
muta-Alineages andlBlocus Blineages remain (Figure 1).
tions in these disjunct periods are independent, the pgf A type 0 haplotype bears an ancestral lineage at
nei-for the total number of segregating sites corresponds ther locus, type 1 only atA, type 2 only atB, and type
to the product of the pgfs for the two periods: 3 at bothAandB(compareKaplanandHudson1985;
Griffiths 1991). At any point in the genealogy, ni,j,k gl
A,lB(a,b)⫽FlA,lB(a,b)[UlA,lBglA,lB(a,b)⫹VlA,lBhlA,lB(a,b)] (11a) of the n common specificity classes in the population
⫽[I⫺FlA,lB(a,b)UlA,lB]
⫺1F
lA,lB(a,b)VlA,lBhlA,lB(a,b), containitype 1,jtype 2, andktype 3 haplotypes (0ⱕ
in whichglA,lB(a,b)represents the vector of pgfs for
sam-ple configurations on level (lA,lB),hlA,lB(a, b)is the vector
of pgfs on lower levels, andFlA,lB(a,b)is a diagonal matrix with the mth diagonal element given by flA,lB(a,b)(m)
(10). Equivalently,
glA,lB(a,b)⫽DlA,lB(a,b)[PlA,lBglA,lB(a,b)⫹QlA,lBhlA,lB(a,b)] (12a)
⫽[I⫺DlA,lB(a,b)PlA,lB]
⫺1D
lA,lB(a,b)QlA,lBhlA,lB(a,b), (12b) for DlA,lB(a,b), a diagonal matrix of the denominators
of FlA,lB(a,b). For states (1, 2) or (2, 1) (two lineages
Figure2.—Mechanisms of transitions in state. Genetic drift remaining in one marginal genealogy), the only lower may effect the coalescence of a pair of lineages; recombination level (1, 1) corresponds to the joint MRCA of the sam- may effect the transfer of one locusBlineage between specific-ity classes; and turnover of specificspecific-ity classes may effect the ple. Because any mutations in this state do not
contrib-simultaneous coalescence of multiple lineages into the single ute to the number of segregating sites,
ancestor in which the new specificity arose. h1,2(a,b)⫽ h2,1(a,b)⫽ 1. (13)
Beginning at this lowest level, the pgfs for samples of state, each of the n common classes comprises 2N/n arbitrary sizes and configurations may be obtained re- haplotypes, any pair of which may coalesce through
cursively from (11) or (12). genetic drift. Within any of then
i,j,kspecificity classes of
Determination of the joint probability distribution of type (i,j,k) (containingitype 1,jtype 2, andktype 3 segregating sites requires only the derivatives of the pgfs haplotypes), coalescence between two type 1 haplotypes rather than the pgfs themselves. We obtain the joint occurs at ratei(i⫺1)n/4Nand moves the process from probability of observingkAsegregating sites at locus A level (l
A,lB) to (lA⫺1,lB). All other state transitions due
andkBatBby taking derivatives of the vector of pgfs, to drift and their rates are similarly determined.
Recombination:Because locusAshows absolute linkage
g(kA,kB)⫽
兺
kAjA⫽0
兺
kBjB⫽0
(lAvA)jA(lBvB)jB{[I⫺DP]⫺1D}jA⫹jB⫹1 to the specificity-determining region, onlyB locus
re-gions can transfer between specificity classes by recombi-nation. In any generation, a fractionr/2 of haplotypes ⫻Qh(kA⫺jA,kB⫺jB)c
kA,jA,kB,jB, (14)
are newly formed recombinants. We treat as negligible in which the dummy variables of the pgf and the sub- the probability of transmission of more than one haplo-scripts indicating level are suppressed for simplicity, and type derived from the single meiosis that generated a theckA,jA,kB,jBare determined from either of particular recombinant; consequently, its sister
recom-binant could not have borne an ancestral lineage (type
ckA,jA,kB,jB⫽ (jA⫹jB)ckA⫺1,jA⫺1,kB,jB⫹ ckA⫺1,jA,kB,jB (15a) 0). If the focal recombinant bears no ancestralBlineage
(type 0 or 1), recombination would have induced no
ckA,jA,kB,jB⫽ (jA⫹jB)ckA,jA,kB⫺1,jB⫺1⫹ ckA,jA,kB⫺1,jB, (15b)
transition in state. At rate rjni,j,k/2, one of the type 2
with initial conditions c1,0,0,0 ⫽ c1,1,0,0 ⫽ c0,0,1,0 ⫽ c0,0,1,1 ⫽ haplotypes in a specificity class presently of type (i,j,k) 1 andckA,jA,kB,jB⫽0 for anyjA⬎ kAor jB⬎kB. Beginning represents a newly formed recombinant;rkni,j,k/2 is the
rate for a type 3 recombinant. If the new recombinant with initial levels (2, 1) and (1, 2) (13), we obtain
deriva-tives of arbitrary orders for all sample sizes and configu- is type 2, the state of the recipient class immediately rations by successive application of (14), a double re- before the recombination event was (i,j⫺1,k); if type cursion in sample size and mutation numbers. 3, it was (i⫹1,j,k⫺1). TheBlineage of the
recombi-Mating-type regions: Application of this method to nant was derived from a specificity class presently of
the estimation of the rate of recombination between type (x,y,z) with probabilitynx,y,z/(n⫺1) for (x,y,z)⬆
the determinant of mating type and a neutral marker (i, j, k), and probability (ni,j,k ⫺ 1)/(n ⫺ 1) for (x, y,
locus entails only specification of one-step Markov matri- z)⫽(i,j,k). Our assumption that the sister to the focal ces (PlA,lB andQlA,lB). Figure 2 illustrates the three pro- recombinant was not transmitted entails that the former state of the donor class was (x,y⫹1,z), irrespective of cesses that mediate changes in state: coalescence of
hap-lotypes within specificity class through genetic drift, whether the newly formed recombinant is type 2 or 3. transfer of marker lineages among specificity classes by Turnover:At rate, one of thencommon specificities recombination, and turnover (invasion and extinction) segregating in the population represents a class that of specificity classes. Drift and turnover contribute to expanded in the immediately preceding generation. We between-level transitions (QlA,lB) and recombination con- assume that once initiated, the rise to common
frequen-cies of an invading class occurs virtually instantaneously tributes to within-level transitions (PlA,lB).
relative to mutation, recombination, and drift.
quently, all lineages within the new class descend imme- dominates the evolutionary process (CDⰇCR,CT), ensur-ing immediate transition to a lower level. Between such diately and without mutation from the single ancestor
in which the new specificity arose. Only thensspecifici- formations,CD⫽0 and the rates of transition through turnover or recombination correspond to
ties that contain a single type of lineage can have under-gone expansion in the immediately preceding
genera-CR⫽(r/2)[n0,1,0(n1,0,0⫹n0,1,0⫹n0,0,1⫺1)/(n⫺1)⫹n0,0,1] tion:
(19a)
ns⫽n0,0,0⫹
兺
i⬎0
(ni,0,0⫹ n0,i,0⫹n0,0,i). (16)
CT⫽(/n2)(n1,0,0⫹n0,1,0⫹n0,0,1)(n1,0,0⫹n0,1,0⫹n0,0,1⫺1) (19b) At approximate steady state for the number of
com-mon alleles (n), the extinction of an existing common [from (18)]. allele accompanies the invasion of a new allele. At rate
/n, a new specificity class (O) invades and replaces its
APPLICATION immediate parent (P). For example, O presently has
type (i, 0, 0) with probabilityni,0,0/ns, having expanded We apply our method to obtain a maximum-likeli-from a type (1, 0, 0) ancestor. This event implies a hood estimate (MLE) of the rate of recombination be-transition in state from level (lA,lB) to (lA⫺i ⫹1,lB). tween marker locus48AandS-RNase, the determinant
At rate (1 ⫺ 1/n), O invades and coexists with P. of pistil specificity inS-RNase-based systems of GSI. We The probability that O currently has type (i, j, k), in assume that substitution of neutral mutations occurs at which only one ofi,j, andkis positive, andPcurrently the per-site ratevin both loci, with the per-locus rates has type (x,y, z) corresponds to ni,j,knx,y,z/ns(n ⫺ 1) for proportional to sequence length (vA ⫽ vXA, vb ⫽ vXB,
(x,y,z)⬆(i,j,k), and toni,j,k(ni,j,k⫺ 1)/ns(n⫺ 1) for for XA and XB numbers of sites). The parameters of
(x,y,z)⫽(i,j,k). For example, ifOpresently has type our model include the number of common S-alleles (0, 0,k), then immediately before the turnover event, segregating in the population (n), scaled per-site rate
P had type (x, y, z ⫹ 1) and the process was at level of neutral substitution ( ⫽ 4Nv), rate of invasion of (lA⫺k⫹1,lB⫺k⫹1). Similar considerations provide new commonS-alleles [ (4), or its inverse functionf
the rates of all possible state transitions due to turnover. (7)], and scaled rate of recombination (R⫽ 4Nr).
Relative rates of transition:For statemon level (lA,lB), HudsonandKaplan’s (1988) analysis of symmetric
the joint pgf of the numbers of mutations accumulated biallelic overdominance without allelic turnover sug-at locusAand locusBbefore the first transition in state gested that the rate of recombination between the target
corresponds to of balancing selection and a linked neutral site might
be inferred from the level of variation at the neutral flA,lB(a,b)(m)⫽
CD⫹CR⫹CT
CD⫹CR⫹CT⫹vAlA(1⫺a)⫹vBlB(1⫺b)
, site alone. In the presence of allelic turnover, however, this information is insufficient because balancing selec-(17)
tion can decrease as well as increase the age of the MRCA at linked sites (Uyenoyama and Takebayashi
forCD,CR, andCTrates of change due to genetic drift
2004). Simultaneous consideration of variation at sites within specificity class, recombination, and turnover of
absolutely linked to the target of selection improves specificity classes:
inference about the rate of recombination between the target and partially linked sites.
CD⫽(n/2N)
兺
ni,j,k冢
i⫹j⫹k
2
冣
(18a) In this section, we summarize our previous estimatesof the number of mutation events atS-RNase, assumed CR⫽(r/2)
兺
ni,j,k{j[1⫺ni,j⫺1,k/(n⫺1)]⫹k} (18b)absolutely linked to the S-locus, and at the partially CT⫽(/ns)
冤
兺
i⬎1
(ni,0,0⫹n0,i,0⫹n0,0,i) linked marker48A, and our conclusion that the pattern
of variation at the marker locus alone provides an insuf-⫹(n1,0,0⫹n0,1,0⫹n0,0,1)(n⫺n0,0,0⫺1)/n
冥
. ficient basis for the estimation of the rate of recombina-tion between the loci. We then describe analyses of (18c)variation at each locus separately, comparing estimates We consider a rapid-drift approximation (compare obtained from the method-of-moments and likelihood
Takahata 1991 with Notohara2000), which entails approaches. Finally, we present results of our ML
analy-that coalescence within specificity class occurs virtually sis of the joint pattern of variation atS-RNaseand48A. instantaneously relative to recombination or coales- Numbers of segregating sites: Takebayashi et al.
TABLE 1
Segregating neutral mutations
Locus Variation Sites Mutations
S-RNase Syna 114.2 205.8
48A Syn 22.8 2.2
UTRb 236 15.7
aSynonymous substitutions.
bDifferences within the 3⬘-untranslated region (UTR).
which all targets of positive selection had been excluded, we adopted a very liberal criterion for positive selection. Table 1 presents our estimates, corresponding to the total lengths of ML trees, of the numbers of neutral mutations segregating in the conservative evolution
par-tition in a sample of five two-locus haplotypes, each Figure3.—Log-likelihoods of parametersR/andf deter-representing a distinctS-allele specificity. The estimated mined from estimated number of segregating sites at 48A number of synonymous mutations at S-RNase exceeds under the assignment n⫽ 20 and f ⫽ 10. The thick line indicates the ridge of highest likelihood, with contour lines the number of synonymous sites, indicating that many
spaced at intervals of 0.5 log-likelihood units. sites have accumulated multiple hits within the span
of the very deep S-allele genealogy. Even under this underestimation of the number of mutations inS-RNase,
(Figure 3) indicates that the low level of neutral varia-the ⬎15-fold deficiency in 48A departs highly
signifi-tion at48Arelative toS-RNaseis consistent with a contin-cantly from expectation under the hypothesis of
abso-uum of values ofR/andf. For example, low variation
lute linkage (Takebayashiet al.2003).
might reflect tight linkage to the S-locus (small R/)
Underestimation of the total number of mutations
and frequent rapid expansions of newly arisen alleles accumulated at S-RNase over the span of the S-allele
(high turnover rate, or smallf). Alternatively, loose
genealogy may have caused underestimation of both
linkage (large R/) would moderate the expected
in-genealogical depth (f) and recombination rate (fR).
crease in age of the MRCA at sites linked to a target of The net effect of these biases on our estimate of the
balancing selection that is subject to infrequent turn-rate of recombination relative to the turn-rate of synonymous
over (largef). Consideration of additional marker loci
substitution (R/) remains unexplored.
would introduce a new recombination rate for each
Insufficiency of information at marker locus alone:
locus; even so, analysis of the joint numbers of segregat-A key determinant of the rate of coalescence among
ing sites would improve the estimation if linkage rela-marker lineages is the rate of formation ofS-allele classes
tionships among the markers were known. that contain multiple lineages. Because allelic turnover
Analysis of variation at each locus separately:Under
as well as recombination can generate such classes, the
the rapid-drift approximation (19), the pgf of the num-number of segregating sites at the marker locus alone
ber of segregating sites in samples of size L reduces, provides an insufficient basis for the estimation of the
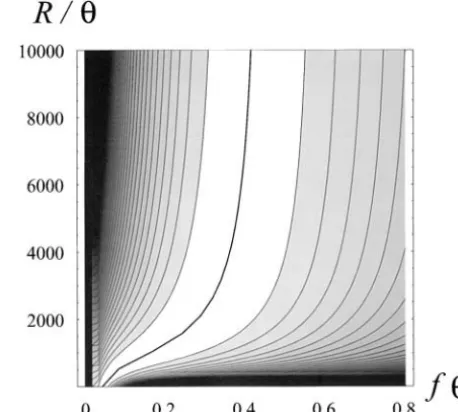
under a rescaling of time, toWatterson’s (1975) classic recombination rate.
result for populations without specificity classes, Figure 3, fromUyenoyamaandTakebayashi(2004),
shows the likelihood surface generated by our method
gL(a)⫽
兿
L
l⫽2
(l⫺1) (l⫺1) ⫹ R(1⫺a)
, (20)
from the estimated number of segregating sites at48A
under the assignmentn⫽20 andf⫽10. While
informa-in which tion on the number (n) ofS-alleles segregating in
ances-tral natural populations of N. alatais unavailable, the
R⫽f
2(n⫺1)
Rf⫹ 2(n⫺1) (21)
extensive body of empirical and theoretical work on gametophytic SI systems suggests the segregation of
TABLE 2
Single-locus analyses ofS-RNaseand48A
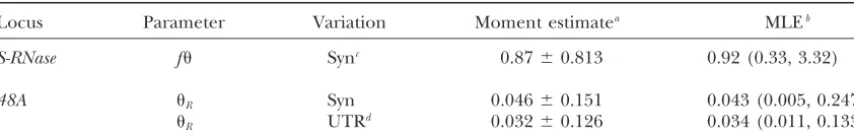
Locus Parameter Variation Moment estimatea MLEb
S-RNase f Sync 0.87⫾0.813 0.92 (0.33, 3.32)
48A R Syn 0.046⫾0.151 0.043 (0.005, 0.247)
R UTRd 0.032⫾0.126 0.034 (0.011, 0.133)
aMean⫾standard deviation, from (22). bWith 2-unit support limits.
cSynonymous differences. dDifferences within the 3⬘UTR.
one composite parameter, precluding separation ofR/ same haplotype (KaplanandHudson1985;Wiufand
Hein1999). Recombination tends to break up any type andf.
For comparison to our ML analysis, we outline a 3 haplotypes in the initial sample into types 1 and 2. To assess the effect of shared history, we compared the method-of-moments approach using the one-locus,
rapid-drift pgf (20). This pgf provides familiar expres- MLEs determined by maximizing the joint likelihood to those determined by maximizing the composite likeli-sions for the first two moments of the number of
segre-gating sites (S), hood obtained from the two one-locus models (20).
Table 3 shows very close correspondence between the
E(S)⫽ RaL (22a) composite and joint MLEs across a range spanning
real-istic values of the number ofS-alleles in the population Var(S)⫽ RaL⫹ 2RbL, (22b)
(n). This agreement suggests that recombination has in which aL⫽兺Ll⫽⫺111/land bL⫽兺Ll⫽⫺111/l2, which sug- occurred at a sufficiently high rate to justify ignoring gest an unbiased moment estimator ofRofSˆ/aL, with the correlation due to the initial sampling of type 3
varianceSˆ/aL⫹ Sˆ2bL/a4L(Watterson1975). haplotypes.
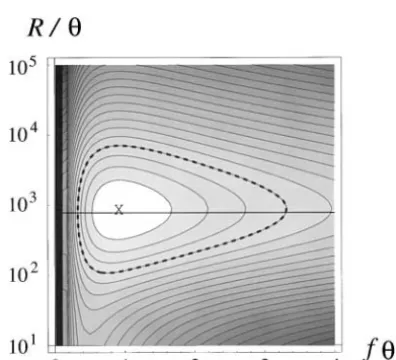
Table 2 presents estimates of R (21) based on the Assuming negligible correlation between the loci, we
number of segregating sites at each locus separately. studied the shape of the composite-likelihood surface. Shown are both method-of-moments estimates, with ap- Figure 4 shows composite likelihoods of R/ and f proximate standard deviations, and MLEs, with 2-unit under the assignmentn⫽20. The steep decline in the support ranges (two log-likelihood units; Edwards likelihood of small values of R/ supports our earlier
1972). In the absence of recombination between 48A rejection of absolute linkage (Takebayashiet al.2003).
andS-RNase (R⫽ 0), composite parameters fandR This analysis provides an MLE ofR/of 841.56 (Figure
(21) would be identical. In accord with the significant 4, X).
rejection of absolute linkage by an exact test (Takeba- Rearrangement of (21) suggests another means of
yashi et al. 2003), the 2-unit support ranges for the estimatingR/,
MLEs of these parameters do not overlap. In contrast,
R/典 ⫽2(n ⫺1)(f典 ⫺ R
典
)/R
典
f典, (23)
the moments approach fails to distinguish between the estimates offandR, or even between either estimate
forR
典
determined from the number of segregating sites and zero. Both the asymmetry of the 2-unit support
at 48A and f典 from S-RNase. Assignment of n ⫽ 20
ranges of the MLEs and the magnitude of the
confi-andR
典
andf典 to the moments estimates given in Table dence intervals obtained from the moments approach
2 givesR/典 ⫽776.52 (Figure 4, horizontal line), some-suggest that the variance estimates provide little
indica-what less than the MLE. tion of dispersion about the expectation.
Two-locus likelihoods:Considering variation at both
loci, we obtained maximum-likelihood estimates ofR/
DISCUSSION andf under the rapid-drift approximation (19). The
joint likelihood represents the probability of the ob- Maximum-likelihood estimation of very low
recombi-nation rates:We have described a method for the
re-served pair of numbers of segregating sites at the two
loci, and the composite likelihood the product of the cursive computation of the exact sampling distribution of the numbers of neutral mutations segregating at a probabilities determined separately for each locus.
Max-imization of the composite likelihood would treat the marker locus and a target of balancing selection in a sample of arbitrary size and configuration. A⬎15-fold numbers of segregating sites atS-RNaseand48Aas
inde-pendent. Correlations between loci reflect periods of deficiency in variation at marker locus 48Arelative to
S-RNase, the determinant of SI specificity in pistil (Table
TABLE 3
Maximum-likelihood estimates of rates of recombination and synonymous substitution
Composite likelihoods Joint likelihoods
n f Ra fb R/ f R f R/
5 162.69 0.9183 177.17 163.65 0.9182 178.23
10 366.05 398.63 366.61 0.9180 399.38
20 772.77 841.56 773.07 0.9181 842.05
30 1179.49 1284.49 1179.69 0.9181 1284.88
50 1992.94 2170.34 1993.06 0.9182 2170.65
100 4026.55 4384.98 4026.61 0.9182 4385.21
aFromf典 ⫽0.9183 and R
典
⫽0.043 (Table 2), using (21).
bIndependent ofn.
1;Takebayashiet al.2003), corresponds to an MLE of alogy. Segregating S-allele classes appear to have
di-verged⬎30 million years (MY) ago in both the solana-the interlocus recombination rate of perhaps 3 orders of
magnitude greater than the per-site rate of synonymous ceous S-RNase-based GSI system (Ioerger et al. 1990) and the Brassica SSI system (Uyenoyama1995). Adopt-substitution (Figure 4).
To an order of magnitude, rates of synonymous substi- ing this figure for the average pairwise divergence time suggests an expected total length of a five-allele geneal-tution in plants (Arabidopsis thaliana;Zhanget al.2002)
as well as mammals (Liet al.1985;KumarandSubra- ogy of 120 MY. Over intervals of this magnitude, recom-bination at even the very low rate suggested by our
manian 2002) fall in the range 10⫺8–10⫺9/site/year.
Under the assumption of an annual life cycle, our esti- analysis appears to have been sufficient to cause a sig-nificant reduction in the number of synonymous muta-mates suggest a rate of recombination between48Aand
S-RNaseon the order of 10⫺3or 10⫺4cM.Liet al.(2000) tions segregating at48Arelative toS-RNase.
Countervailing effects of strong balancing selection:
detected no recombination between the S-locus and
three marker loci, including48A, in screens of hundreds Most studies of the effects of balancing selection on neutral variability in linked regions restrict consider-of plants (Table 4). The minimum detectable rate consider-of
recombination (ⵑ1 cM) exceeds by several orders of ation to the biallelic case (e.g.,Strobeck1980;Kaplan
et al.1988; Bartonand Navarro 2002). In contrast,
magnitude our MLE, which reflects recombination
events that occurred within the span of theS-allele gene- homomorphic SI systems maintain dozens or even hun-dreds of S-alleles (Lawrence 2000). A phenomenon that arises in multiallelic but not biallelic systems held in polymorphism by strong balancing selection is the rapid increase in frequency of novel or rare alleles. Such abrupt expansions tend to decrease neutral variation within specificity class at hitchhiking sites. However, strong balancing selection can also increase divergence times and neutral diversity at linked sites by expanding the timescale of coalescence among allelic classes (
Tak-ahata1990;Sasaki1992;VekemansandSlatkin1994;
Uyenoyama2003). Recombination and allelic turnover
jointly influence the overall pattern of nucleotide
varia-TABLE 4
Minimum detectable interval between theS-locus and marker loci
Figure4.—Log-likelihoods of parametersR/andfdeter- Marker locus Plants screened Linkage (cM)a
mined from composite probabilities under the assignment
n⫽ 20. Contour lines surrounding the the MLE point (X) 48A 215 0.7 are spaced at intervals of 0.5 log-likelihood units, with the CP100 154 0.8 dashed line indicating the 2-unit support range. The hori- CP108 198 1.0 zontal line (23), indicating the expected relationship based
on the first moments, provides an excellent indication of the Data are fromLiet al.(2000).
aUpper bound of 95% confidence interval.
tion. In contrast, under the assumptions of constant ous mutations and the S-locus (S-allele-specific load) may accumulate.
allele frequencies and no allelic turnover, the observed
S-allele-specific load: An analysis of the shape of
decline with looser linkage in interallelic pairwise
differ-S-RNase genealogies indicated significantly long
termi-ences in a sliding-window analysis of the Adh locus of
nal branches (Uyenoyama 1997). This method has
Drosophila melanogasterwas deemed sufficient to identify
been used to detect similar distortions in a larger sample the nucleotide site subject to balancing selection (
Hud-of solanaceous S-alleles (Richman and Kohn 1999),
sonandKaplan1988).
among Brassica SSI S-alleles (Schierup et al. 1998), Distinguishing between an ancient episode of
purify-among fungal mating specificities (May et al. 1999), ing selection at a tightly linked site and a recent episode
and at a major histocompatibility complex class II locus at a loosely linked site presents a general challenge to
(Richman and Kohn 1999). Even the Adh
polymor-methods that seek to infer the location of a target of
phism inD. melanogaster, an exemplar of balancing selec-selection from the pattern of neutral variation (Kim
tion, shows this pattern (HudsonandKaplan1986).
andStephan2002;NavarroandBarton2002). The
Uyenoyama(1997, 2000) proposed that progressive
likelihood surface obtained from consideration of
varia-intensification of allele-specific load may contribute to tion at 48A alone (Figure 3) reflects these alternative
this kind of genealogical distortion. Analysis of an exten-explanations for low variation. In our study, the problem
sion ofWright’s (1939) classical diffusion model of GSI was exacerbated by the nature of the sample, which
indicated that allele-specific load reduces the expected comprised only one representative of eachS-allele. The
number of common alleles (n) maintained in popula-magnitude of variation within mating-type alleles can
tions and the rate ofS-allele diversification ( ⬀1/f) provide information about the age of a given specificity
for a given effective population size and rate of origin and consequently the rate of specificity turnover (
Slat-of newS-alleles (Uyenoyama2003). AlthoughS
-allele-kinandRannala1997;Mayet al.1999).
specific load is expected to change the nature of the
Evolution under tight linkage and enforced
heterozy-dependence of f and n on population size and rate
gosity: In addition to the intense balancing selection
of origin of new alleles, our analysis treats f and n as engendered by GSI, “Muller’s ratchet” (Felsenstein
phenomenological parameters. Consequently, we con-1974) and related degenerative processes (
Charles-jecture that the presence of S-allele-specific load may
worthandCharlesworth2000) likely operate within
not severely compromise our estimate of the relative mating-type regions.Rozenet al.(2003) have proposed
rate of recombination (R/).
that gene conversion within the extensive palindromes
Method of moments:Many workers have used
back-of the human Y chromosome has permitted
preserva-ward recursions to determine the moments of diver-tion of many essential male-specific genes.
Degenera-gence times or numbers of pairwise differences (e.g., tion appears to be the fate of Y-linked genes that lack
Kaplan et al.1988;Notohara1990; Takahata1991;
recourse to such special mechanisms (Marshall Graves
Wakeley 1998). In particular, Kaplan and Hudson
2002).
(1985) derived the mean, variance, and covariance of In regions under complete linkage to the S-locus,
numbers of segregating sites at multiple loci in samples enforcement ofS-allele heterozygosity postpones
forma-of arbitrary size. While the expectation corresponds well tion of zygotes bearing a mutation in homozygous form to the high-likelihood region (Figure 4), the confidence until after the diversification in mating type of its carri- intervals appear uninformative (Table 2; Uyenoyama ers. Ancient (⬎30 MY) divergence amongS-alleles and andTakebayashi2004). For the system at hand, likeli-tight linkage to theS-locus of genomic tracts of consider- hood methods may provide a more reliable basis for able size (Boyeset al.1997;McCubbinandKao1999; statistical inference.
Wanget al.2003) together imply the accumulation of Maximum-likelihood methods: Felsenstein et al.
mutations over very long periods and at a great many (1999) andStephensandDonnelly(2000) have pro-sites prior to their selective screening in homozygous vided lucid accounts of two powerful ML approaches
form. using Monte Carlo computational methods. Felsenstein
Small population size promotes the substitution of and colleagues have addressed the estimation of popula-deleterious mutations (Nei 1970). Subdivision of the tion parameters, using Metropolis-Hastings (MH) sam-gamete pool into many mating types exacerbates degen- pling of genealogies to average over the missing datum eration at sites tightly linked to mating-type regions. In of the genealogy of the sampled genes. In the Felsen-populations with equal frequencies of the sexes, Y-linked stein approach, a genealogy comprises topology and genes experience an effective population size fourfold branch lengths in units of mutations. Alternatively, lower than that of autosomal genes. Linkage to the GriffithsandTavare´(1994) characterize the
proba-S-locus reduces effective population size by n-fold, for bility distribution of entire histories as solutions of
deleteri-tral linear recursions are defined over the effectively intense balancing selection and gene genealogies with multifurcating nodes. In practice, the range of applica-infinite-dimensioned state space of history, importance
sampling (IS) is used to approximate the underlying tions would be limited primarily by the size of the central system of linear recursions (14). Efficient IS methods Markov chain.
The joint distribution of numbers of segregating sites have been described for some arbitrarily large systems
(GriffithsandTavare´1994;StephensandDonnelly
at two neutral loci (Griffiths 1981) or of the ages of
the most recent common ancestors of sampled genes at 2000).
multiple neutral loci (GriffithsandMarjoram1996; We thank two anonymous reviewers for constructive comments.
Griffiths 1999; Slade 2002) provides information E.N. receives funding from the Australian Research Council. U.S.
Public Health Service grant GM 37841 to M.K.U. provided support
about rates of recombination among the loci.
Imple-for this study.
mentations of MH (Kuhneret al.2000) and IS (
Fearn-headandDonnelly2001, 2002) methods for the
esti-mation of recombination rates have been developed.
LITERATURE CITED Incorporation of recombination entails analysis of the
even larger state space of ancestral recombination graphs Barton, N. H., 1998 The effect of hitchhiking on neutral genealo-gies. Genet. Res.72:123–133.
(Griffiths1991;Griffiths andMarjoram1996).
Barton, N. H., andA. Navarro, 2002 Extending the coalescent to
Our primary objective is the estimation of population multilocus systems: the case of balancing selection. Genet. Res.
79:129–139.
parameters rather than genealogy reconstruction. Our
Birky, C. W., andJ. B. Walsh, 1988 Effects of linkage on rates of
method is much simpler than other ML approaches
molecular evolution. Proc. Natl. Acad. Sci. USA85:6414–6418.
because we base our estimate of the rate of recombina- Boyes, D. C., M. E. Nasrallah, J. VrebalovandJ. B. Nasrallah,
1997 The self-incompatibility (S) haplotypes of brassica contain
tion on the summary statistic of number of segregating
highly divergent and rearranged sequences of ancient origin.
sites. Computation of the likelihoods, which incorporate
Plant Cell9:237–247.
averaging over all possible histories of the sampled hap- Brewer, P., 1998 The statistical analysis of a gene tightly linked to
the self-incompatibility locus. BSc Honours Thesis, University of
lotypes, entails recursive solution of linear systems of
Melbourne, Melbourne.
equations, not simulation of a posterior distribution
Casselman, A. L., J. Vrebalov, J. A. Conner, A. Singhal, J.
Giovan-of genealogies. The variables Giovan-of our recursion system noniet al., 2000 Determining the physical limits of the brassica
Slocus by recombinational analysis. Plant Cell12:23–33.
correspond to probability-generating functions of
num-Charlesworth, B., andD. Charlesworth, 2000 The
degenera-bers of segregating sites, and the state space of our
tion of Y chromosomes. Philos. Trans. R. Soc. Lond. B 355:
Markov chain comprises all possible configurations of 1563–1572.
Charlesworth, B., M. T. MorganandD. Charlesworth, 1993
the sample (assignment of lineages toS-allele classes).
The effect of deleterious mutations on neutral molecular
varia-Mutations are not part of the definition of state, as in the
tion. Genetics134:1289–1303.
Griffiths/Tavare´ approach, but are tracked separately by Crandall, K. A., andA. R. Templeton, 1999 Statistical approaches
to detecting recombination, pp. 153–176 inThe Evolution of HIV,
the pgfs. The enormous reduction in the dimension of
edited by K. A.Crandall. Johns Hopkins University Press,
Balti-the state space permits direct solution of Balti-the systems
more.
of linear equations without resort to IS computational Edwards, A. W. F., 1972 Likelihood. Cambridge University Press,
Cambridge, UK.
methods. Further, the simplicity of the analytical
de-Entani, T., M. Iwano, H. Shiba, F.-S. Che, A. Isogaiet al., 2003
scription [e.g., (11) and (14)] serves to clarify the
evolu-Comparative analysis of the self-incompatibility (S-) locus region
tionary process. ofPrunus mume: identification of a pollen-expressed F-box gene
with allelic diversity. Genes Cells8:203–213.
Applications:Our approach may facilitate the
deter-Ewens, W. J., 1964 On the problem of self-sterility alleles. Genetics
mination of the relative order of markers in regions
50:1433–1438.
containing targets of various forms of strong balancing Fearnhead, P., andP. Donnelly, 2001 Estimating recombination
rates from population genetic data. Genetics159:1299–1318.
selection (see Introduction). Sampling strategies most
Fearnhead, P., and P. Donnelly, 2002 Approximate likelihood
useful for inferring gene order from the relative
num-methods for estimating local recombination rates. J. R. Stat. Soc.
bers of segregating sites include obtaining haplotypes B64:657–680.
Felsenstein, J., 1974 The evolutionary advantage of recombination.
that comprise the target of balancing selection as well
Genetics78:737–756.
as the marker loci, multiple haplotypes corresponding
Felsenstein, J., M. K. Kuhner, J. YamatoandP. Beerli, 1999
Likeli-to the same specificity class, and multiple distinct speci- hoods on coalescents: a Monte Carlo sampling approach to
infer-ring parameters from population samples of molecular data, pp.
ficity classes.
163–185 inStatistics in Molecular Biology and Genetics, edited by F.
In principle, our method can accommodate
addi-Seillier-Moiseiwitsch. Institute of Mathematical Statistics and
tional summary statistics (e.g., number of distinct haplo- American Mathematics Society, Haywood, CA.
Ferris, P. J., C. Pavlovic, S. FabryandU. W. Goodenough, 1997
types, frequency spectrum of mutations) and general
Rapid evolution of sex-related genes in Chlamydomonas. Proc.
biological processes or population structures.
Customi-Natl. Acad. Sci. USA94:8634–8639.
zation to the ecology and genetics of the particular Ferris, P. J., E. V. ArmbrustandU. W. Goodenough, 2002 Genetic
structure of the mating-type locus ofChlamydomonas reinhardtii.
system under study entails redefinition of the state space
Genetics160:181–200.
and derivation of one-step Markov transition matrices
Fisher, R. A., 1930 The Genetical Theory of Natural Selection, Ed. 1.
(9). In our present analysis, these tasks were straightfor- Oxford University Press, Oxford.
Gallegos, A., D. J. Jacobson, N. B. Raju, M. P. SkupskiandD. O.