ISSN(Online): 2319-8753 ISSN (Print) : 2347-6710
I
nternational
J
ournal of
I
nnovative
R
esearch in
S
cience,
E
ngineering and
T
echnology
(A High Impact Factor, Monthly, Peer Reviewed Journal)
Vol. 5, Issue 2, Februray 2016
Study of Regression Techniques on the Risk
Modelling In Highway Projects Using Fault
Tree Analysis & Recommendations for
Rectification
Shahabas. S1, Sivaprakash. G2
Student, Department of Civil Engineering, SRM University, Chennai, India1
Assistant Professor, Department of Civil Engineering, SRM University, Chennai, India2
ABSTRACT - Managing risks in construction projects has been recognized as a very important management process in order to achieve the project objectives in terms of time, cost, quality, safety and environmental sustainability. However, until now most research has focused on some aspects of construction risk management rather than using a systematic and holistic approach to identify risks and analyze the probability of occurrence and impact of these risks. Indian highway construction projects are associated with different levels of risks.
The main aim of this paper is to identify the most significant risk factors affecting highway construction project in Kerala & to decrease the probability and impact of those risks. The research method starts with extensive literature review to provide a prime risk factors list which was also augmented to expertise to reach final risk factor list which contains all risks that may be faced during highway construction. Subsequently, a set of 6 risk groups consisting of 60 risks was selected and a questionnaire survey was conducted to determine the likelihood and consequences of the identified risks. Later with the help of 2 indices, probability index and severity index ranking of factors has been done. The statistical analysis for the data is done using SPSS. By using Fault Tree method the risks has been analyzed and remedial measures are taken. This analysis method is mainly used to understand how systems can fail, to identify the best ways to reduce risk. Risk assessment and analysis can help in suggesting a practical approach to identify the level of criticality of any risk event in construction domain. Results indicated that the root cause which is the ‘design variation’ was found the reason for the system failure. This risk can be avoided through proper planning, scheduling, improving quality of the work, labour training and most importantly through avoiding variations in design of the project once it is commenced for execution.
KEYWORDS: Fault tree analysis, Highway projects, Risk analysis, Statistical analysis
I. INTRODUCTION
A risk is defined as the combination of probability of an event and its impacts on project objectives. A positive consequence presents an opportunity and a negative consequence poses a threat. Risk is involved in every business, and the construction industry is no exception. Construction projects carry substantial risks because of the involvement of a large number of parties such as owners, designers, supervision consultants, contractors, subcontractors, suppliers, manufacturers, and governments.
The construction industry is subject to more risks compared with many other industries due to the unique features of construction activities, such as long period, complicated processes, abominable environment, financial intensity and dynamic organization structures. Hence, taking effective risk management techniques to manage risks associated with variable construction activities is important for the successful delivery of a project.
ISSN(Online): 2319-8753 ISSN (Print) : 2347-6710
I
nternational
J
ournal of
I
nnovative
R
esearch in
S
cience,
E
ngineering and
T
echnology
(A High Impact Factor, Monthly, Peer Reviewed Journal)
Vol. 5, Issue 2, Februray 2016
realization of opportunities. A systematic process of risk management has been divided into risk classification, risk identification, risk analysis and risk response, where risk response has been further divided into four actions, i.e. retention, reduction, transfer and avoidance
The present study aims to identity the risk factors involved in high way projects, quantification of the risk factors based on the probability of occurrence and degree of impact and detailed analysis and modeling to determine the direct and root cause of risks using fault tree analysis.
II. LITERATURE SURVEY
Ming-The Wang et. al. (2003) “Risk Allocation and Risk Handling of Highway Projects in Taiwan” provides analytic procedures to recognize the risk allocation of construction projects and investigate the influence of risk allocation to contractor’s risk handling decisions. This paper also investigates the effects of risk allocation and risk event conditions on contractors’ risk handling decisions because owners and contractors usually have disagreements over risk responsibilities.Mohamed SayedBassionyet. al. (2015) “Identification and Assessment of Risk Factors Affecting Construction Projects” tried to identify, qualify, study, assess, and quantify the factors that affect budget and time contingency. This paper focused to identify and study the factors that affect cost overrun and schedule overrun, also to develop a probability distribution charts for likelihood, cost impact and schedule impact, and to quantify the Risk assessment impact on cost and schedule.Yanjun Zhao et. al. (2011) “Forecast for Construction Engineering Risk Based on Fuzzy Sets & System Theory” introduces the fuzzy system theory to build a construction engineering risk fuzzy forecast model.Osama Ahmed Jannadiet. al. (2003) “Risk Assessment in Construction” presents a risk assessor model (RAM) that was developed & that determines risk scores for various construction activities. The model also provides an acceptability level for the risks and determines a quantitative justification for the proposed remedy.Sadi A. Assafet. al. (2006) “Causes of delay in large construction projects”done survey on time performance of different types of construction projects in Saudi Arabia was conducted to determine the causes of delay and their importance according to each of the project participants. The most common cause of delay identified by all the three parties is ‘‘change order’’.Ana I. Irimia-Diéguezaet. al. (2014) “Risk Management in Megaprojects” focused on risk identification. Our purpose is to establishing the state of the art in risk management in megaprojects, systematizing the risks studied in the Literature, as well as to identify potential areas of further research.Dr. Patrick. X.W. Zouet. al. (2004) “Identifying Key Risks in Construction Projects: Life Cycle and Stakeholder Perspectives”: This research endeavored to identify key risks associated with the achievement of all project objectives in terms of cost, time, quality, environment and safety.
III. METHODOLOGY
The research aims to apply complete risk management process on highway construction project in Egypt. Through this process, there will be a list of risks in highway construction (risk identification) and definition of the most significant risks through applying evaluation process (applying risk analysis and assessment). The methodology adopted in the project is of descriptive type. The descriptive method of research includes observational method, case study method and survey method.
The research based on three main phases is as follows: Phase I: risk identification (initiating risk factors list);
Phase II: risk evaluation (asses risk factors and define the most significant risk factors in highway construction projects);
Phase III: determination root cause of risks using fault tree analysis.
In Phase I, extensive literature review on risk management related to highways was conducted to provide a prime questionnaire. In addition, this list was augmented to expertise to reach risk factors list that contains all risk factors that may be faced by highway construction project.
Phase II defines the risks through a questionnaire survey that was conducted on a group of expertise from different sectors (contractor and engineers) and also from different environment (local and international). The objective of this phase is to reach the most significant risks that highway construction projects faced in Kerala. The statistical analysis for the data is done using SPSS is presented in this section. The analysis includes:
ISSN(Online): 2319-8753 ISSN (Print) : 2347-6710
I
nternational
J
ournal of
I
nnovative
R
esearch in
S
cience,
E
ngineering and
T
echnology
(A High Impact Factor, Monthly, Peer Reviewed Journal)
Vol. 5, Issue 2, Februray 2016
3) Descriptive Statistics 4) Frequency Distributions 5) Correlation Analysis6) Regression Analysis
Phase III deals with developing a model using fault tree analysis by Boolean logic. Finding the root causes which can eliminate the risk factors to a maximum extent and thus minimizing the occurrence of these base events for risk avoidance.
IV. RISK IDENTIFICATION (PHASE 1)
In phase 1, as a part of risk identification and risk validation 60 risks were identified and listed out. The identified risks can be grouped or classified under cost risks, quality risks, environmental risks and safety risks. The risks were identified from various journals and publications. The risk validation was done through pilot survey.
Risks identified from literature reviews:
1) Tight project schedule
2) Design variations
3) Variations by the client
4) Loss due to rise in fuel price
5) Insurance risks
6) Worker characteristics
7) Changes in climate, temperature
8) Unsuitable construction planning
9) Occurrence of dispute
10) Price inflation of construction materials
11) Diversity of work types
12) Incomplete approval and other documents
13) Inaccurate cost estimate
14) Inadequate program scheduling
15) Variations by the client
16) Variations of construction operations
17) High performance expectations
18) Inadequate program scheduling
19) Low management competency
20) Unavailability of sufficient amount of skilled labours
21) Lack of coordination
22) Noise pollution due to construction operations
23) Schedule pressure
24) Inadequate supervision
25) Supervisory violations
26) Poor quality material supply
27) Improper verification of contract document
28) Lack of enforcement of legal judgment
29) No past experience in similar projects
30) Short tender time
31) Internal management problem
32) Improper project feasibility study
33) Poor relation and disputes with partner
34) Project delay
35) Market risks
36) Changes in work
37) Subsurface geological an geotechnical conditions
38) Late drawings and instructions
39) Unavailability of resources
ISSN(Online): 2319-8753 ISSN (Print) : 2347-6710
I
nternational
J
ournal of
I
nnovative
R
esearch in
S
cience,
E
ngineering and
T
echnology
(A High Impact Factor, Monthly, Peer Reviewed Journal)
Vol. 5, Issue 2, Februray 2016
41) Error in structural designs
42) Wrong selection of materials
43) Delayed deliveries and disruptions
44) Unsuitable equipment
45) Environmental analysis- incomplete/ wrong
46) Offsite and onsite wetlands
47) Land acquisition problems
48) New stakeholders
49) New information required for permits
50) Inconsistent cost, time, scope and quality 51) Political factors change (political interference)
52) Local communities pose objections
53) Water quality issues
54) Historic site, endangered species or wet land present
55) Inexperienced staff assigned
56) Insufficient time to plan
57) Too many projects
58) Consultant or contractor delays
59) Lack of coordination/ communication
60) Estimating/ scheduling errors
Based on risk validation, the 60 risks were validated and out of it 28 risks were classified under project approval delay, time overrun risks, cost overrun risks, site condition risks and safety risks.
V. ANALYSIS AND RESULT (PHASE 2)
In phase 2, the data were collected through questionnaire survey from engineers in PWD road sections, Kerala and contractors who have experience in NH/SH constructions. Later the data were analyzed using Statistical Package for Social Sciences (SPSS). The data was fed into the SPSS software on the basis 5 likert scale with 1- very low to 5- very high.
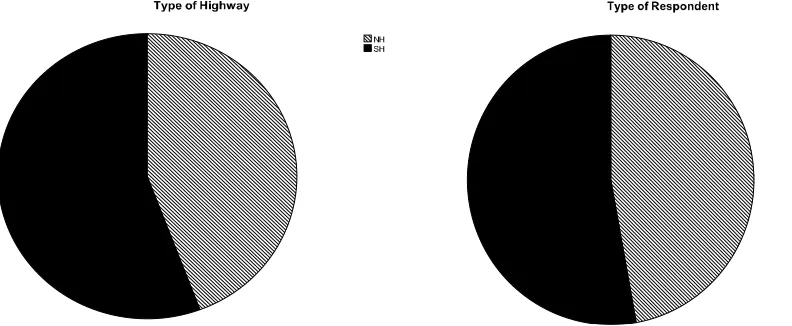
A. Pie Charts
Pie chart is a type of graph in which a circle is divided into sectors that each represents a portion of the whole.
The results of number of highways and number of respondents are represented using the pie chart as below.
Figure 1. Type of highway (NH or SH)
ISSN(Online): 2319-8753 ISSN (Print) : 2347-6710
I
nternational
J
ournal of
I
nnovative
R
esearch in
S
cience,
E
ngineering and
T
echnology
(A High Impact Factor, Monthly, Peer Reviewed Journal)
Vol. 5, Issue 2, Februray 2016
B. Reliability Analysis
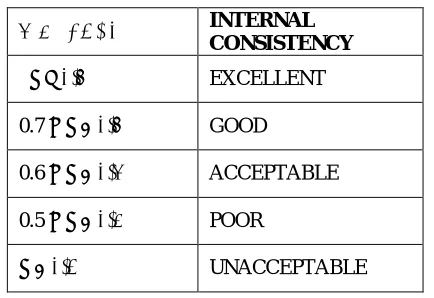
Reliability means the ability of a system to function continuously in a specified time period without failure. Reliability analysis is used to analyze the dependability of a product to study its life cycle management. The most popular reliability statistics in use today is Cronbach's alpha (Cronbach, 1951). Cronbach's alpha determines the internal consistency or average correlation of items in a survey instrument to gauge its reliability. Internal consistency means how closely the data is related.
Table 1:Range of Internal Consistency Using Cronbach’s alpha
Table 2:Reliability Analysis for risks to show how they are inter related to the risk factor
C. Descriptive Statistics
Descriptive statistics is the discipline of quantitatively describing the main feature of a collection of information. Descriptive statistics provides simple summaries about the sample and about the observation that have been made.
Measures that are commonly used to describe a data set are measures of central tendency and measures of central variability (or dispersion). Measures of central tendency include mean, median and mode whereas measures of variability include maximum and minimum values of variables, kurtosis and skewness. Descriptive statistics also provides the error associated with results and interpretations in terms of graphical output.
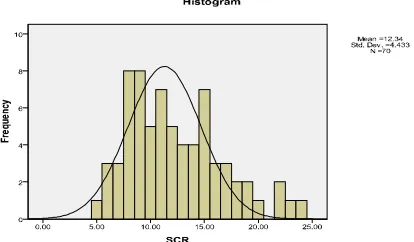
D. Frequency Distribution
The frequency distribution is drawn using histograms with normal distribution curves. The curve depicts the maximum and minimum data entry for various risk factors with calculated dispersion or standard deviation.
Α VALUES INTERNAL
CONSISTENCY
α ≥ 0.9 EXCELLENT
0.7 ≤ α < 0.9 GOOD
0.6 ≤ α < 0.7 ACCEPTABLE
0.5 ≤ α < 0.6 POOR
α < 0.5 UNACCEPTABLE
Risk
Cronbach’s alpha values
Internal Consistency
Project Approval Delay
0.723 Good
Time Over Run Risks
0.577 Poor
Cost Over Run Risks
0.776 Good
Site Condition Risks 0.879 Good
ISSN(Online): 2319-8753 ISSN (Print) : 2347-6710
I
nternational
J
ournal of
I
nnovative
R
esearch in
S
cience,
E
ngineering and
T
echnology
(A High Impact Factor, Monthly, Peer Reviewed Journal)
Vol. 5, Issue 2, Februray 2016
Figure 3. Histogram representation of frequency distribution of Project Approval Delay
Figure 4. Histogram representation of frequency distribution of Time Over Run Risks
Figure 5. Histogram representation of frequency distribution of Cost Over Run Risks
ISSN(Online): 2319-8753 ISSN (Print) : 2347-6710
I
nternational
J
ournal of
I
nnovative
R
esearch in
S
cience,
E
ngineering and
T
echnology
(A High Impact Factor, Monthly, Peer Reviewed Journal)
Vol. 5, Issue 2, Februray 2016
Figure 7. Histogram representation of frequency distribution of Safety Risks
E. Correlation Analysis
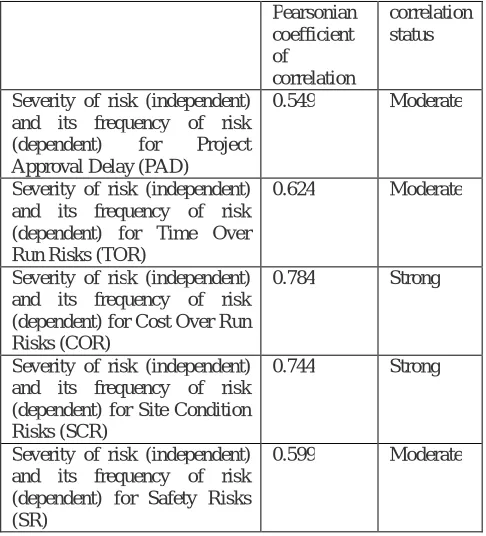
Correlation is a term that refers to the strength of a relationship between two variables. Two variables are said to be correlated if the change in independent variable is associated with corresponding change in dependent variable. A strong or high, correlation means that two or more variables have a strong relationship with each other while a weak, or low, correlation means that the variables are hardly related. Correlation coefficients can range from -1.00 to +1.00. The Pearsonian coefficient of correlation is used for measuring correlation and is denoted by the symbol ‘r’. r = Σ [(x - ͞x)* (y- ȳ)] / [n σxσy]
whereσx =Standard deviation of x series. σy = Standard deviation of y series and n = Number of pairs of observation. This is also known as product moment correlation coefficient.
Table 3: the relationship of independent and dependent variables.
Pearsonian coefficient of correlation
correlation status
Severity of risk (independent) and its frequency of risk
(dependent) for Project
Approval Delay (PAD)
0.549 Moderate
Severity of risk (independent) and its frequency of risk (dependent) for Time Over Run Risks (TOR)
0.624 Moderate
Severity of risk (independent) and its frequency of risk (dependent) for Cost Over Run Risks (COR)
0.784 Strong
Severity of risk (independent) and its frequency of risk (dependent) for Site Condition Risks (SCR)
0.744 Strong
Severity of risk (independent) and its frequency of risk (dependent) for Safety Risks (SR)
ISSN(Online): 2319-8753 ISSN (Print) : 2347-6710
I
nternational
J
ournal of
I
nnovative
R
esearch in
S
cience,
E
ngineering and
T
echnology
(A High Impact Factor, Monthly, Peer Reviewed Journal)
Vol. 5, Issue 2, Februray 2016
F. Regression Equations
Regression equations are the equations of the regression lines. Regression equation is a mathematical relation between the dependent and independent variables. There are two regression lines and therefore there are two regression equations.
(i) Regression equation of y on x.
(ii) Regression equation of x on y.
In this thesis, linear graphs were obtained with regression equation of y on x. Let y= a + bx be the equation of the regression line of y on x. To find the best value of aand b the method least squares is used.
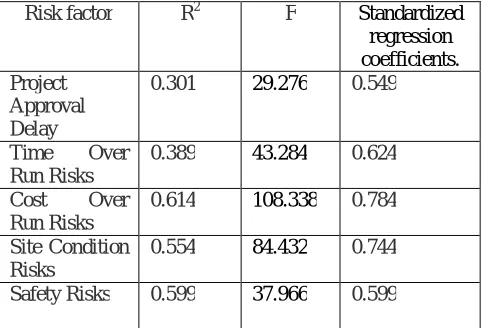
Table 4: The regression analysis using ANOVA calculation
Risk factor R2 F Standardized
regression coefficients. Project
Approval Delay
0.301 29.276 0.549
Time Over
Run Risks
0.389 43.284 0.624
Cost Over
Run Risks
0.614 108.338 0.784
Site Condition Risks
0.554 84.432 0.744
Safety Risks 0.599 37.966 0.599
From the above regression analysis, it can be concluded that, the impact value of dependent variable i.e. frequency of cost over run risk on severity of cost over run risk has got maximum value. It can be defined as for every one unit change in severity of COR, the frequency of COR tends to move 0.784 units. Hence the Cost Over Run Risks was selected as the critical risk. Keeping Cost Over Run Risks as the most critical risk among Project Approval Delay, Time Over Run Risks, Site Condition Risk and Safety Risks, the root causes of the occurrence of Cost Over Risk was found out through interviews and literature reviews. The probability of the base events was fixed based on the probability of occurrence.
VI. FAULT TREE ANALYSIS (Phase 3)
Fault tree analysis (FTA) is a top down, deductive failure analysis in which an undesired state of a system is analyzed using Boolean logic to combine a series of lower-level events. This analysis method is mainly used in the fields of safety engineering and reliability engineering to understand how systems can fail, to identify the best ways to reduce risk.
In this thesis through statistical analysis of the collected samples of data, regression checks for the 5 risk factors were obtained. From the results it was inferred that the maximum value of standardized coefficients was obtained for Cost Over Run Risks. Hence Cost Over Run Risk was chosen as the TOP event of the Fault Tree Construction.
The fault tree diagram was created using the software Fault Tree Creation and Analysis Program by keeping Cost Over Risk as the TOP event. The intermediate and base events were then connected using logic gates (AND & OR).The probability of the base events was assigned according to the proportion of times the base event would occur in a long run of repeated experiments. The overall risk value was divided among the sub events and the combination of failure of any sub event caused the failure of the system itself. Hence the value of the TOP event i.e. the probability of occurrence of the failure of TOP event was obtained as 1.
ISSN(Online): 2319-8753 ISSN (Print) : 2347-6710
I
nternational
J
ournal of
I
nnovative
R
esearch in
S
cience,
E
ngineering and
T
echnology
(A High Impact Factor, Monthly, Peer Reviewed Journal)
Vol. 5, Issue 2, Februray 2016
‘Design Variations’. Among them ‘Design Variations’ has higher probability of 0.7 which emphasis that it can cause a peak in risk of TOP event.
VII. CONCLUSION
This research study on “STUDY OF REGRESSION TECHNIQUES ON THE RISK MODELLING IN HIGHWAY PROJECTS USING FAULT TREE ANALYSIS & RECOMMENDATIONS FOR RECTIFICATION” has helped to collect relevant data about key risks in water bound macadam road construction through questionnaire survey. The data collected were reviewed and analyzed by various statistical methods. It identifies the key risk associated with project approval, time overrun, cost overrun, site condition and safety. The key risks identified can be minimized through proper risk mitigation strategies such as risk avoidance, risk transfer, risk acceptance, risk sharing, risk auditing and risk re assessment.
From the statistical analysis of SPSS, the reliability check was found satisfactory. A value of 0.949 was found ‘Excellent’ for the proceeding of the project. The next analysis was done for frequency distributions and descriptive statistics. The correlation analysis was found satisfactory and the correlation was found significant. Next the regression analysis was done to obtain the prediction models for the various risk factors based on dependent and independent variable. Among the five risk factors, Cost Over Run Risk has the maximum impact value of 0.784 AND hence chosen as the critical risk. The most critical path was obtained from the software and probability of the root cause which is the ‘design variation’ was found the reason for the system failure. This risk can be avoided through proper planning, scheduling, improving quality of the work, labour training and most importantly through avoiding variations in design of the project once it is commenced for execution.
REFERENCES
1. Ming-The Wang, Hui-Yu Chou (2003) “Risk Allocation and Risk Handling of Highway Projects in Taiwan” International Journal of Project Management 25 (2003) 485–493
2. Mohamed SayedBassiony Ahmed Abd El-karim, Omar AlyMosa El Nawawy, Ahmed Mohamed Abdel-alim (2015) “Identification and Assessment of Risk Factors Affecting Construction Projects”, HBRC Journal (2015)
3. Yanjun Zhao, Xiaojun Liu, Yan Zhao (2011) “Forecast for Construction Engineering Risk Based on Fuzzy Sets & System Theory” International Journal of Project Management 24 (2011) 349–357
4. Osama Ahmed Jannadi, Salman Almishari (2003) “Risk Assessment in Construction” International Journal of Project Management 25 (2003) 234-256
5. Sadi A. Assaf, Sadiq Al-Hejji (2006) “Causes of delay in large construction projects” Journal of Service Science and Management, 2006, 5, 151-159
6. HariharanSubramanyan, Priyadarshi H. Sawant, Vandana Bhatt (2012) “Construction Project Risk Assessment: Development of Model Based on Investigation of Opinion of Construction Project Experts from India” Journal of Civil Engineering and Architecture 9 (2012) 526-533
7. Dr. Patrick. X.W. Zou, Dr. Guomin Zhang, Professor Jia-Yuan Wang (2004) “Identifying Key Risks in Construction Projects: Life Cycle and Stakeholder Perspectives” International Journal of Science, Environment and Technology, Vol. 2, No 5, 2004, 1017 –1026
8. Anil Kumar Gupta, Dr. M.K. Trivedi, Dr. R. Kansal (2013) “Risk Variation Assessment of Indian Road PPP Projects” International Journal of Science, Environment and Technology, Vol. 2, No 5, 2013, 1017 –1026 36
9. Ana I. Irimia-Diégueza, Alvaro Sanchez-Cazorlaa, Rafaela Alfalla-Luquea (2014) “Risk Management in Megaprojects” Journal of Financial Risk Management 2014. Vol.1, No.3, 42-51
10. Aljassmi, H. and Han, S. (2013). “Analysis of Causes of Construction Defects Using Fault Trees and Risk Importance Measures.” Journal of Construction Engineering and Management ASCE, 139, 870-880.
11. Lee, W.S., et al (1985). “Fault Tree Analysis, Methods, and Applications - A Review.” IEEE transactions on reliability, 34,194-203.
12. Okmen, O. and Oztas, A. (2008). “Construction Project Network Evaluation with Correlated Schedule Risk Analysis Model.” Journal Of Construction Engineering And Management © ASCE, 134, 49-63.
13. Patel, K. (2013). “A Study on Risk Assessment and its Management in India.” Journal of Construction Engineering and Management ASCE, 64-67.
14. Purnus, A. and Bodea, C. (2013). “Considerations on Project Quantitative Risk Analysis.” Procedia - Social and Behavioral Sciences,74, 144 – 153
15. Subramanyan, H., Sawant, P. H. and Bhatt, V. (2012). “Construction Project Risk Assessment: Development of Model Based on Investigation of Opinion of Construction Project Experts from India.” Journal Of Construction Engineering And Management © ASCE, 138, 409-421.
16. Tiendung, L., et al (2009). ” Assessing Scope and Managing Risk in the Highway Project Development Process.” Journal of Construction