Walker, Teri Anne. Modification of polymer blend phase behavior with high-pressure carbon dioxide. (Under the direction of Richard J. Spontak and Saad A. Khan)
WITH HIGH-PRESSURE CARBON DIOXIDE
by
TERI ANNE WALKER
A dissertation submitted to the Graduate Faculty of North Carolina State University
in partial fulfillment of the requirements for the Degree of
Doctor of Philosophy
CHEMICAL ENGINEERING
Raleigh 2003
APPROVED BY:
DEDICATION
BIOGRAPHY
ACKNOWLEDGMENTS
Many people have helped to make this possible. I’m extremely grateful to my parents, Judy and William Walker, my sister Stacie Esslinger, my uncle Mike and aunt Sandra Walker, and the rest of my family for their love, support, encouragement, and humor. My friends have been invaluable, providing companionship, encouragement, humor and comfort and by just being great friends, especially Lara Chang, Elizabeth Wilder, Barbara Litwack, Sandra Cathcart, Coray Colina, Elizabeth Rowe, Marc Huber, Dave Terry, Nick Smith, Lora and Scott Davis, and Jenn Downey. And of course, Charlie and Maggie for their unconditional love.
TABLE OF CONTENTS
LIST OF TABLES... ix
LIST OF FIGURES ... x
CHAPTER ONE. THERMODYNAMIC AND KINETIC PROCESSES OF BICOMPONENT MACROMOLECULAR SYSTEMS IN THE PRESENCE OF PRESSURIZED CARBON DIOXIDE...1
Abstract ...1
1. Background ...2
1.1. Desing of multicomponent polymer systems ...2
1.2. Engineering with carbon dioxide ...5
2. Polymer blend and block-copolymer thermodynamics ...6
2.1. Neat blends ...6
2.2. Effect of solvents on phase behavior...10
2.3. Effect of pressure on phase behavior ...11
2.4. Blends with CO2...13
2.4.1. Phase behavior ...13
2.4.2. Amorphous/semi-crystalline blend morphology...18
3. Dynamic processes of polymer blend/CO2 systems ...21
3.1. Extrusion ...21
3.2. Foaming...25
3.3. Polymerizations in CO2-swollen polymers ...29
4. References...33
5. Tables...40
6. Figures...43
CHAPTER TWO. ENHANCED MISCIBILITY OF LOW-MOLECULAR-WEIGHT POLYSTYRENE/ POLYISOPRENE BLENDS IN SUPERCRITICAL CO2...53
Abstract ...53
1. Introduction...54
2. Experimental...55
3. Results and Discussion ...58
4. Conclusions...62
5. Acknowledgments...63
6. References...63
CHAPTER THREE. PHASE BEHAVIOR OF POLY(METHYL METHACRYLATE)/POLY(VINYLIDENE FLUORIDE) BLENDS IN THE PRESENCE
OF HIGH-PRESSURE CARBON DIOXIDE ...71
Abstract ...71
1. Introduction...72
2. Experimental ...75
3. Small-angle x-ray scattering considerations ...77
4. Results and Discussion ...80
4.1 Quasi-homogeneous systems ...80
4.2 Heterogeneous systems ...85
5. Conclusions...91
6. Acknowledgments...93
7. References...93
8. Tables ...99
9. Figures...101
CHAPTER FOUR. THE PHASE BEHAVIOR OF POLY(METHYL METHACRYLATE)/POLY(VINYLIDENE FLUORIDE) BLENDS WITH AND WITHOUT HIGH-PRESSURE CO2...116
Abstract ...116
1. Introduction...117
2. Experimental ...118
3. Results and Discussion ...120
4. Conclusions...126
5. Acknowledgments...126
6. References...127
7. Table ...130
8. Figures...131
CHAPTER FIVE. THERMODYNAMICS OF POLY(DIMETHYL SILOXANE)/POLY(ETHYLMETHYLSILOXANE) (PDMS/PEMS) BLENDS IN THE PRESENCE OF HIGH-PRESSURE CO2...135
Abstract ...135
1. Introduction...136
2. Theoretical Background...140
3. Experimental ...143
4. Results and Discussion ...145
5. Conclusions...151
6. Acknowledgments...152
7. References...152
8. Tables...155
CHAPTER SIX. CONCLUSIONS AND FUTURE WORK...166
1. Conclusions...166
2. Future Work ...169
LIST OF TABLES
Table 1.1. Summary of the direction and magnitude of phase boundary shift upon the addition of CO2 to various blends and block copolymers... 40
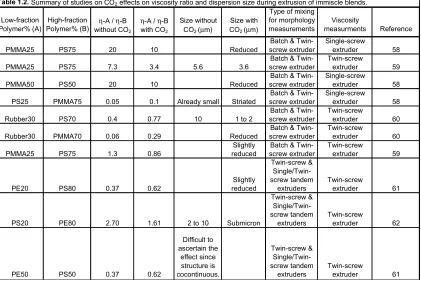
Table 1.2. Dispersion size and viscosity ratio of blends extruded with and without CO2.... 41
Table 1.3. Summary of the materials that have been prepared by polymerization in a CO2-swollen matrix... 42
Table 3.1. Properties of the pure polymers PVDF and PMMA ... 99
Table 3.2. Measured and predicted Tg,mix of the PVDF/PMMA blends before and after
exposure to CO2...100
Table 4.1. Values of the parameters necessary for the Hartmann-Haque semi-empirical equation of state ...130
Table 5.1. Pertinent thermodynamic data available for PDMS/PEMS blends...155
LIST OF FIGURES
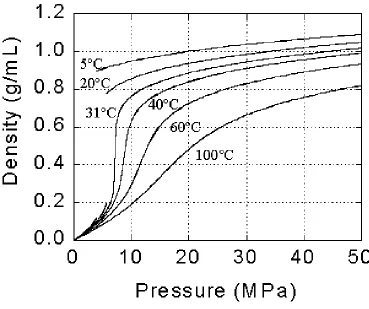
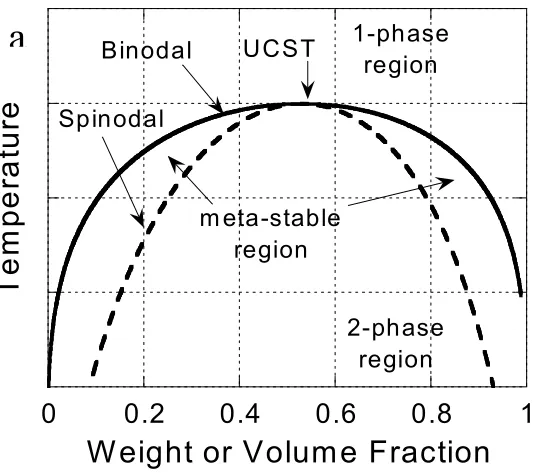
Figure 1.1. Density of CO2 as a function of pressure at several temperatures...43 Figure 1.2. Schematic of two potential phase diagrams for blends and block copolymers ....44 Figure 1.3. Conceptual diagram of the driving factors for blend and block copolymer phase behavior, and the effects CO2 can have on those factors...45 Figure 1.4. Change in cloud point temperature of a PDMS/PEMS blend as a function of CO2 pressure ...46
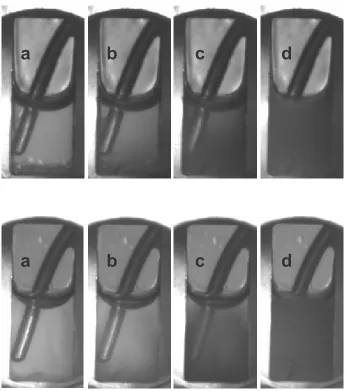
Figure 1.5. Flory-Huggins χ interaction parameter as a function of reciprocal temperature at several pressures for a PDMS/PEMS blend...47 Figure 1.6. TEM micrograph of the 31/69 PVDF/PMMA blend after exposure to CO2...48 Figure 1.7. Micrographs of PS/PMMA blends extruded with and without CO2...49 Figure 1.8. Micrographs of amorphous st-PMMA foam and semi-crystalline it-PMMA/st-PMMA foam blend ...50 Figure 1.9. Micrographs of the materials prepared by polymerizing styrene in a CO2-swollen HDPE matrix...51 Figure 1.10. Tensile strength of PS/HDPE blends as a function of PS content and preparation method...52
Figure 2.1. Predicted phase diagram for polystyrene/polyisoprene on the basis of the Flory-Huggins equation of state and measured χ(1/T) functionality...66
Figure 2.4. Dependence of ∆TCP on CO2 and N2 pressure for the PS/PI blend ...69 Figure 2.5. Variation of ∆TCP with CO2 pressure for the PS/PI blend...70
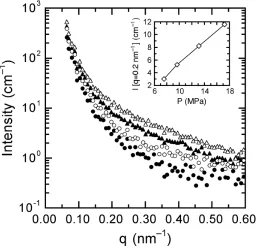
Figure 3.1. Small-angle x-ray scattering patterns collected from the 88/12 PMMA/PVDF blend at ambient pressure as well as four different CO2 pressures: 3.45, 4.83, 6.20 and 7.58 MPa...101 Figure 3.2. A series of energy-filtered TEM images of the 88/12 PMMA/PVDF blend prior to CO2 exposure ...102 Figure 3.3. SAXS patterns collected from the 69/31 PMMA/PVDF blend at ambient pressure and two different CO2 pressure: 3.59 MPa and 6.55 MPa...103 Figure 3.4. A zero-loss TEM image of the 69/31 PMMA/PVDF blend prior to exposure to CO2...104
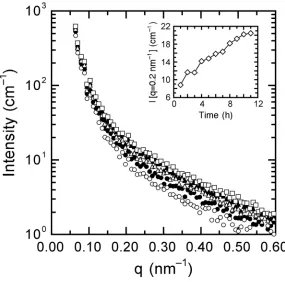
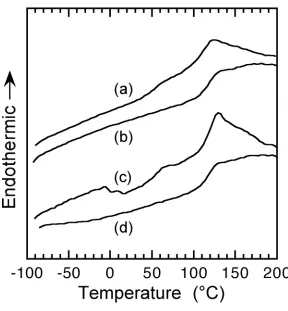
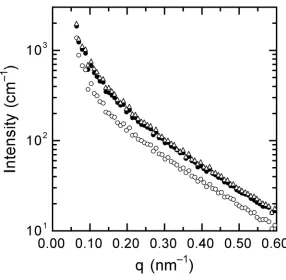
Figure 3.8. A series of energy-filtered TEM images of the 88/12 PMMA/PVDF blend after long-term exposure to high-pressure CO2...108 Figure 3.9. Differential scanning calorimetry (DSC) thermograms obtained from the neat PMMA (a) and PVDF (b, c) homopolymers employed in this study ...109 Figure 3.10. DSC traces collected from the 88/12 PMMA/PVDF blend after different treatments to heat and CO2...110 Figure 3.11. SAXS patterns collected from the 69/31 PMMA/PVDF blend after 2 h of exposure at each of three different supercritical CO2 pressures: 13.8, 24.1 and 31.0 MPa...111 Figure 3.12. Selected SAXS patterns collected from the 69/31 PMMA/PVDF blend after a jump from (a) 3.59 to 6.55 and (b) 6.55 to 13.8 MPa at three different exposure times: 1, 3 and 5 h. The inset in each figure shows the variation of I(q = 0.2 nm-1) with CO2 exposure time ...112 Figure 3.13. Low-magnification zero-loss TEM image of the 69/31 PMMA/PVDF blend after long-term exposure to high-pressure CO2...113 Figure 3.14. High-magnification zero-loss TEM image of the 69/31 PMMA/PVDF blend after long-term exposure to high-pressure CO2 confirming the existence of PVDF crystalline lamellae ...114 Figure 3.15. DSC traces collected from the 69/31 PMMA/PVDF blend after different treatments by heat and CO2...115
Figure 4.1a. SANS patterns acquired from the 55/45 d8-PMMA/PVDF blend at ambient
Figure 4.1b. The Flory-Huggins χ interaction parameter as a function of reciprocal temperature at ambient pressure and 13.8MPa CO2...131 Figure 4.2. An illustrative phase diagram of the d8-PMMA/PVDF blend at ambient pressure
conditions...132 Figure 4.3a. SANS profiles of the 55/45 d8-PMMA/PVDF blend in the solid state and at three CO2 pressures...133
Figure 4.3b. Dependence of the Flory-Huggins χ interaction parameter on carbon dioxide pressure ...133 Figure 4.4. Differential scanning calorimetry of the 55/45 d8-PMMA/PVDF blend before
and after exposure to CO2...134
Figure 5.1. GPC traces acquired from (a) PDMS and (b) PEMS before and after pretreatment in high-pressure CO2 at ~100ºC and ~34 MPa for 24 h...156 Figure 5.2. Representative turbidity measurements obtained from a 35/65 PDMS/PEMS blend in high-pressure carbon dioxide at (a) 3.86 and (b) 6.52 MPa by high-pressure spectrophotometry...157 Figure 5.3. Dependence of the PDMS/PEMS cloud point temperature (Tcp) on CO2 pressure
for a series of blends that are rich in (a) PEMS and (b) PDMS...158
Figure 5.4. Master curve of ∆Tcp = Tcp(P)−Tcp(P=0), as a function of CO2 pressure...159
Figure 5.5. Variation of (a) Tcp and (b) ∆Tcp with pressure from different sources for several
Figure 5.6. Comparison of the phase-equilibrium data reported by Kuwahara et al.18 and the regressed F-H equation of state used to extract χ(T)...161
Figure 5.7. Comparison of the experimental PDMS/PEMS phase diagram generated in this work in the absence of CO2 with predictions derived from the F-H equation of state using
several different χ(T) expressions18,22,23 of the form χ = A + B/T...162 Figure 5.8. PDMS/PEMS phase diagrams predicted at different CO2 pressures...163 Figure 5.9. Temperature dependence of χ provided as a function of CO2 pressure, as derived using the Flory-Huggins and Sanchez-Lacombe equations of state ...164
C
HAPTERO
NEThermodynamics and Kinetic Processes of Bicomponent Macromolecular
Systems in the Presence of Pressurized Carbon Dioxide
Teri A. Walker,1 Saad A. Khan1 and Richard J. Spontak1,2
Departments of Chemical Engineering1 and Materials Science & Engineering,2 North
Carolina State University, Raleigh, NC 27695
Abstract
phase behavior of various bicomponent polymer systems, especially physical blends and block copolymers, and we discuss several commercial processes and applications that may benefit from such modification.
1. Background
1.1 Design of multicomponent polymer systems. Many commercially relevant polymers are, in fact, multicomponent systems, containing secondary components that impart desirable or amending properties such as color (dyes), flame resistance, toughness, tensile and impact strength, reduced cost (fillers), reduced oxidizability (antioxidants), and improved processability (plasticizers and mold release agents). These auxiliary components exist in sizes ranging from small molecules measuring on the order of 1 nm, to macromolecules typically measuring between 10 and 100 nm, to inorganic particulates ranging widely in size
from ca. 10 nm to >10 µm. Adding one macromolecular species to another results in the production of bicomponent polymeric materials that can exhibit fundamentally and commercially interesting phase behavior, as well as form a wide variety of morphologies that are kinetically or thermodynamically stable. These bicomponent macromolecular systems can exhibit different levels of connectivity, and the two that are most important in the present work are physical mixtures (blends) and chemically-linked sequences (block copolymers).
being mixed at the molecular level. Miscibility in macromolecular systems can be determined experimentally by a variety of analytical methods, but most easily by measuring the thermal signature of the system: a miscible system will exhibit a single glass transition temperature (Tg) that lies between those of the pure components. Other analytical methods
routinely used to establish blend miscibility include turbidity, microscopy, scattering (light, x-ray, neutron), ultrasonic velocity, nuclear magnetic resonance and fluorescence. Immiscible blends commonly exist as micrometer-scale spheroidal or fibrous dispersions of one component within a matrix of the other. The characteristics of the blend morphology are sensitive to material considerations such as blend composition, interfacial tension and molecular weight, as well as to process history. Compatible but immiscible blends are commonly referred to as polymer alloys if one or more compatibilizing agents are present and the components cannot be physically separated after mixing. Most mixtures of polymers are immiscible, if not strongly incompatible, due to a combination of (i) the existence of long chains that effectively limit the entropy of mixing and (ii) the propensity for either athermal or endothermic mixing. Polymer blends are generally miscible if specific attractive interactions between dissimilar chains provide sufficient driving force for mutual dissolution of the constituent polymers.
(~AAAAAAAA-BBBB~BBBB-AAAAAAA~) designs. These chemically-coupled bicomponent copolymers behave similarly as their physically-mixed analogs (bicomponent blends). If the two species are miscible, they will form a single phase and remain homogeneous. If the two repeat units are thermodynamically immiscible, they will seek to phase-separate. Since the sequences in the copolymer are chemically linked, block copolymer molecules self-organize in much the same fashion as surfactant molecules to minimize interfacial area and energetically unfavorable contact between the A and B units. Depending on the molecular composition, architecture and polydispersity, as well as monomer asymmetry, self-organization (or microphase separation) of block copolymer molecules may result in the formation of mesoscopic structural elements that exhibit long-range order: A(B) spheres or cylinders in a B(A) matrix, bicontinuous channels or alternating lamellae. The primary difference between a phase-separated blend and a microphase-separated block copolymer is that the characteristic size of the copolymer domains is limited by the length of the blocks and typically measures on the order of 10-100 nm. In an immiscible or incompatible blend, structural elements are much larger, ranging in size from
100 nm to >10 µm.
blends relative to block copolymers include the following: (i) blends can be formulated faster and more inexpensively for application-specific properties (since there are usually no additional synthetic steps involved), and (ii) blend components can be separated much more easily and recycled. Some technologies require transparent media with a well-defined mesostructure and, thus, the use of block copolymers is warranted due to their ability to self-organize into very small and highly periodic domains upon microphase separation. Block copolymers can also be used as compatibilizing agents, i.e., macromolecular surfactants, to reduce the interfacial tension and increase interdomain adhesion in immiscible polymer blends.
1.2 Engineering with carbon dioxide. The use of carbon dioxide as a solvent or diluent in the preparation and processing of polymers has found extensive interest as evidenced in other reviews.2-7 The attractive qualities of carbon dioxide include its relatively low toxicity, tunable solvent properties (due to its high compressibility), and low critical point (Tc =
31.1ºC, Pc = 7.38MPa). The highly variable density of carbon dioxide as a function of
Carbon dioxide has been shown to affect several pure polymer properties. Since CO2 acts as a plasticizer, free volume and chain mobility increase in the presence of CO2 and thus viscosity and glass transition temperature are both reduced. Also, with increased mobility, the chains can more easily arrange themselves into crystalline structures so crystallinity can increase upon addition of CO2. Since adding CO2 increases polymer free volume, the effective surface tension of a polymer with absorbed CO2 decreases.
While the use of CO2 with polymer systems has been reviewed, a close examination of how CO2 affects parameters exclusive to multicomponent polymer systems is lacking and is the objective of this review, with special regard to polymer blends and block copolymer systems.
2. Polymer blend and block copolymer thermodynamics
2.1 Neat blends. Polymer blends and block copolymers possess a variety of possible T-φ
disorder-order temperature (UDOT). However, if phase mixing or disordering occurs upon cooling, the transition is labeled a lower critical solution temperature (LCST) or lower order-disorder temperature (LODT) for blends and block copolymers, respectively. An understanding of what causes each of these types of transitions in each blend system facilitates an understanding of how the presence of carbon dioxide could affect the phase behavior of a blend or block copolymer.
Many texts have explained the thermodynamics of polymer blends and block copolymers.1,9-13 As a background to the following discussions, we now offer a brief review of neat polymer blend and block copolymer thermodynamics.
The phase behavior of blends can be described, like other mixtures, by the Gibb's free
energy of mixing (∆Gmix), which is dependent on both the enthalpic (∆Hmix) and entropic
(∆Smix) changes on mixing, and is negative for favorable processes.
0
< ∆ − ∆ =
∆Gmix Hmix T Smix (1.1)
The coexistence curve and the limit of stability are two boundaries of the T-φ phase diagram
separating the miscible, metastable and immiscible regions. The coexistence curve (binodal)
is described by the equality of chemical potential of component i (µi) in the two phases
(indicated by ' and "):
" '
i i µ
µ = , (1.2)
0 , 2 2 = ∂ ∆ ∂ T P i mix G
φ (1.3)
where φi is the volume fraction of component i. The critical point, which is the intersection
of the spinodal and binodal curves, occurs when
0 , 3 3 = ∂ ∆ ∂ T P mix G
φ (1.4)
These three attributes are also indicated in Figure 1.2.
In general, mixing causes an increase in combinatorial entropy, which is a favorable
process (ie, reduces ∆Gmix). However, due to the long chain lengths of polymers (and thus
the extra restrictions on possible conformations), the entropy of mixing polymers is relatively small compared to that of small molecules and oligomers (very short-chained polymers). The enthalpy of mixing polymers can be either positive (endothermic mixing) or negative (exothermic mixing). Looking at the combined effects of the entropy and enthalpy changes
on ∆Gmix in Equation 1.1, one can see that exothermic mixing is always a favorable process
(both enthalpic and entropic changes increase the negativity of ∆Gmix), while endothermic
mixing is favorable only if the increase in entropy offsets the increase in enthalpy. Since entropy of mixing polymers is relatively small, favorable endothermic mixing is not very
common at low temperatures. As temperature increases, the magnitude of the T∆Smix term
increases, and in some cases is enough to overcome the positive ∆Hmix. This type of
There are at least two possible origins of LCST and LODT behavior. One case where LCST and LODT behavior occur is when exothermic mixing is due to specific interactions. When the thermal energy (temperature) of these systems becomes high enough upon heating, the specific interactions weaken, favoring phase separation. A second origin of LCST and LODT behavior is free volume effects (also known as compressibility effects or equation of state effects). At high enough temperatures, the volume change on mixing is negative, resulting in decreased entropy.13 As temperature increases, this negative entropy change on mixing becomes more dominant and eventually produces phase separation when exothermic mixing can no longer compensate.
The Flory-Huggins theory defines Gibb's free energy of mixing in polymer systems as follows: v N v N v kT
Gmix ln (1 )ln(1 ) (1 )
2 2 1 1 φ χφ φ φ φ φ + − − + − =
∆ (1.5)
where k is the Boltzmann constant, viis the repeat unit volume of component i, Ni is the
degree of polymerization of component i, χ is the interaction parameter, and v is a
reference volume. In its original form, this equation was understood as the sum of entropic contributions to the free energy change on mixing (the first two terms on the right hand side (RHS)) and enthalpic contributions to the free energy change on mixing (the third term on the RHS). In this case, χ =B/T, where B is a constant dependent on the energy change of
contact formation between the two polymer components.
architecture, specific interactions and compressibility/free volume. In order to account for the added complexities, the interaction parameter χcan be understood as an empirical parameter
dependent on chain length and composition, in addition to temperature. In this treatment, the third term in the Flory-Huggins equation (Equation 1.5) contains both enthalpic as well as non-combinatorial entropic contributions (also known as equation of state effects). A more explicit accounting of these effects appears in various equation of state theories that have been developed.14
These theoretical treatments do not account for the possibility of polymer crystallinity. In blends that contain a semi-crystalline component, the amorphous regions of the polymers may still be miscible and may be situated between the crystalline lamellae, and within or without crystalline spherulites, if present.
The thermodynamics of a block copolymer are similar to those of blends except that in block copolymers there is an additional spatial constraint, the chemical link between the dissimilar chains. This bond links the dissimilar chains together so that they can phase separate only on a small scale, and the maximum domain width would be equal to twice the length of each block.
will not consider systems where polymers dissolve in CO2, but rather systems where the solvent (CO2) is the minor component dissolved in the polymer-rich phase(s).
The presence of solvent in a polymer blend or block copolymer system can have a pronounced effect on polymer-polymer phase behavior.15-19 The solvent molecules screen both attractive and repulsive interactions occurring between all the pairs A-A, B-B, and A-B. The overall effect of the solvent also depends on the interactions between the polymer chains and the solvent itself. If the solvent-polymer interactions are sufficiently unfavorable, normally immiscible polymer pairs have been known to phase mix. Or, if the solvent-polymer interactions are sufficiently favorable compared to solvent-polymer-solvent-polymer interactions, normally miscible polymer pairs can phase separate upon solvent addition. The effects of CO2 as a solvent are more complex than typical organic solvents since CO2 is a pressurized fluid, has a high compressibility and has tunable solvent properties.
2.3 Effect of pressure on phase behavior. The effect of hydrostatic pressure on bicomponent polymer system phase behavior can be divided into two categories, based on whether the system exhibits upper or lower critical temperature behavior. In LCST/LODT systems, the location of the phase boundary as a function of hydrostatic pressure is generally defined by the following relationship:
0 > ∆ ∆ = ∆ ∆ mix mix H V T P LCST φ (1.6)
pressure. Experiments and theoretical models have supported this theory.20-25 Conceptually, the pressure “squeezes” the phases together, which counteracts temperature weakening of specific interactions (if present) or helps to temper the compressibility effect responsible for LCST in the absence of specific interactions. While many experiments support this generalized behavior, some theoretical calculations have shown that when pure component thermal pressure coefficients are significantly different, the LCST can first decrease, then increase as pressure increases.26 Some experimental evidence supports this theoretical prediction of abnormal behavior.27
The same general equation is true in UCST/UODT systems, but the difference lies in
the fact that the sign of ∆Vmix can be positive or negative:24
mix mix H V T P UCST ∆ ∆ = ∆ ∆ φ (1.7)
Since UCST/UDOT systems arise from endothermic mixing, so that ∆Hmix is positive,
systems with a negative ∆Vmix will exhibit a negative shift of the critical temperature upon
pressurization, while systems with a positive ∆Vmix will exhibit a positive shift of the critical
2.4 Blends with CO2
2.4.1 Phase behavior. The driving factors behind the phase behavior of blends and block copolymers determine how an incompressible or compressible solvent will affect the phase
behavior. As mentioned earlier, UCST/UDOT is typically driven by a positive ∆Hmix
(endothermic mixing), whereas LCST/LODT is typically driven by weakening of specific interactions at high temperature or free volume effects at high temperature. Figure 1.3 shows a representation of the factors that control the thermodynamic behavior of polymer blends: enthalpic, combinatorial entropic and non-combinatorial entropic factors. The balance of these three factors determines the existence and location of UCST/UODT and/or LCST/LDOT phase boundaries. The presence of CO2 affects the individual polymer chains and the bulk properties of each component, as well as the interactions between the chains (A-A, B-B and A-B), which will in turn affect the enthalpic and entropic contributions and result in changes to the location, or possibly existence, of UCST/UDOT and LCST/LODT phase boundaries.
These various effects of CO2 on the polymer properties and the multicomponent system phase behavior have been examined experimentally. Table 1.1 summarizes the direction and magnitude of phase boundary shift upon CO2 absorption for a variety of systems that have been studied to date. The first system, polystyrene with polyisoprene, is represented both as an oligomeric blend29 and a polymeric block copolymer.35 Adding CO2 to both of these systems increased their miscibility. The UCST of the PS/PI blend was reduced
reversed directions as pressure was increased beyond a limiting value (about 20MPa). At about 35MPa, which was the maximum pressure studied for the PS/PI blend, the cloud point temperatures had returned to approximately the same values measured at ambient pressure. This trend was explained as a result of the competing effects of CO2 plasticization, which promoted miscibility, and hydrostatic pressure, which promoted phase separation. This competition can be understood qualitatively as follows: the presence of CO2 screens the repulsive interactions, allowing the differing chains to intermingle more freely, while the hydrostatic pressure tends to squeeze the molecules together forcing unfavorable contacts that induce demixing. The enhanced miscibility of the PS-PI block copolymer was also the result of screening unfavorable interactions. Reduced miscibility of the PS-PI block copolymer caused by “squeezing” of the hydrostatic pressure did not occur up to the maximum pressure studied for this system (11.7MPa), which was perhaps not high enough for the hydrostatic pressure effect to overcome the screening effect.
Another UCST blend, poly(dimethylsiloxane) (PDMS)/poly(ethyl methylsiloxane) (PEMS), exhibited the opposite behavior upon the addition of CO2: reduced miscibility.36 Increasing CO2 pressure from ambient to near 35MPa resulted in an approximately linear
increase of the UCST, with a slope of ( ) ≈+2.9
∆ ∆
P UCST
°C/MPa. Figure 1.4 shows the
change in cloud point temperature, Tcloud(P)-Tcloud(P = 0), as a function of pressure for all
compositions studied. Beiner et al. have studied of the effects of hydrostatic pressure alone
UCST are typically defined by Equation 1.7. For this UCST blend, which exhibits
0
>
∆Hmix (endothermic mixing) and∆Vmix <0, the UCST will shift to lower temperatures
upon hydrostatic pressurization. Conversely, upon swelling by pressurized CO2, the close contacts that are favored for this blend in the mixed state (as evidenced by the negative
mix
V
∆ ) are hindered by the significant increase in free volume caused by the CO2, and the
UCST shifts to higher temperatures. Values of χ were predicted using the Sanchez-Lacombe equation of state (Figure 1.5) for this blend at ambient pressure and in the presence of CO2.36 While at ambient pressure, this blend exhibits a linear dependence of χ on reciprocal
temperature, a complex temperature dependency is observed in the presence of CO2. At low temperatures (typically less than ~80ºC), a non-linear signature becomes evident and then more pronounced as CO2 pressure increases. This predicted behavior is interpreted to indicate that the solvent effect of high-pressure CO2 on polymer blend thermodynamics becomes amplified as the critical temperature of CO2 (~31°C) is approached and the density of CO2 increases.
the disparity in free-volume of the two components as CO2 sorption increased, since the CO2 absorbs preferentially into the PVME. They also found that screening of the favorable interactions between the two components was a factor in depressing the LCST, but not as significant as the free-volume effect. Previous studies20,23 indicate that hydrostatic pressure has a relatively negligible effect on the LCST of this blend, shifting it to higher temperatures
at a rate of only 0.12-0.25°C/MPa. But based on the experiments with the CO2/PS/PVME
system, the CO2-induced free-volume effect and the screening of interactions were much stronger, bringing the LCST to drastically lower temperatures.
The LODT of the block copolymer poly(deuterated styrene-b-n-butyl methacrylate) (PdS-PnBMA) was also shown to shift to lower tempreatures upon CO2 sorption.38 For the lower molecular weight sample, adding CO2 at 0.3g/cc (14MPa at 100°C) reduced the LODT
by 250°C from its projected value in the absence of pressurized CO2 (the actual ambient LODT of this material was above the degradation temperature of the polymer, and therefore
inaccessible). For the higher molecular weight sample, the LODT was reduced by 35°C by
adding CO2 at 0.05g/cc (3.75MPa at 145ºC). The LODT of this block copolymer is driven mainly by free volume entropic effects. In this system, CO2 sorbs preferentially into the PnBMA block, so that there is a disparity in the change in free volume between the blocks as more CO2 is absorbed, exacerbating the free volume effects and lowering the LODT. The effects of hydrostatic pressure on this copolymer's phase behavior has been found to increase
the LDOT ( ( ) =1.45
∆ ∆
P LDOT
CO2-induced free-volume effects on the PdS-PnBMA copolymer are much larger and opposite to the effects of hydrostatic pressure.
We have performed preliminary studies of the PVDF/PEMA phase behavior with and without CO2. While the LCST was not measurable at ambient pressures in the temperature range of our equipment (T<230ºC), in the presence of CO2 at about 9.5 MPa, we found that the LCST was depressed to 217ºC. The phase separation took place over a relatively large temperature range (~20ºC), but was completely reversible upon cooling, indicating that the observed cloudiness resulted from phase separation and not degradation of the PEMA. The LCST in this blend is driven by specific interactions rather than free volume effects. Thus, CO2-induced phase separation is likely caused dominantly by screening of the favorable interactions.
compressible diluents exacerbated the free volume effects, inducing phase separation at lower temperatures. For the largest alkane (liquid tetradecane), which is relatively incompressible, the LODT was shifted to higher temperatures.
2.4.2 Amorphous/semi-crystalline blend morphology. Carbon dioxide has been shown to induce crystallization in a number of single polymer systems, just as sorption of other vapors and liquids can do.41-44 The absorbed molecules act as plasticizers, which increase the mobility of polymeric chains allowing them to align in a more favorable orientation. Crystallization can also be induced by CO2 in a blend system that contains at least one semi-crystalline component. PVDF in a PVDF/PMMA blend was shown to crystallize upon addition of CO2.45 This process is slightly more complex than crystallization in a neat semi-crystalline polymer, since the presence of the PMMA effectively de-plasticizes the PVDF and prevents crystallization in the neat blend if PMMA content is greater than about 60%. The extent of CO2-induced crystallization was found to depend upon the concentration of the PMMA. At low PMMA content, CO2-induced crystallization was not much greater than that induced in the neat PVDF. The CO2-induced crystallization was greatest at intermediate PMMA contents, and then went to zero as the PMMA content rose above about 70%. At higher PMMA concentrations, the blend Tg is higher than the CO2-exposure temperature
even in the presence of CO2 so that the mobility of the molecules is still restricted to prevent crystallization of the PVDF.46 Even at moderate-high PMMA content, when the CO2-exposure temperature is slightly above the CO2-reduced Tg of the blend, the viscous nature of
amount of PVDF crystallization occurs. The relatively small CO2-induced crystallization at low PMMA content is likely due to PVDF already being near its maximum extent of crystallization. The crystals formed upon CO2 sorption were found to be smaller than typical PVDF crystals due to growth under restricted motion (because of the presence of the high Tg
PMMA), as evidence by the lower than usual melting peak temperature, ranging from just above the Tg to just below the normal PVDF melting peak. It was also found that the
pressure jumps in situ. These results were consistent with the formation of lamellae, and indicated that the changes in crystallinity were dependent upon the pressure of CO2, and thus the extent of plasticization of the blend. Similar results were observed for the pressure dependence of the SANS patterns of PVDF/dPMMA blends with CO2 at ambient temperature (~25ºC).48
The morphological structure of crystals in a poly(ethylene oxide) (PEO) (semi-crystalline)/poly(vinyl acetate) (PVAc) (amorphous) blend was studied by SAXS as a function of blend composition before and after CO2 exposure at 5000psi and 32ºC.49 It was found that amorphous PEO situated in the interlamellar region was swollen by the CO2 (from 6 nm thick before CO2 to 12 nm after CO2), and that the lamellae size increased significantly upon CO2 sorption (from 31.6-31.8 nm before CO2 to 43.5-49.1 nm after CO2, depending on blend composition). It was also found that the lamellae became less organized with a broader size distribution upon CO2 sorption. Similar results were observed in a PEO/PMMA blend studied by the same methods.50 The amorphous interlamellar regions were swollen (from around 9 nm thick before CO2 to around 14nm after CO2, less swelling at higher PMMA content), and the crystalline regions also grew (from around 30-31 nm before CO2 to around 47 nm after CO2, there was no growth at higher PMMA content of 50%). Just as for the PEO/PVAc blend, the lamellae became less organized with a broader size distribution after CO2 treatment, except for the 50wt%PMMA blend whose lamellae remained unchanged.
stereocomplex were found to increase with increasing CO2 pressure from ambient air pressure to 10 MPa. Just as in other CO2-induced crystallizations, the CO2 plasticizes the polymer chains so that they are more mobile and can move into the more favorable crystalline structure. Increasing pressure further resulted a furthing increasing of the heat of melting at the treatment temperatures studied, but the increase was relatively small. In highly stereoregular samples, it was found that both fringed micelle and lamellar crystal structures were produced if it-PMMA content was at least 50%. The Tm of the lamellar crystal
structures was not a function of CO2 treatment pressure, while the Tm of the fringed micelle
structures increased as CO2 treatment pressure increased.
3. Dynamic Processes of Polymer Blend/CO2 Systems
3.1 Extrusion. The production of commercial blends is accomplished most frequently by mechanical mixing, preferably in a twin-screw extruder, which while expensive offers the best control options (T, P, residence time) and uniform mixing. During this processing, the components are heated and mixed under shear and elongational stresses. For immiscible blends, the goal of the mixing is to distribute the disperse phase evenly and to produce dispersions of the desired size and morphology (ie, spheres, rods…). Important to this process is the breakup of large droplets into smaller sizes. This droplet breakup occurs when the viscous forces of mixing overpower the force of surface tension, and for a Newtonian drop in a Newtonian matrix depends on two dimensionless parameters, the viscosity ratio
(η1/η2) and the capillary number (Ca η2γ d/ν •
phase, γ• is the shear rate, d is the diameter of the undeformed drop and ν is the interfacial
tension.54 If the system parameters reach or surpass the critical capillary number, Cacrit,
droplet breakup will occur. This Cacrit is a function of the viscosity ratio, and is minimized
near a viscosity ratio of one.10
The addition of carbon dioxide into the immiscible blend during melt extrusion will reduce the viscosity and surface tension of the polymer,55-57 and thus has the potential to change both the viscosity ratio as well as the capillary number. The overall effect of reduced viscosity on the viscosity ratio will depend on how much CO2 reduces the viscosity of the individual components; if the viscosity of the higher-viscosity material is reduced more than that of the lower-viscosity material, the ratio will approach a value of one. Addition of CO2 affects the capillary number in two ways: reducing the viscosity of the matrix phase (reducing the capillary number) and reducing the surface tension (increasing the capillary number). If the effect of CO2 on the surface tension is greater than that on the matrix viscosity, the capillary number could potentially be increased enough to surpass the critical capillary number, resulting in improved droplet breakup.
as the PMMA dispersion sizes. In the second study by this group, 59 addition of CO2 to a blend with a viscosity ratio of 7.3 reduced the viscosity ratio to 3.4 and also reduced the dispersion size during both batch and continuous mixing processes. The micrographs in Figure 1.7 show the reduced dispersion size for this blend after processing with and without CO2 for the 25/75 PMMA/PS ratio. The slightly smaller dispersions that were seen in the 75/25 PMMA/PS sample were unexpected based on the viscosity of the two phases; the matrix phase had the smaller viscosity so was not expected to easily transfer stress to the higher-viscosity dispersed PS. Interfacial tension effects upon adding CO2 were suggested as the cause of this unexpected behavior. Addition of CO2 was also studied in blends of PS with rubber (an ethylene-methacrylate copolymer) and PMMA with rubber.60 A reduction in viscosity ratio again resulted in reduced dispersion sizes. The rubber phase diameter in a PS matrix was reduced to 1-2 microns from about 10 microns, and that in a PMMA matrix was also reduced, but could not be explicitly measured due to ill-defined phase boundaries. While the effect of CO2 on the surface tension of the polymers in these studies was not measured or quantified, the authors believe that surface tension effects could also play a role in the reduced dispersion sizes they observed, which is reasonable considering the role of the capillary number on dispersion breakup discussed above, and points to the merit of further study of CO2 effects on the surface tension, viscosities, capillary number and their relationship to the resulting dispersion size.
blend systems, it was found that addition of CO2 to this PS/PE blend resulted in smaller dispersion sizes (significant size reduction when PS was dispersed phase, only a slight reduction in size when PE was dispersed phase), and the size could be reduced further by increasing the CO2 content.61,62
Viscosity ratio and surface tension also help to define the blend composition where phase inversion occurs, another parameter of importance when designing blends and mixing schemes. The morphological structure of a 50/50 PMMA/PS blend possessed a consistent co-continuous structure when prepared without CO2.59 However, when CO2 was used during extrusion, the morphology became inconsistent, with some finely dispersed PS regions as well as some co-continuous regions. This suggests that adding CO2 can change the phase inversion composition.
The dynamic phase inversion that occurs during extrusion is also dependent on viscosity ratio and interfacial tension, as well as on melting and glass transition temperatures and processing conditions such as temperature, residence time, mixing time, and extruder length.60 The steps associated with this dynamic phase inversion are studied by Elkovitch et al.60 for the PS/rubber and PMMA/rubber systems with and without CO2. The use of CO2 reduced the extruder length required for phase inversion by about L/D = four.
While CO2 can effectively reduce the domain size of the dispersed phase, coalescence of these phases occur if these blends are further mixed in the absence of CO2 at high temperatures in both a batch mixer59 and an extruder.59,61 In the batch mixer operated at 200°C, the 25/75 PMMA/PS blend that had originally achieved a dispersion diameter of 2.6
after 15, 30, 60, and 120 minutes of mixing after the CO2 was vented, respectively. During extrusion of the 25/75 wt ratio PMMA/PS blend with venting near the end of the extruder, the dispersed phases coarsen to 2.1 microns despite the short time of mixing after CO2 venting. For comparison, dispersion diameters were 1.1 microns when CO2 was used but not vented, and 2.6 microns when CO2 was not used at all. Coarsening also occurred in the PE/PS blend after venting CO2 near the end of the extruder, despite minimized mixing in the post-ventilation section of the extruder.61 Coarsening is a common problem in blending, and can be minimized by stabilizing the interface. Block or graft copolymers (as premade fillers or formed by in situ reactive coupling) can stabilize blend interfaces but can be expensive. So another method59 was examined to stabilize the PMMA/PS blend, namely adding the following fillers: calcium carbonate, carbon black, and nano-clay particles. These fillers used during CO2-assisted extrusion were all found to reduce the PMMA domain size compared to CO2-assisted extrusion without the fillers.
be either close-celled where the empty spaces are completely surrounded by polymer material, or open-celled where the empty spaces intersect to form a co-continuous polymer/pore structure.
Carbon dioxide has been used successfully as a foaming agent in both batch and continuous processes for a variety of polymer systems, such as single polymer component systems,57,65 blends,63,66-70 and polymers with fillers.71 Use of CO2 as a foaming agent is preferable due to its ability to generate smaller cell diameters and larger cell density. Other advantages include the fact that it is more environmentally friendly than traditional foaming agents such as VOCs, CFCs and HCFCs, and doesn’t leave any toxic or harmful residue to be removed.
More than one method exist to produce porous polymers using CO2,72 but the method57 of interest here is that where the CO2 is dissolved in the polymer, and then the polymer/CO2 mixture is subjected to a thermodynamic instability, such as a pressure quench, that induces phase separation. The separated CO2 forms millions of small bubbles that grow as more CO2 diffuses from the polymer phase into the CO2 phase. This is a nucleation and growth type of mechanism, and can occur in batch-type pressure vessels as well as continuously in extruders. If the concentration of the CO2 in the polymer is high enough, it is possible to obtain open pores. The critical CO2 concentration has been found to be 50 +/- 3 cm3 CO2 (STP)/cm3 polymer for poly(ether sulfone), poly(ether imide), polyimide, polysulfone, and blends of the latter two.68,70
ability to improve the foaming efficiency of the system, resulting in smaller cell diameters, larger cell densities, and generally improved performance of the final part (such as mechanical and thermal properties). However, the additional components can also be detrimental to the formation of pores or the formation of a useful end product. One example of this is in semicrystalline polymers, where the additional “component” is the crystal phase. Foaming of semicrystalline polymers has been found to be much more difficult to control than foaming of amorphous polymers since the crystalline regions do not absorb a significant amount of CO2.73 Two critical factors that appear to affect whether a semicrystalline polymer can be foamed or not are the size of the crystalline phases and the crystalline structure. Two studies have shown that by blending the semicrystalline polymer with a second homopolymer, the crystalline phase can either be eliminated63 or the crystalline fraction reduced,63,66 and as a result, previously unfoamable polymers became foamable. In the first paper63 the semicrystalline polymer PVDF was blended with PMMA to form a miscible blend near the melting temperature. The PMMA increases the solubility of CO2 in the PVDF, which increases the number density of bubble nucleation sites and thus cell uniformity. The presence of PMMA also serves to increase the Tg of the system so that cell growth can be
controlled (and cell coalescence can be prevented). The third advantage of the PMMA is that its presence greatly reduces or eliminates PVDF crystallinity so that processing can occur at lower temperatures closer to the Tg of the system without the presence of large impeding
possible. Furthermore, it was found that dilution of one of the polymers with small amounts of the other was more favorable to foaming than mixtures near a 50/50 composition.
In some systems, carbon dioxide induces crystallization that aids in the subsequent foaming process. For example, dissolving CO2 into a blend of it-PMMA/st-PMMA, crystalline stereocomplex structures were formed, as fringed micellar structures.51 These crystalline structures aided the subsequent foaming of the material by providing small surfaces on which heterogeneous nucleation could occur and also increased the stiffness of the amorphous matrix so that cell growth was limited and the final cell size was smaller. The resulting smaller and more dense cells are shown in Figure 1.8. Cell size was reduced from 1.76 microns to 0.26 microns, and cell density was increased from 9.5x10¹⁰ cells/cm3 to 2.1x10¹³ cells/cm3.
Adding a second blend component to improve foaming was not as successful in some systems and resulted in nonuniform or nonexistent cell structure. When PS was added to PVDF,63 the resulting foam structure was nonuniform. In this case, unlike the PVDF/PMMA system described above, the PS and PVDF are not miscible, thus the crystallinity of the PVDF was not eliminated in the PS/PVDF system like it was in the PMMA/PVDF system. Immiscible blends of semicrystalline PE and amorphous PS did not result in very uniform films either.62 In an poly(tetrafluoroethylene-co-hexafluoropropylene) (FEP)/PS blend foaming was unsuccessful.74 At lower temperatures where PS is typically foamed, the presence of the FEP crystallites prevented expansion, while at higher temperatures (above the
3.3. Polymerizations in CO2-swollen polymers. Carbon dioxide has been used as a solvent
and penetration aid for the polymerization of monomer A in the matrix of polymer B to form blend materials of the two polymers. The general procedure is to dissolve monomer A and the initiator in CO2, then expose this solution to the substrate polymer B. In this second soaking step CO2 swells the polymer substrate and aids in the diffusion of the monomer and initiator into the substrate matrix. The last step is to increase the temperature of the system, which initiates polymerization of monomer A within the polymer B substrate. CO2 is an attractive choice for this application for several reasons, such as its ability to increase the diffusion rates of penetrants in polymers, its solvent strength is adjustable by changes in temperature and pressure which allows the control of the degree of swelling of the substrate and control of the partitioning of the monomer/initiator between the fluid phase and the polymer matrix, its easy removal from the polymer system by simple depressurization (CO2 is a gas at atmospheric pressures). This procedure has been reviewed previously in 2000,3 but a number of papers have appeared since then. A summary of the materials that have been studied are presented in Table 1.3.
pointed out, namely that the blending procedure can be performed at much lower temperatures compared to conventional blending methods such as extrusion.76 This lower temperature requirement could be useful for blend systems where one or more of the components is degradable at temperatures below or near required extrusion temperatures. Several studies have shown that like conventional blending, this blending procedure results in improved performance of the product and even better performance than conventionally prepared blends, such as higher modulus,77-79 tensile strengths,77-79 impact strength,80 increased conductivity,81,82 increased thermal stability,82 and improved cohesive strength of surface.83 This method can also be used to produce blends of hydrophilic (PVC) and water soluble (poly(methacrylic acid)) materials that are not accessible by conventional blending techniques.84
performed rather than homopolymerization of one polymer within the matrix of the second,87 and 8) impregnation of monomer into the substrate using CO2, followed by CO2 removal and subsequent exposure to aqueous oxidant to polymerize the monomer.81,82 Also, a variety of soak and reaction conditions have been examined: time, temperature, pressure, concentration of monomer and initiator.
It has been found by several groups that the blend composition can be controlled by controlling processing parameters such as soak and reaction times, pressures and temperatures, and concentrations of monomer and initiator.74,76,78,80,87 Furthermore, the blend composition is not limited by the solubility of the monomer in the fluid or matrix phase, as a small extent of polymerization occurred during the soaking period, allowing more than the equilibrium amount of monomer to penetrate into the polymer substrate.76,77,80,85,86
properties of the CO2-prepared blends compared to conventionally prepared blends, shown in Figure 1.10. DSC experiments on a PCTFE/PS blend have shown that the blend is composed of at least two immiscible phases amorphous PS and crystalline PCTFE86 (the Tg of the PS
amorphous phase was approximately equal to that of pure PS, so its unlikely that any amorphous PCTFE is mixed homogeneously with the PS), and AFM experiments on a PMMA/UHMWPE blend showed evidence of the three phases amorphous PMMA, amorphous UHMWPE and crystalline UHMWPE.88 The phases of the newly polymerized material within the matrix were found to be evenly distributed throughout the matrix and were on the order of 10-100nm for the PMMA/UHMWPE system,88 <200nm for the PVC/PMAA system,84 and 10-300nm for the PS/SR and PP/PS systems.78,79 Phase size was found to increase with increasing content.78,79,86
throughout the bulk of the FEP matrix and not just at the surface. However, the PECA/FEP substrate did exhibit improved cohesive strength of the surface.
4. References
1. L.A. Utracki, Oxford University Press New York, 1990.
2. Y.B. Melnichenko, G.D. Wignall, D. Schwahn, Physical Review E 2002, 65. 3. A.I. Cooper, Journal of Materials Chemistry 2000, 10, 207.
4. B. Bungert, G. Sadowski, W. Arlt, Industrial and Engineering Chemistry Research
1998, 37, 3208.
5. A.I. Cooper, Advanced Materials 2001, 13, 1111.
6. C.F. Kirby, M.A. McHugh, Chemical Reviews 1999, 99, 565.
7. J.L. Young, J.M. DeSimone, Pure and Applied Chemistry 2000, 72, 1357.
8. E.W. Lemmon, M.O. McLinden and D.G. Friend, "Thermophysical Properties of Fluid Systems" in NIST Chemistry WebBook, NIST Standard Reference Database Number 69, Eds. P.J. Linstrom and W.G. Mallard, March 2003, National Institute of Standards and Technology, Gaithersburg MD, 20899 (http://webbook.nist.gov).
9. D.R. Paul (Ed), S. Newman (Ed), Academic Press, New York, 1978. 10. D.R. Paul (Ed), C.B. Bucknall (Ed), John Wiley & Sons, Inc., 2000. 11. J.E. Mark (Ed), AIP Press, Woodbury, N.Y., 1996.
13. I.C. Sanchez; In Encyclopedia of Physical Science and Technology V. 11; R.A. Meyers, Ed.; Academic Press, San Diego, 1992.
14. P.A. Rodgers, Journal of Applied Polymer Science 1993, 48, 1061. 15. L. Zeman, D. Patterson, Macromolecules 1972, 5, 513.
16. A. Robard, D. Patterson, G. Delmas, Macromolecules 1977, 10, 706.
17. E.M. Woo, J.W. Barlow, D.R. Paul, J. Polym. Sci.: Polym. Symp. 1984, 71, 137. 18. A.K. Nishimoto, B.M. Mandal, S.N. Bhattacharyya, Macromolecules 1985, 18,1454. 19. M. Nishimoto, H. Keskkula, D.R. Paul, Polymer 1991, 32, 272.
20. B. Hammouda, B.J. Bauer, Macromolecules 1995, 28, 4505.
21. M. Pollard, T.P. Russel, A.V. Ruzette, A.M. Mayes, Y. Gallot, Macromolecules 1998,
31, 6493.
22. D.A. Hajduk, P. Urayama, S.M. Gruner, S. Erramilli, R.A. Register, K. Brister, L.J. Fetters, Macromolecules 1995, 28, 7148.
23. S. Janssen, D. Schwahn, K. Mortensen, T. Springer, Macromolecules 1993, 26, 5587. 24. D.J. Walsh, S. Rostami, Macromolecules 1985, 18, 216.
25. J. Dudowicz, K.F. Freed, Macromolecules 1995, 28, 6625. 26. L.P. McMaster, Macromolecules, 1973, 6, 760.
27. Y. Suzuki, Y. Miyamoto, H. Maiyaji, K. Asai, Journal of Polymer Science, Polymer Letters Ed. 1982, 20, 563.
28. J.E.G. Lipson, M. Tambasco, K.A. Willets, J.S. Higgins, Macromolecules 2003.
30. D. Schwahn, T. Schmackers, K. Mortensen, Physical Review E 1995, 52, R1288. 31. B. Hammouda, N.P. Balsara, A.A. Lefebvre, Macromolecules 1997, 30, 5572.
32. M. Beiner, G. Fytas, G. Meier, S. Kumar, Journal of Chemical Physics 2002, 116, 1185. 33. D. Schwahn, H. Frielinghaus, K. Mortensen, K. Almdal, Physical Review Letters 1996,
77, 3153.
34. D. Schwahn, H. Frielinghaus, K. Mortensen, K. Almdal, Macromolecules 2001, 34, 1694. 35. B.D. Vogt, G.D. Brown, V.S. RamachandraRao, J.J. Watkins, Macromolecules 1999,
32, 7907.
36. T.A. Walker, C.M. Colina, K.E. Gubbins, R.J. Spontak, Manuscript in Preparation 2003.
37. M. Beiner, G. Fytas, G. Meier, S.K. Kumar, Physical Review Letters 1998, 81, 594. 38. J.J. Watkins, G.D. Brown, V.S. RamachandraRao, M.A. Pollard, T.P. Russell,
Macromolecules 1999, 32, 7737.
39. V.S. RamachandraRao, J.J. Watkins, Macromolecules 2000, 33, 5143. 40. B.D. Vogt, J.J. Watkins, Macromolecules, 2002, 35, 4056.
41. S.M. Gross, G.W. Roberts, D.J. Kiserow, J.M. DeSimone, Macromolecules 2000, 33, 45. 42. M. Takada, M. Ohshima, Polymer Engineering and Science 2003, 43, 479.
43. M. Varma-Nair, P.Y. Handa, A.K. Mehta, P. Agarwal, Therochimica Acta 2003, 396, 57. 44. Y.P. Handa, Z.Y. Zhang, L. Roovers, Journal of polymer Science, Part B: polymer
Physics 2001, 39, 1505.
47. T.A. Walker, G.D. Wignall, Y.B. Melnichenko, J.S. Lin, R.J. Spontak, Manuscript in Preparation 2003.
48. T.A. Walker, G.D. Wignall, Y.B. Melnichenko, R.J. Spontak, Macromolecules, In Press 2003.
49. Y.T. Shieh, Y.G. Lin, H.L. Chen, Polymer 2002, 43, 3691. 50. Y.T. Shieh, K.H. Liu, T.L. Lin, Polymer 2003.
51. T. Mizumoto, N. Sugimura, M. Moritani, Y. Sato, H. Masuoka, Macromolecules 2000,
33, 6757.
52. T. Mizumoto, N. Sugimura, M. Moritani, Y. Sato, H. Masuoka, Macromolecules 2001,
34, 1291.
53. T. Mizumoto, N. Sugimura, M. Moritani, H. Yasuda, Y. Sato, H. Masuoka,
Macromolecules 2001, 34, 5200.
54. G.I. Taylor, Proceedings of the Royal Society of London, Series A, Containing Papers of a Mathematical and Physical Character 1934, 146, 501.
55. J.R. Royer, J.M. DeSimone, S.A. Khan, Journal of Polymer Science Part B-Polymer Physics 2001, 39, 3055.
56. X. Han, W. Koelling, D.L. Tomasko, L.J. Lee, Polymer Engineering and Science 2002,
42, 2094.
57. S.K. Goel, E.J. Beckman, Polymer Engineering and Science 1994, 34, 1137.
58. M.D. Elkovitch, D.L. Tomasko, L.J. Lee, Polymer Engineering and Science 1999, 39,
59. M.D. Elkovitch, L.J. Lee, D.L. Tomasko, Polymer Engineering and Science, 2000, 40,
1850.
60. M.D. Elkovitch, L.J. Lee, D.L. Tomasko, Polymer Engineering and Scienc, 2001, 41,
2108.
61. M. Lee, C. Tzoganakis, C.B. Park, Advances in Polymer Technology 2000, 19, 300. 62. M. Lee, C. Tzoganakis, C.B. Park, Polymer Engineering and Science 1998, 38, 1112. 63. S. Siripurapu, Y.J. Gay, J.R. Royer, J.M. DeSimone, R.J. Spontak, S.A. Khan, Polymer
2002, 43, 5511.
64. D.F. Baldwin, C.B. Park, N.P. Suh, Polymer Engineering and Science 1996, 36, 1425. 65. B. Krause, R. Mettinkhof, N.F.A. van der Vegt, M. Wessling, Macromolecules 2001, 34,
874.
66. S. Doroudiani, C.B. Park, M.T. Kortschot, Polymer Engineering and Science 1998, 38,
1205.
67. J. Wang, X.G. Cheng, M.J. Yuan, J.S. He, Polymer 2001, 42, 8265.
68. B. Krause, K. Diekmann, N.F.A. van der Vegt, M. Wessling, Macromolecules 2002, 35,
1738.
69. J. Wang, X.G. Cheng, X.J. Zheng, M.J. Yuan, J.S. He, Journal of Polymer Science: Part B: Polymer Physics 2003, 41, 368.
70. B. Krause, H.J.P. Sijbesma, P. Munuklu, N.F.A. Van der Vegt, Macromolecules 2001,
34, 8792.
72. C. Shi, Z. Huang, S. Kilic, J. Xu, R.M. Enick, E.J. Beckman, A.J. Carr, R.E. Melendez, A.D. Hamilton, Science 1999, 286, 1540.
73. S. Doroudiani, C.B. Park, M.T. Kortschot, Polymer Engineering and Science 1996, 36,
2645.
74. K.A. Arora, A.J. Lesser, T.J. McCarthy, Macromolecules 1999, 32, 2562. 75. P. Rajagopalan, T.J. McCarthy, Macromolecules 1998, 31, 4791.
76. D. Li, B. Han, Z. Liu, D. Zhao, Polymer 2001, 42, 2331.
77. E. Kung, A.J. Lesser, T.J. McCarthy, Macromolecules 1998, 31, 4160.
78. Z. Liu, J. Wang, X. Dai, B. Han, Z. Dong, G. Yang, X. Zhang, J. Xu, Journal of Materials Chemistry 2002, 12, 2688.
79. Z. Liu, Z. Dong, B. Han, J. Wang, J. He, G. Yang, Chemistry of Materials 2002, 14,
4619.
80. D. Li, B. Han, Macromolecules 2000, 33, 4555.
81. M. Tang, T.Y. Wen, T.B. Du, Y.P. Chen, European Polymer Journal 2003, 39, 143. 82. M. Tang, T.Y. Wen, T.B. Du, Y.P. Chen, European Polymer Journal 2003, 39, 151. 83. E. Kung, A.J. Lesser, T.J. McCarthy, Macromolecules 2000, 33, 8192.
84. O. Muth, Th. Hirth, H. Vogel, Journal of Supercritical Fluids 2000, 17, 65. 85. J.J. Watkins, T.J. McCarthy, Macromolecules 1994, 27, 4845.
86. J.J. Watkins, T.J. McCarthy, Macromolecules 1995, 28, 4067.
87. Z.Dong, Z. Liu, B. Han, J.He, T. Jiang, G. Yang, Journal of Materials Chemistry 2002,
88. J. Zhang, A.J. Busby, C.J. Roberts, X. Chen, M.C. Davies, S.J.B. Tendler, S.M. Howdle,
Macromolecules 2002, 35, 8869.
Polymer/Block A Polymer/Block B Type of boundary
Compositions examined (fraction of A)
CO2 conditions
(P, T, ρ) T or P sweeps
Behavior of shift and Comments
Max extent of transition temperature shift
Method of measurement Reference
Polystyrene (Mn=3300) (PDI=1.09)
polyisoprene (Mn=1000) (PDI=1.05)
UCST 0.1, 0.2, 0.36 (wt)0-35MPa,
31-100oC T at constant Ps
Initially depressed to minimum at about 20MPa, then increases
back to ambient condition values at about
35MPa
-28oC
visual, spectroscopy,
SANS 29
d-Polystyrene (Mw=90000)
Poly(vinyl methyl ether) (Mw=104000)
LCST 0.5 (wt?) 2.4MPa,
0.046g/cc, 40oC P at constant Ts Depressed -115oC SANS 38
d-Polystyrene (Overall
Mw(copolymer) = 32000)
n-butyl
Methacrylate LDOT 0.6 (vol) 0.3 g/cc, 100oC P at constant Ts Depressed
-250oC (from
projected ambient LDOT)
SANS 38
d-Polystyrene (Overall
Mw(copolymer) = 78000)
n-butyl
Methacrylate LDOT 0.48 (vol) 0.05g/cc, 145oC P at constant Ts Depressed -35oC SANS 38 Polystyrene
(Mw=570k, 83k, 81k) and Anthracene-labeled PS at 10ppm in solvent-free blend)(Mw=105k) (PDI=1.01-1.03)
Poly(vinyl methyl ether) (Mw=90k, 99k) (PDI=2.20, 3.0)
LCST 0.25, 0.4, 0.5, 0.6, 0.75 (wt)
10-70bar (40oC),
10-60bar (60oC)
T at ambient P;
P at constant Ts
Depressed, presence of CO2 eliminated/buffered
the effects of M and
PDI, higher PS content required higher pressures of CO2 to
order the systems at a given temperature
-90oC Fluorescence
spectroscopy 39
Polystyrene (Mn=7200) (Overall PDI
(copolymer)=1.05)
Polyisoprene
(Mn=7800) UODT 0.44 (vol)
0.4g/cc (117bar), 60-105oC
(0.35g/ccethane (132bar),
50-105oC)
T at constant Ps Depressed -45oC
(-55oC ethane) SANS 35
Poly(dimethyl siloxane) (Mw=44500)
(PDI=1.09)
Poly(ethyl methylsiloxane)
(Mw=14600) (PDI=1.13)
UCST 6,10,20,35,51,62, 80,90 (wt)
ambient P to
35MPa T at constant Ps Elevated +100oC Spectroscopy 36 Poly(vinylidene fluoride)
(Mw=350k) (PDI=2.75)
Poly(ethyl methacrylate)
(Mw=505k)
LCST 75(wt) ambient P to
1500psi T at constant Ps
Depressed from
projected Spectroscopy
Walker et al., unpublished
results
Low-fraction Polymer% (A)
High-fraction
Polymer% (B) without COη-A / η-B 2
η-A / η-B with CO2
Size without CO2 (µm)
Size with CO2 (µm)
Type of mixing for morphology measurements
Viscosity
measurments Reference
PMMA25 PS75 20 10 Reduced
Batch & Twin-screw extruder
Single-screw extruder 58
PMMA25 PS75 7.3 3.4 5.6 3.6
Batch & Twin-screw extruder
Twin-screw
extruder 59
PMMA50 PS50 20 10 Reduced
Batch & Twin-screw extruder
Single-screw extruder 58
PS25 PMMA75 0.05 0.1 Already small Striated
Batch & Twin-screw extruder
Single-screw extruder 58
Rubber30 PS70 0.4 0.77 10 1 to 2
Batch & Twin-screw extruder
Twin-screw
extruder 60
Rubber30 PMMA70 0.06 0.29 Reduced
Batch & Twin-screw extruder
Twin-screw
extruder 60
PMMA25 PS75 1.3 0.86
Slightly reduced
Batch & Twin-screw extruder
Twin-screw
extruder 59
PE20 PS80 0.37 0.62
Slightly reduced Twin-screw & Single/Twin-screw tandem extruders Twin-screw extruder 61
PS20 PE80 2.70 1.61 2 to 10 Submicron
Twin-screw & Single/Twin-screw tandem extruders Twin-screw extruder 62
PE50 PS50 0.37 0.62
Difficult to ascertain the effect since structure is cocontinuous. Twin-screw & Single/Twin-screw tandem extruders Twin-screw extruder 61
Substrate polymer Polymerizing monomer Initiator Comments Reference PCTFE Styrene AIBN/tert-butyl perbenzoate 85,86 PMP Styrene AIBN/tert-butyl perbenzoate 85 HDPE Styrene AIBN/tert-butyl
perbenzoate 85, 77
Nylon 66 Styrene
AIBN/tert-butyl
perbenzoate 85
Poly(oxymethylene) Styrene
AIBN/tert-butyl
perbenzoate 85
Bisphenol A PC Styrene
AIBN/tert-butyl
perbenzoate 85
PCTFE
Styrene/crosslinking agents
(divinylbenzene or triallyl cyanurate) Tert-butyl perbenzoate
Also post-reaction surface sulfonation 75
FEP
Styrene/crosslinking agents
(divinylbenzene or triallyl cyanurate) Tert-butyl perbenzoate
Also post-reaction surface sulfonation 75
PTFE
Styrene/crosslinking agents
(divinylbenzene or triallyl cyanurate) Tert-butyl perbenzoate
Also post-reaction surface sulfonation 75
FEP Styrene Tert-butyl perbenzoate 74
FEP ECA
Pyridine or triphenyl
phosphine Anionic polymerization 83
Bisphenol A PC or PVC or PTFE
Styrene or methyl methacrylate or
methacrylic acid AIBN
All 9 possible combinations were studied, but characterization focused on
PVC/PMAA composite 84
PVC Styrene AIBN 80
PET Styrene AIBN 76
Silicon rubber
(crosslinked) Styrene Benzoyl peroxide 78
itPP Acrylic acid Benzoyl peroxide Grafting reaction 87 UHMWPE Methyl methacrylate Tert-butyl perbenzoate 88
PP Styrene AIBN 79
PS Pyrrole
FeCl3, Fe(NO3)3, Fe(SO4)3, Fe(ClO4)3
Oxidation of pyrrole in
0
0.2
0.4
0.6
0.8
1
Te
m
p
er
at
u
re
Weight or Volume Fraction
UCST Binodal Spinodal 1-phase region m eta-stable region 2-phase region
0 0.2 0.4 0.6 0.8 1
Tem
p
er
at
u
re
W eight or Volume Fraction
LCST Binodal Spinodal 1-phase region m eta-stable region 2-phase regionFigure 1.2. Temperature-composition phase diagram schematics for blends and block copolymers: (a) UCST/UODT and (b) LCST/LDOT. Critical points, spinodal (limit of stability) and binodal (coexistence) are indicated, along with the one-phase, meta-stable, and two-phase regions.
Figure 1.3. Conceptual representation of the driving factors behind blend and block What drives
thermodynamic behavior of blends/block copolymers in the presence of carbon
dioxide? Enthalpic effects
(balance of interactions A-A, B-B, A-B
Combinatorial entropy effects (minimal
compared to small molecule systems) Entropic EOS effects
(compressibility, free volume)
CO
2effects on polymers:
Increase mobility
Figure 1.4. Change in cloud point temperature, Tcp(P)-Tcp(P=0), as a function of CO2