METHODS OF COMBINlNG LINKAGE I N T E N S I T Y VALUES
FROM BACKCROSS, Fz AND FI GENETIC DATA'
H. H. KRAMER AND C. R. BURNHAM
Purdue University Agricultural Experiment Station, Lujayette, Indiana and
Minnesota dgricultural Experiment Station, St. P a d , Minnesota Received March 17, 1947
EVERAL sources of genetic data for the calculation of linkage intensities
S
(percentages of recombination) may be available including Fz and Fsdata from both coupling and repulsion crosses. For the various sources of. data involving two pairs of factors each segregating 3: I in Fz with all classes fully viable, IMMER (I 934) has presented maximum likelihood and standard error formulae. IMMER and HENDERSON (1943) have presented tables.which greatly reduce the necessary calculaiions. Recently, FISHER (1946) has presented a simple method of scoring linkage data based on maximum likelihood formulae which can be used t o obtain (I) a test of significance of the deviations from independent assortment for each source of data as well as for the pooled data, ( 2 ) a test of the homogeneity of the group of linkage intensities t o be combined, and ( 3 ) the average or combined
p
value. Two methods have been suggested for obtaining a single recombination value which best fits all the data: (I) by combining (by addition) the separate maximum likelihood formulae into one equation and solving by trial and error substitution of various values forp
until one is found which most nearly makes the equation equal to o (IMMER, 1934); and (2) approximating the combinedp
value by weighting each sep-arate recombination value by appropriate use of the amount of information furnished by each source of data (IMMER and HENDERSON, 1943). I n this latter publication only the second method was used.
I n trials of the first method in a problem used in advanced classes a t the
UNIVERSITY OF MINNESOTA, it was found that certain of the maximum likeli- hood formulae as they now exist in the literature must be modified t o ac- complish the desired purpose. The purpose of this paper is t o point out these changes, t o illustrate the use of the formulae in determining
p
values and standard errors, t o adapt and illustrate FISHER'S method of scoring, and t o summarize the simplest methods available. To enable workers t o derive their own formulae for linkage data involving other genetic ratios, the steps in deriving them are given in some detail.DERIVATION OF THE FORMULAE
If the percentage of recombination is the same in male and female, and
p
represents the recombination value in repulsion expressed as a decimal, I-
p
*
Published as Journal Paper No. 287 of the PURDUE UNIVERSITY AGRICULTURAL EXPERIMENT STATION and as SCIENTIFIC JOURNAL SERIES Paper No. 2335 of the MINNESOTA AGRICULTURAL EXPERIMENT STATION.380 H. H. KRAMER AND C. K. RURNHAM
being the frequency of parental combiriations, the expected frequencies of F1 gametes and Fz phenotypes from a repulsion cross involving factor pairs Aa and Bb are:
F1 gametes or Fz phenotypes FI gametic frequency
Fz expected phenotypic frequency
FZ observed number
The expected frequencies of the Fz genotypes and their observed numbers (d t o m), as determined by their breeding behavior in F3 lines are in the cells of the following checkerboard table:
A A A a aa
The observed numbers, h and i, are for the two kinds of heterozygotes, coupling (AB/ab) and repulsion ( Ab/aB) respectively.
For repulsion, the steps in the derivation of any maximum likelihood for- mula may be illustrated for the singly dominant Ab Fz phenotype Cj and k classes) classified in Fa2 as follows:
I . The total of the expected frequencies of the component genotypes AAbb and Aabb is determined:
(1 - PI2/4
+
ZP(1-
P)/4 = (1-
P2)/4.2 . The expected proportion for each class is obtained, expressed in its sim- plest terms:
3. The observed number in each class is multiplied by the logarithm of the expected frequency in that class and summed:
j log [(I
-
P)/(I+
PI
1
+
k log [ ~ P / ( I+
P)1
j log ( I
-
p)-
j log ( I+
p)+
k
log zp-
k log (I+
p).which may be written:
-
(1)
COMBINING LINKAGE VALUES
-
0.k 3
0'
+
k)P ( I
-
PI ( I+
PI__----
This is the maximum likelihood formula. It may be expressed in the fol- lowing form for direct calculation of
p :
k k + 2 j
P=-* (3)
For coupling, the maximum likelihood equation may be derived most easily by substituting
( I - p )
forp
in formula (I) above. Differentiating with respect t op ,
simplifying and equating t o o gives:A comparison of formulae (2) and (4) shows that the coupling formula may be obtained from the one for repulsion by substituting ( 1 - p ) for
p
and multi- plying the entire equation by ( - I ) . ~ This also holds for the other formulae when used for coupling data. This change of sign for coupling is necessary when repulsion and coupling formulae are combined t o obtain ap
value which best fits all of the available data. It is necessary also when FISHER'S method of scoring linkage data is used, as he has indicated.Another source of difficulty arises from the fact that in certain formulae (IMMER 1934, Formula I), a factor common to each term has been dropped. This factor, since it is not common t o all formulae, must be retained when data from several sources are combined. This factor may be illustrated by the derivation of the maximum likelihood equation for F2 data in repulsion as follows :
The equation t o be maximized by differentiation with respect t o
p
is: a log ( 2+
P2)/4+
b 1% (1 - p2)/4+
c log (1-
p2)/4+
d log p2/4.a b + c
By differentiation and simplification, this becomes
+-
dl
= o . ( 5 )-
2p L 2 + P ? (I
-
p2) p2For determining a
p
value from this source of data only, the factorz p
may be dropped and the simpler equation -np4+(a- 2b- 2c+d)p2+zd=o used. This, being in the form of the quadratic equation mx2+nx+r=o, is
-
n & d n 2-
4mr 2msolved for p2 by the general formula x = + If the proper signs
IVMF-R and HENDERSON (rg43), not recognizing the necessity for this change of sign, resorted
w 00 N TABLE I Summaries of maximum likelihood formulae for determining p values from different sources of data involving two factor pairs; including formulae for the direct calcdation of p and the amount of information. - SOURCE OF DATA UNREDUCED FORMULAE* FORMULAE FOR DIRECT AMOUNT OF DETERMINATION OF
pt
INDIVIDUAL INFORMATION (i) PER^x
Repulsion:Backcross Fsfrom
COMBINING LINKAGE VALUES 383
are observed, the square root of the positive solution for
x
will givep
(sincex = p 2 ) . When combined with other formulae into a single maximum likeli-
hood equation this factor z p must be retained and the unreduced formula ( 5 )
used. The unreduced formulae t o be used for the various types of linkage data in repulsion are summarized in table I . Formulae for the calculation of
p
valuesdirectly, as well as the amount of information per individual, are included in this table. The necessary changes for their use with coupling data are also indicated.
DERIVATION O F STANDARD ERROR FORMULAE
I n developing formulae for the standard error of
p ,
FISHER took the second differential of the maximum likelihood expression, and by substituting the expected for the observed values a, b, c , d, etc., obtained an expression giving the amount of information (i) furnished per individual. MATHER (1938,pages 57, 59) has given a general formula for deriving i :
i =
s
(i
(f>’>
where m is the expected proportion of the total in each class, dm/dp is the derivative of m with respect to
p ,
and S indicates summation. This formula may be valuable in planning experiments, since it is possible to determine the amount of information furnished by each genotypic class. Using again the singly dominant Fz Ab phenotype classified in Fa for illustration, the calcula- tions may be tabulated as follows:CLASS m
-
dmd P 1
2
The sum of the last column reduces to i =
P(I+PHI--P2)
Substituting a value of
p
in this formula gives, for that amount of recom- bination, the average amount of information per singly dominant Fz indi- vidual classified in F I .When multiplied by -n, the number of Fz individuals thus classified in F3 lines, the total amount of information
(I)
furnished by these data is given:2n I = n i =
P(’
+
P ) ( I - P2)384 H. H. KRAMER AND C. R . BURNHAM
FZ
F3
~
The formulae for the amount of information per plant or line in each source of data are in table I .
For an exact standard error of the combined
p
value which best fits all the data, calculate the total amount of information for each source of data, based in each case on the combinedp
value. The standard error is then: ~ I / S I . This standard error is approximated by the same formula in which t h eI for each source of data is based on its own respective
p
value.__
APPLICATION O F THE PORMULAE
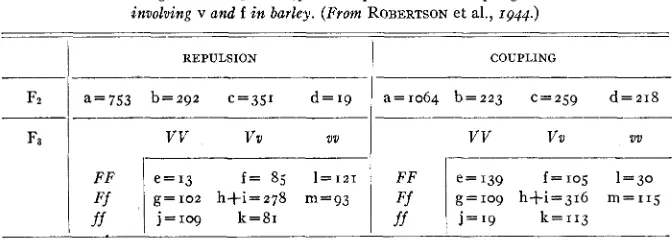
The application of the formulae may be illustrated by using data of ROBERT-
SON et al. (1944) in barley. The factors involved were
Vv,
non six row versus sixrow; and
Ff,
green versus chlorina plant color. The repulsion cross was Triple-Bearded Mariout X Minnesota 84-7 and the coupling cross was Englawnless
XMinnesota 84-7-6. The data are summarized in table 2. The F2 doubly hetero-
zygous plants were not separated into AB/ab and AblaB types. If such data were available, they would be incorporated as an additional source and treated as illustrated for the others. However, as pointed out by IMMER (1934), this separation is seldom worthwhile for recombination percentages exceeding 2 2 .
REPULSION COUPLING
________-_________
a=753 b=292 c=351 d = 1 9 a=1064 b=223 c = 2 j 9 d=218
__- ____
vv
V U vvvv
vu
vv___- __-
F F e = 1 3 f = 85 1 = 1 z 1 F F e = q 9 f=Iog l = 3 0
Ff g=102 h+i=278 m=93 Ff g = 1 0 9 h+i=316 m=115
ff j = 1 0 9 k = 8 1 ff j=19 k = 1 1 3
TABLE 2
Linkage data in FZ and Fa from a repulsion and a coupling cross
involvine v and fin barlev. (From ROBERTSON et al.. 1044.)
A
p
value was first calculated for each source of data by substituting the observed numbers in table z for a, b, c, d, etc. in the formulae in table I . For example, for singly dominant A b Fz plants from the coupling cross classi- fied in Fa the unreduced maximum likelihood formula (observing the change of signs for coupling) is:Solving by trial and error substitution of values of I -
p
€orp
in this formula gave p = . 7 4 8 for which the recombination value is (I-.748)=.252 or 2 5 . 2COMBINING LINKAGE VALUES 385
n
L
amount of information per F3 line is = 3.4725. .748( 1
+.
748) (1-
.
74S2)Values of
p
and the amouht of information per Ft plant or F3 line for each source of data are summarized in columns 2 and 3 of table 3. The standarderrors are in column 6, and the figures from which they are calculated are in columns 3 to 5.
TABLE 3
Values of p calculated by the method of maximum likelihood from the data i n table 2,
together with standard errors, the jigures necessary for S.E. calculation, and for weighting p values.
__-
_-
SOURCE P 1
OF DATA VALUE n
.244 .271 .278 .265 .318 . 2 5 2
.343 .279
1 . '555 6.2667 6.1008 5.4563 2.9279 3.4725 3.2324 3'8393
1,415 13635.0 190 1,190.7 214 1,305.6 478 2,608.1 1,764 5,164.8
132 458.4 145 468.7 669 2 , 5 6 8 . 5
,0247 . 0 2 9 0
.0277 .or96
398.94 322.68 362.96 691.15 I ,642.41 160.76 716.61 115.52
It would be desirable to have one recombination value which best fits all these data. The method of approximating such a combined recombination value by weighting the separate
p
values will be illustrated first. The formula is :(7)
SPI combined p value by weighting = __
SI
where S, p and I are summation,
p
value, and information respectively. Each value ofp
is weighted by multiplying it by the total amount of information( I ) furnished by that source of data, as shown in the last column of table 3.
The standard error for this average
p
value is ~ I / S I . For example, t o combine Fz repulsion data and F3 coupling data from singly dominant Fz A b plants the__
= .246 and the approximate standard error
398.94+115.52 1,635.0+458.4
average
p
value isI
=.0219. Average
p
values ford
I,63 5 .O+ 4 5 8 4for this average
p
value isdata combined in various ways by weighting, together with their approximate standard errors, are listed in table 4.
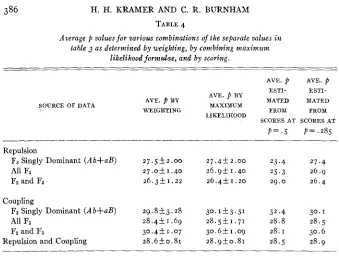
386 H. H. KRAMER AND C. R. BURNHAM
TABLE 4
Average p values for various combinations of the separate values irc table 3 as determined by weighting, by combining maximzrm
likelihood formulae, and by scoring.
--_
AVE. p AVE. p ESTI- ESTI- AVE. p BY
SOURCE OF DATA AVE. p BY MAXIMUM MATED MATED
WEIGHTING FROM FROM
LIKELIHOOD
SCORES AT SCORESAT
p = . 5 p = , 2 8 5
Repulsion
F3 Singly Dominant ( A b+aB) 27.5f2.00 27.4F2.00 23.4 27.4
All F3 2 7 . 0 k I . 4 0 26.9k1.40 25.3 26.9
Fz and F3 2 6 . 3 f 1 . 2 2 26.4k1.20 29.0 26.4
Coupling
Fa Singly Dominant (Ab+aB) 2 9 . 8 k 3 . 2 8 30.1k3.31 32.4 30. I
All F3 28.4k1.69 28.5k1.71 28.8 28.5
Fz and Fa 30.4k1.07 3 0 . 6 k 1 . 0 9 28.1 30.6
Repulsion and Coupling 28.650.81 28.9k0.81 28.5 28.9
then solve for
p
by trial and error substitution. This may be illustrated for the two sources of data used above, the calculations being as follows:SOURCE O F
DATA
FIRST TRIAL SECOND TRIAL
____
-___
FORMULAp VALUE REMAINDER p VALUE REMAINDER
.2461 -2.61 Fz repulsion +2p
[r-~---+-]
753 643 ‘9 .246 -2.462 f P 1 ( I + ) P2
,754 4-2.63 .7539 4 - 2 . 5 7 113 I 19 I 132
- _
Fa couplingfrom Ab Fz’s P (1-p) (1-I-P)
Sum $-.I7
-
.04The net positive remainder of +.17 obtained when the recombination value
of .246 was substituted into the formulae indicates that the true
p
value isslightly higher. It is however slightly lower than .2461. If the signs as indicated in table I are used, a positive remainder will always indicate that the true
p
value is higher than the one tried and a negative one will indicate a lowerp
value than the one tried. A method of determining the correction t o be used is presented in connection with FISHER’S method of scoring presented later. The exact standard error is471
where 1 is determined by substituting this combinedp
value in each of the formulae concerned (last column of table I). I n this case,2 X 1 3 2
-
2
x
I,415[1 -k ( 2x
.246’)]I =
COMBINING LINKAGE VALUES 387 Various average
p
values obtained by this method, together with their exact standard errors may be compared with those obtained by weighting (with approximate standard errors), in table 4. From this table it is apparent that the values obtained by weighting approximate closely the true value obtained by maximum likelihood, They also involve appreciably less calculation.THE METHOD OF SCORING
The method of scoring explained by F~SHER (1946) will now be adapted and illustrated. If, in the unreduced expressions in table I (not equated t o
TABLE 5
Formulae jor scores of maximum likelihood formulae and f o r amount of information when p=.s.
~ . _ ~ -
SOURCE OF DATA
INFORMATION P E R FORMULAE* FOR
F2 PLANT OR F3 LINE (i) AT p = . 5
SCORES (C) AT p =
.s
Backcross z(a-b-c+d) 4
F2
F3 from Ab F, plants
F3 from aB FZ plants
F3 from A B FZ plants 4(8e-f -g-h-i)
9
- -
F3 from doubly heterozygous FZ plants 4(h-i) 16
* Signs appropriate for repulsion, reverse for coupling.
zero), we let p=o.5, the value for independent assortment, and substitute this value (1/2) for
p
in the formulae, the simple expressions given in table 5 areobtained. Now, by substituting the observed values in table z for a, b, c, etc. in these expressions, a remainder or score (c) for each source of data is obtained a t 50 percent recombination. The last column of table 5 is the amount of in- formation per F2 plant or F3 line and is obtained by substituting
P = I / z
in the formulae in the last column of table I . These values need only be multi-plied by n, the number of plants classified from each source t o obtain the total amount of information ( I ) furnished by that source a t 50 percent recombina- tion. Since FISHER has shown that c2/I is distributed as x2, a test of the sig- nificance of the deviation from 50 percent recombination is available for each source of data, each
x2
value having one degree of freedom. Similarlyx 2
388 H. H. KRAMER AND C. R. BURN'HAM
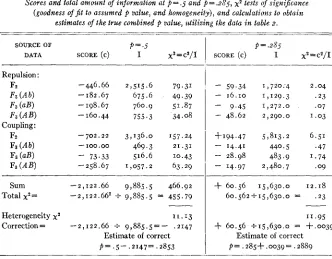
and will have (N-I) D.F. where N is the number of sources of data pooled. These calculations are summarized in the first half of table 6. The negative signs of the scores indicate less than 50 percent recombination. The individual as well as the total
x2
values a t p = . 5 show, without exception, a significant deviation.TABLE 6
Scores and total amount of information at p = .5 and p = .a;P5, x 2 tests of significance (goodness o f f i t to assumed p value, and homogeneity), and calculations to obtain
estimates of the true combined p value, utilizing the data i n table a.
~ _ _ _ _ _ _ _ _ _ . _ _ _ _ . _ _ _ _
SOURCE OF P=.5
DATA SCORE ( c ) I x2 = c2/I
-446.66 -182.67 -198.67
-
160.44-702.22
-
73.33 -258.67-100.00
-
2, I 22.66-
2,122.66'2,515.6 79.31 675.6 49.39 760.9 51.87 755.3 34.08
3,136.0 157.24 469.3 21.31 516.6 10.43 1,057.2 63.29
I_______
9,885.5 466.92
f 9,885.5 = 455.79
Heterogeneity x2 11.13
Correction= -2,122.66 f 9,885.5=- .2147
Estimate of correct
p=.5-.2147=.2853
p = 285
SCORE (C) I xZ=c'/I
-
59.34 1,720:4 2.04-
16.10 1,129.3 .23-
9.45 1,272.0 .07- 48.62 2,290.0 1.03
4-194.47 5,813.2 6.51
-
14.41 440.5 .47-
28.98 483.9 1.74-
14.97 2,480.7 .09f 60.56 15,630.0 12.18 60.562+15,630.0 = .23
11.95
f 60.56 +15,630,0 = +.0039
Estimate of correct
p = .285+.0039= .2889
The heterogeneity
x2
value of 11.13 for 7 D.F. shows that the data may be considered homogeneous and hence suitable €or combining. FISHER has shown that the ratio Sc/SI will provide an efficient estimate of the degree of deviation and therefore give a basis for estimatingp .
In the example pre- sented this ratio was -.2147 and subtracting from .5 gives a provisional estimate ofp
a t 28.53 percent recombination.The formulae in table I may now be solved for
p =
.285. The scores obtainedby this substitution and the total information for each source are in the last half of table 6. With the exception of the Fz coupling data which by the positive score indicates a recombination value greater than . 2 8 5 , no significant devia-
COMBINING LINKAGE VALUES 389 scores for
p
= .5 andp
= .285 are given in table 4. I n all cases when a score based on p = . 2 8 5 was used, the correct value ofp
was obtained even though the correction in some cases exceeded two percent.DISCUSSION
It may be well, a t this point, to summarize the simplest methods of deter- mining
p
values, their standard errors, and the information per plant or line for backcross, Fz and F3 data for (3: 1)(3: I) segregations with complete dom-inance, no factor interaction, and all classes fully viable.
I. For backcross data, use direct calculation of percent recombination in the
total population. For the standard error, use “factors t o be divided by
d;,”
in the last column of table I of IMMER and HENDERSON (1943). Amount ofinformation per plant (i) is the reciprocal of this factor squared ( i = I/f2).
2 . For Fz coupling or repulsion data alone, use the product method. The
p
values may be determined directly from the ratios ad/bc for repulsion and bc/ad for coupling in table I of ~ M M E R and HENDERSON (1943). For standarderrors, use “factors t o be divided by
4 G ’ ,
in the same table. Amount of information per plant is again the reciprocal of this factor squared. STEVENS (1939) has presented tables forp
values determined t o three places by the product method and gives a table of values, which, t o obtain the standard error, must be divided by n followed by extraction of the square root.3. For F3 data from the singly dominant Fz phenotype,
p
values may bedetermined from table 3 of IMMER and HENDERSON (1943) carrying the ratios of number of heterozygous/number of homozygous F3 lines corresponding to
different
p
values. I n practice, such data for A b and aB Fz phenotypes may be combined. I n the same table are “factors t o be divided by46”
t o obtain the standard error; also the amount of information per F3 line.4. For F3 data from doubly dominant Fz phenotypes, the maximum likeli- hood formula must be solved for
p
by trial and error substitution. I M M E R and HENDERSON (1943) in table 5 give “factors to be divided by4;’’
to obtain the standard error; also the amount of information per F3 line.5. For F3 data from doubly heterozygous Fz plants classified into coupling
and repulsion types, the value for
p ,
the amount of information per F3 line, and the standard error must be calculated from the maximum likelihood formulae. 6. For a combinedp
value which best fits all available data, the method of scoring explained by FISHER (1946) and illustrated here for the genetic ratios under consideration appears to offer the easiest solution. Data may be scored first for 50 percent recombination from the formulae presented in table 5. The estimated value ofp
obtained from these scores may be used for solution of the unreduced maximum likelihood formulae summarized in table I t o390 H. H. KRAMER AND C. R. BURNHAM
the calculation of the standard error will be facilitated by reference t o the appropriate tables referred to above.
For ratios other than (3:1)(3:1) IMMER (1930) has presented formulae for obtaining
p
values based on the product method, and their probable errors and has presented tables to facilitate their calculation.SUMMARY
When maximum likelihood formulae for different sources of linkage data are combined into one equation whose solution of
p
gives the best fit t o all available data, the unreduced formulae, as presented in table I must be used.The separite formulae, as listed for calculating
p
values from different sources of data, are for repulsion. When these formulae are used for coupling data,( r - p ) must be substituted for
p
and the entire formula multiplied by (-I).When data from different sources are not being combined, simplified formulae, also in table I, may be used for the direct calculation of
p
or appropriate tables t o facilitate the calculations may be used as indicated in the discussion.The general methods of derivation of maximum likelihood and of standard error formulae are given, their use is illustrated, and a discussion of the simplest procedures which may be used both in calculating separate
p
values and a com- binedp
value for all data available is included.The use of FISHER’S method oi scoring in determining: significance of devia- tions from independence, the homogeneity of the linkage values, and a com- bined
p
value for all sources of data is also illustrated.Only the case involving linkage between two pairs of factors, each of which segregates in a 3: I ratio in Fz is considered.
LITERATURE CITED
FISHER, R. A., 1946 A system of scoring linkage data, with special reference to the pied factors
IMMER, F. R., 1930 Formulae and tables for calculating linkage intensities. Genetics 15: 81-98.
IMMER, F. R., and M. T. HENDERSON, 1943 Linkage studies in barley. Genetics 28: 419-440.
MATHER, K., 1938 The measurement of linkage in heredity. Methuen and Co., Ltd., London. ROBERTSON, D . W., F. R . IMMER, G. A. WIEBE, and H. STEVENS, 1944 The location of two genes
for mature plant characters in barley in linkage group No. I . Jour. Amer. Soc. Agron. 36: 66-72.
STEVENS, W. L., 1939 Tables of the recombination fraction, estimated from the product ratio. J. Genet. 39: 171-180.
in mice. Amer. Nat. 80: 568-578.