Effect of Process Parameters on Color
Variation in Offset Print
Sanjay Sharma
Lecturer, Department of Printing Technology, Kalaniketan Polytechnic College, Jabalpur, M.P, India
ABSTRACT: The offset printing process is widely used in commercial printing for short and long run jobs. The offset printing process is a composite procedure linking not only the printing machine but also the substrate, ink and their interaction. The offset printing process deals with the maximum number of variables amongst all other printing process. The slight variation in process parameter leads to variation in ink transfer, which results in differentiality. This leads to variation in color and gloss on printed surface, which can be termed as color difference and. Thus, it is necessary to understand and control the process parameter to deliver quality print. The study focuses to examine the effect of significant parameters such as ink tack, alcohol %, press speed and impression pressure on color variation. The color variation is gauged by variation in ink transfer, which is governed by color difference (∆E). The spectrophotometer was employed to measure the color difference. A production runs were conducted on press to set a baseline for print defects and target was set to minimize them. A general full factorial design of experiments was generated for the above mentioned process parameters with two levels. The experimental data was analyzed by ANOVA, Main and Interaction plots to spot the optimal combination, which delivers quality print with minimized color variation. The optimized setting showed reduction in ∆E by 40%.
KEYWORDS: Offset Printing, Color Difference
I. INTRODUCTION
The goal of any printer is to deliver the job on time with quality and retain the customer. The consistency in the print characteristics within the job and between the jobs is also important to both printers and customers.
Paper and Board are majorly used substrate for commercial printing and packaging, which is widely printed by offset printing process. One of the foremost challenges faced by the printer is to control the shade variation in print both spatial and temporal for a given job. The inconsistent ink lay-down results in color drift in the print viz. side-to-side and sheet-to-sheet in solid and halftone. This leads to wastage of substrate and inks thereby reducing productivity and profitability of an organization. Optimizing the offset process variables may minimize the wastage. The optimization of the offset process involves identification of best combination of process variables to minimize color variation in the print.
II. RELATED WORK
comprising of 1485 patches and Gretag Macbeth Spectrophotometer, Spectrolino was used for color gamut and color difference measurements. Color gamut differences and color deviations were evaluated using Chromix Color Think Pro 3.0 software. The color difference was calculated using ΔE94 formula. The results showed higher TVI, dot gain values at higher pressure with black exhibiting the maximum and cyan as minimum. The optical gray balance was achieved at normal printing pressure while low printing pressure exhibited good contrast and lower TVI and color difference parameters. The high printing pressure level application during the offset printing process produced the highest color gamut volume and the highest solid tone optical ink density. The study concluded that, the low printing pressure level enables a better overall print quality result comparing to the other two printing pressure settings.
Vikas Solanki et al [14] performed an experiment on effect of ink sequence on sheet fed offset print quality .the experiment was performed on art paper. The printing was carried out in four color offset machine. The press room conditions were maintained at 45% relative humidity at 280C temperature. The press runs were performed with ink sequence YMCK, MYCK, CMYK, KCMY and KYMC and print quality parameters such as density, lab values and contrast of different samples were measured by X- Rite 528 spectrophotometer. At various percentage of density (100, 90, 70, 40. 15 and 3), YMCK and MYCK sequence gives the maximum and minimum values for red and green color. KCMY gives the maximum density values for blue color and remaining all sequences has almost same value. Red color has almost same contrast in all the sequence, KYMC gives the minimum contrast value for green, violet, and purple color. CMYK sequence gives the maximum contrast value for violet and orange color. Brown color has no variation in all the sequence. KCMY gives the maximum contrast value for green and purple color. KYMC gives maximum contrast value for blue while YMCK gives minimum value for orange color. According to the value of ΔE CMYK, MYCK, YMCK AND KYMC sequence are more suitable respectively for red, green, orange, and purple color. KCMY sequence was more suitable for blue, brown, and violet color. Similar experiment was conducted by Lubdha Lade on effect of ink color sequence on color gamut. The results revealed minimum ΔE and maximum color gamut with KCMY.
III. METHODOLOGY
A Customized monotone test form was designed with elements such as images, step wedge, vignettes, surface/reverse, line elements, control strip and solid patches across the sheet.
Test form was exposed to a computer-to-plate at a predetermined screen ruling.
Cyan ink was used to print on 130 GSM coated paper.
An independent trail was performed in and working press room environment.
The performance of this trail was intended to correlates with results obtained after DOE.
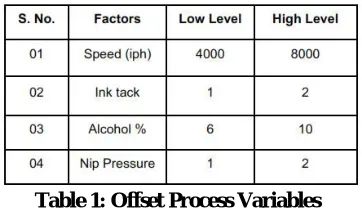
In the first phase, full factorial DOE for four parameters were performed, these parameters includes alcohol %, machine speed, pressure and ink tack.
For Tack and Pressure, two levels are assumed with reference to the baseline as Low(1) and High(2).
The printed sheets were measured for L*a*b ΔE values.
The DOE was analyzed to identify the best combination of variables minimizing the color difference.
The best combination of variables was re-run to verify the analyzed results from the DOE and further checked for consistency by re-running the best combination of variables at regular intervals.
Process Parameters:
Table 1: Offset Process Variables IV. PRODUCTION RUN AND BASELINE
The production runs were conducted on the coated paper (130 GSM) for few days on a Heidelberg offset printing press. The parameters were set at 6000 impressions/hour machine speed, 220 ink tack, 8% alcohol and 0.03 mm pressure. The objective of carrying out this exercise was to define a baseline for the ∆E.
Production run ∆E
P1 1.31
P2 1.32
P3 1.30
P4 1.32
P5 1.32
Base line 1.31
Table 2: Baseline data for ∆E
The data collected from the production run on coated paper showed mean ∆Eof 1.31, hence it was considered as baseline. The target was set to minimize the ∆E.
V. COLOR DIFFERENCE ANALYSIS (∆E)
800 0 4000
1.00 0.98 0.96 0.94 0.92
2 1
10 6
1.00 0.98 0.96 0.94 0.92
2 1
Sp e e d (iph )
M
e
a
n
T ack
A lc ohol % Pre ssure
Main Effects Plot for Delta E
increase in speed shows lower ∆E value. The spreading of ink with lower tack is a very rapid phenomenon. The lower tack corresponds to lower viscosity of ink comparatively. The lower tack ink spreads more and creates uneven ink lay down which results in variation in density across the transferred areas. Therefore, lower tack results in higher ∆E value. The higher tack ink showed uniform distribution of ink across the printed sheet, which resulted in lower ∆E value. The higher alcohol percentage shows unstable emulsification, which degrades the print quality while lower alcohol percentage shows stable emulsification, which results in even ink lay down across the sheet. The lower alcohol percentage showed uniform IFT (Ink Film Thickness) across the transferred area which resulted in lower ∆E. The higher printing pressure applied ensure larger degree of force acting in NIP which helps in even ink transfer across the area. Therefore, higher printing pressure applied showed lower color difference.
2
1 6 10 1 2
1.02
0.96
0.90
1.02
0.96
0.90
1.02
0.96
0.90 Speed (iph)
Tack
Alcohol %
Pressure
4000 8000 (iph) Speed
1 2 Tack
6 10 Alcohol %
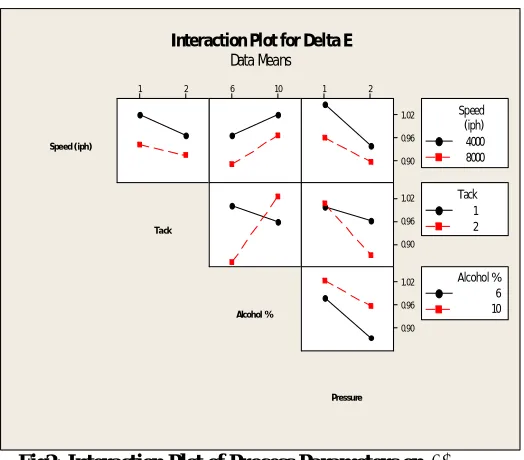
Interaction Plot for Delta E
Data Means
Fig2: Interaction Plot of Process Parameters on ∆E
The interaction plots indicate that the lowest ∆E is obtained at 8000 iph speed, 2 ink tack, 2 pressure with 6% alcohol. The interaction of speed with ink tack, alcohol% and pressure showed slightly skewed lines which indicate the slight degree of interaction. Also, the interaction with alcohol% with pressure showed slightly skewed lines. The interaction of ink tact with alcohol% and pressure shows out of parallel state which indicates the significant interaction between them.
VI. STATISTICAL ANALYSIS FOR ∆E
Table 3 Estimated Effects and Coefficients for ∆E
Term Effect Coef SE Coef T P
Constant 0.96125 0.008515 112.89 0.000
Speed(iph) -0.06625 -0.03313 0.008515 -3.89 0.001
Tack -0.04125 -0.02062 0.008515 -2.42 0.025
Alcohol% 0.06500 0.03250 0.008515 3.82 0.001
Pressure -0.08625 -0.04312 0.008515 -5.06 0.000
Speed*Tack 0.01250 0.00625 0.008515 0.73 0.471
Speed*Pressure 0.02250 0.01125 0.008515 1.32 0.201
Tack*Alcohol % 0.10875 0.05438 0.008515 6.39 0.000
Tack*Pressure -0.04750 -0.02375 0.008515 -2.79 0.011
Alcohol%*Pressure 0.02125 0.01062 0.008515 1.25 0.226
Summary of Model
S = 0.0481688 PRESS = 0.113139
R-Sq = 84.45% R-Sq(pred) = 63.89% R-Sq(adj) = 77.05%
The p-value represents the probability of error involved in accepting the observed results. The p- and t-values suggest that all the input parameters are significant but pressure has a paramount effect on ∆E. The coefficients indicate the relative importance of each factor to the response (∆E). The coefficient of pressure (-0.04312) and speed (-0.03313) indicates a greatest impact on ∆E.
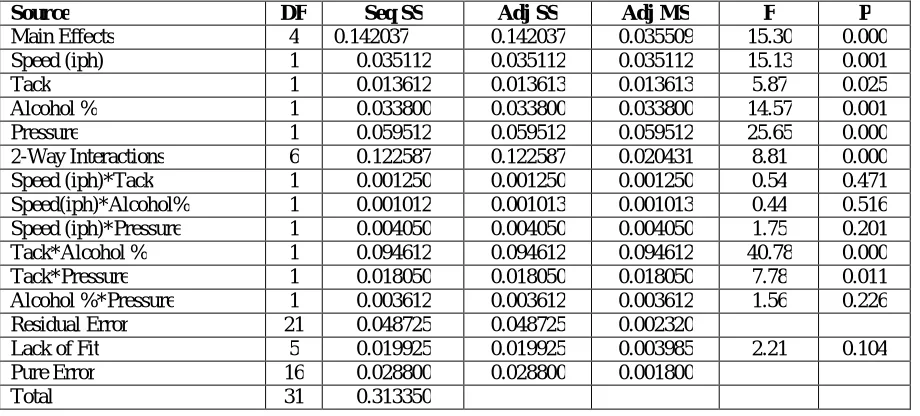
Table 4: ANOVA (Analysis of Variance) for ∆E
Source DF Seq SS Adj SS Adj MS F P
Main Effects 4 0.142037 0.142037 0.035509 15.30 0.000
Speed (iph) 1 0.035112 0.035112 0.035112 15.13 0.001
Tack 1 0.013612 0.013613 0.013613 5.87 0.025
Alcohol % 1 0.033800 0.033800 0.033800 14.57 0.001
Pressure 1 0.059512 0.059512 0.059512 25.65 0.000
2-Way Interactions 6 0.122587 0.122587 0.020431 8.81 0.000
Speed (iph)*Tack 1 0.001250 0.001250 0.001250 0.54 0.471
Speed(iph)*Alcohol% 1 0.001012 0.001013 0.001013 0.44 0.516
Speed (iph)*Pressure 1 0.004050 0.004050 0.004050 1.75 0.201
Tack*Alcohol % 1 0.094612 0.094612 0.094612 40.78 0.000
Tack*Pressure 1 0.018050 0.018050 0.018050 7.78 0.011
Alcohol %*Pressure 1 0.003612 0.003612 0.003612 1.56 0.226
Residual Error 21 0.048725 0.048725 0.002320
Lack of Fit 5 0.019925 0.019925 0.003985 2.21 0.104
Pure Error 16 0.028800 0.028800 0.001800
Total 31 0.313350
predict new observations nearly as well as it fits the existing data. Also, smaller PRESS value of 0.113139 indicates better predictive ability of model. The lack of fit with α > 0.05 indicates that the data fits well in the model. The lack of fit value of 0.104 represents the accuracy of the model.
VII. CONCLUSION
The analysis for ∆E revealed significance of all the main factors i.e., press speed, ink tack, alcohol% and pressure in minimizing print ∆E. The best settings as extracted from the interactions plot for ∆E on coated paper was at 8000 press speed, 2 ink tack, 6% alcohol and 2 pressure. The optimized setting resulted in reduction of ∆E by 40%. The ANOVA table4 for ∆E showed higher than 81% for R-Sq, 77% for R-Sq adjusted and 69% for R-Sq predicted which explains the ability of model to explain variability and make efficient predictions for new observation. The ∆E was reduced by 40% for coated paper at 8000 press speed, 2 ink tack, 6% alcohol and 2 pressure.
REFERENCES
1. Verikas, A., Lundström, J., Bacauskiene, M., &Gelzinis, A. (2011). Advances in computational intelligence-based print quality assessment and
control in offset colour printing. Expert systems with applications, 38(10), 13441-13447.
2. Sarela, S., Harkonen, E., &Paulapuro, H. (2002). Evaluation of Ink Transfer Theory. In TAGA (pp. 90-108). TAGA; 1998.
3. Särelä, S. (2004). Uncoated paper surface for coldest web offset printing. Set-off Studies, DrSc Thesis, Department of Forest Products
Technology, Helsinki University of Technology, Espoo, Finland.
4. Milošević, R., Kašiković, N., Novaković, D., &Stančić, M. (2014). influence of different printing pressure levels on sheet-fed offset print
quality. Journal of Chemical Technology & Metallurgy, 49(4).
5. Li, Y., Gu, W. J., & He, B. G. (2013). Research on the Influence of Printing Pressure and Speed on Print Quality of Coated Paper. Advanced
Materials Research, 663, 286-290.
6. Chen, W. G., & Jiang, W. Y. (2012). The Study of Ink Viscosity and Ink-Transfer Relations. Applied Mechanics and Materials, 184, 587-590.
7. Yang, Y. G. (2011). Research on the Tack Value of Offset Printing Ink.Advanced Materials Research, 314, 1401-1405.
8. Yang, Y. G., & Liu, F. P. (2011). Effects of Paper Properties and Printing Conditions on the Ink Penetration into Offset Paper. Advanced
Materials Research, 236, 1139-1142.
9. Hu, K. T., Li, M., & Hu, B. (2012). The Impact of Paper Formation on Printability. Applied Mechanics and Materials, 217, 849-852.
10. Yang, Y. G., Gao, Q. Z., & Liu, F. P. (2011). Effects of Paper Properties on Printing Dot Gain and Color Gamut. Advanced Materials
Research, 236, 1238-1241.
11. Li, Z. J., Meng, Q. J., & Liu, L. (2012). The Influence of Offset Paper Properties on Printing Effect. Advanced Materials Research, 550,
3295-3298.
12. Meng, Q. J., & Li, Z. J. (2013). Research on the Influence of Paper Smoothness on the Color Effect. Advanced Materials Research, 704,
200-203.
13. Zhang, X. L., & Wang, R. M. (2011). Study on the Ink Penetration Behavior of the Offset Paper Surface. Advanced Materials Research, 174,
354-357.