Abstract
ERVIN, JENNIFER KELLY. Post Heat Treatment Effects of Ti-6Al-4V Produced via Solid Freeform Electron Beam Melting. (Under the direction of Professor Jerome J. Cuomo).
Traditionally, Ti-6Al-4V components are fabricated by forging or casting. However, these methods of production require expensive dies or molds. The cost per part is very high for those parts produced in low quantities. The solid freeform electron beam melting process aims to produce high dimensional tolerance parts with similar mechanical properties at a lower cost by melting Ti-6Al-4V powder in a layer by layer fashion using high energy electrons. Due to the directional solidification effects, the microstructure seen in this process consists of a columnar grain structure along the growth direction and an equiaxed structure at the cross-sectional growth plane. This type of structure is thought to contribute to the
anisotropy of tensile properties discovered in previous research. Although, preferred orientation of the α laths may play a role as well. Heat treatments above the β transus are performed in order to improve the tensile properties, specifically ductility, with intensions to remove preferred orientation and to disunite the columnar grain structure. Tensile testing, fractography, optical microscopy, and x-ray diffraction are used to characterize and compare the as-processed and β heat treated electron beam melted specimens. It is found for all β
treatment. The presence of a colony microstructure is a possible reason for the improvement in ductility. From the x-ray data obtained, the preferred orientation is not reduced but instead increases after heat treating in the β region which likely is a result of the favorable
Post Heat Treatment Effects of Ti-6Al-4V Produced via
Solid Freeform Electron Beam Melting
by
Jennifer K. Ervin
A thesis submitted to the graduate faculty of North Carolina State University
in partial fulfillment of the requirements of the degree of
Master of Science
Materials Science and Engineering Raleigh, North Carolina
2008
APPROVED BY:
_________________________________ _________________________________ Dr. Denis R. Cormier Dr. Korukonda L. Murty
Biography
Jennifer Kelly Ervin was born on August 15, 1982 in Kinston, North Carolina. She received her bachelor’s degree in Materials Science and Engineering from North Carolina State University in 2005. After graduation, Kelly traveled to Rajamangala University of
Acknowledgements
I would like to thank Dr. Jerome J. Cuomo for his guidance and support throughout my years as an undergraduate and graduate student. The ample “opportunities” which he has presented to me are invaluable. I would also like to thank the members of my committee Dr. Denis R. Cormier and Dr. Korukonda L. Murty. A special thank you goes to Dr. Ray B. Benson, Jr. who provided constant insight and assisted me in my research endeavors.
I am thankful to Dr. Roger C. Sanwald and Dr. C. Richard Guarnieri for their guidance when I first began working with the group and to everyone at the Institute of Maintenance Science and Technology. I owe many thanks to the students and staff involved with the Arcam project. Also, this research would not be possible without the financial support of the Golden Leaf Foundation.
I would also like to express my appreciation to the Marine Corps Air Station Cherry Point, the Analytical Instrumentation Facility at North Carolina State University, and the Shared Materials Instrumentation Facility at Duke University for the use of their facilities and equipment.
Table of Contents
List of Tables……….. vi
List of Figures………. vii
1 Introduction……… 1
1.1Materials and Applications……….………... 1
1.2Fabrication……….……… 1
1.3Research Objectives……….………... 2
1.4Referenced Literature……….……… 3
2 Structure and Properties of Titanium Alloys……….. 4
2.1Crystal Structure……….………... 4
2.2Microstructure……….………... 6
2.3Mechanical Properties……….………... 7
2.4Effect of Impurities……….………... 10
2.5Referenced Literature……….…… 12
3 Production of Titanium Alloys………. 13
3.1Conventional Fabrication Methods……….…... 13
3.1.1Forging……….………... 13
3.1.2Casting………...…..…………... 14
3.2Solid Freeform Fabrication……….………... 15
3.2.1Laser Additive Manufacturing………..………... 16
3.2.2Electron Beam Melting………..………...………. 19
3.3Post Processing…….………. 25
4 Experimental Methods………... 30
4.1Methods of Analysis……….………... 30
4.1.1Mechanical Testing………..………... 30
4.1.2Scanning Electron Microscopy……..……….... 33
4.1.3X-Ray Diffractometry………....………….... 35
4.2Design of Experiments………... 37
4.3Referenced Literature………. 40
5 Results and Analysis……….. 41
5.1Mechanical Properties………….………... 41
5.2Fractography……….………. 45
5.3Microscopy………….………... 53
5.4Phase Analysis……….……….. 61
5.5Referenced Literature…….……… 69
6 Conclusions………. 70
6.1Summary……….………... 70
6.2Future Work……….………... 71
List of Tables
Table 3.1 Mechanical properties of electron beam melted Ti-6Al-4V for three
different growth orientations…………....………..………... 24 Table 4.1 Three post processing conditions applied to the EBM as-processed
specimens………..… 38 Table 5.1 Mechanical properties of electron beam melted Ti-6Al-4V products
evaluated using 0.0564in2 cross-sectional area and compared against
wrought and cast products……….…... 43 Table 5.2 Mechanical properties of electron beam melted Ti-6Al-4V products
evaluated using 0.0539in2 cross-sectional area and compared against
List of Figures
Figure 2.1 Pseudo-binary phase diagram of Ti-6Al with varying vanadium
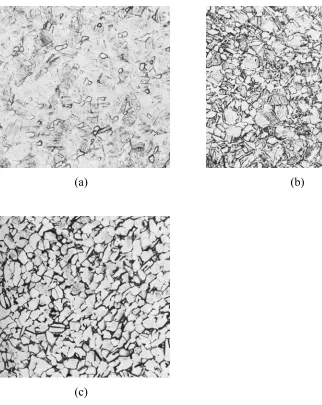
composition………... 6 Figure 2.2 Micrographs of Ti-6Al-4V solution heat treated above the β transus
at 1066°C and (a) water quenched (×500), (b) air cooled (×250), and
(c) furnace cooled (×250)………. 8 Figure 2.3 Micrographs of Ti-6Al-4V heat treated below the β transus at 954°C
and (a) water quenched, (b) air cooled, and (c) furnace cooled(×250)……… 9 Figure 3.1 Schematic representation of (a) typical SLS setup and (b) LENS
process………..……….... 17 Figure 3.2 Ti-6Al-4V micrograph showing a martensitic structure within
columnar grains which are formed parallel to the build direction
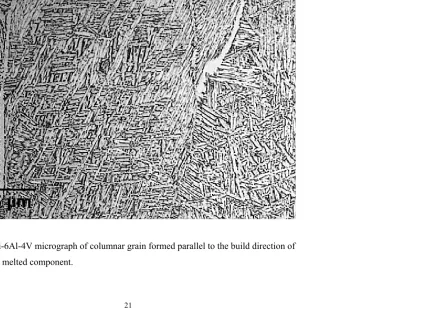
during the SLS process…………... 18 Figure 3.3 Schematic representation of the electron beam melting machine………. 20 Figure 3.4 Ti-6Al-4V micrograph of columnar grain formed parallel to the build
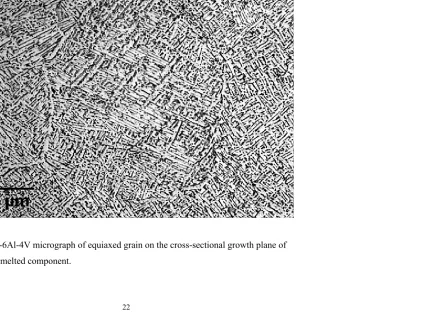
direction of electron beam melted component……….. 21 Figure 3.5 Ti-6Al-4V micrograph of equiaxed grain on the cross-sectional
growth plane of electron beam melted component………... 22 Figure 3.6 Schematics of rectangular tensile specimens built in the EBM
machine for three different growth orientations: (a) face growth
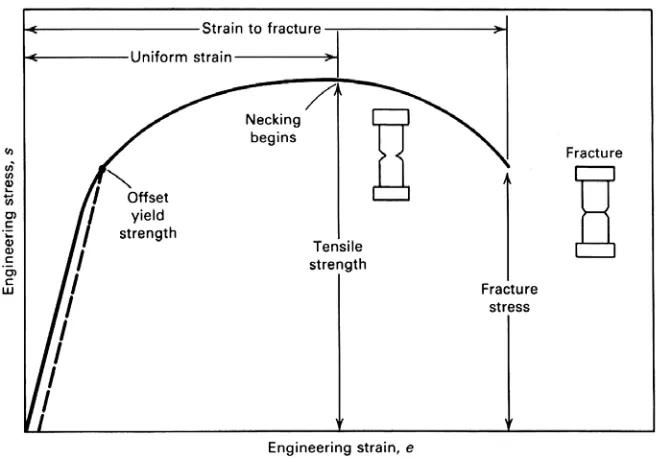
Figure 4.1 Engineering stress-strain curve typical of metals. The tensile, yield,
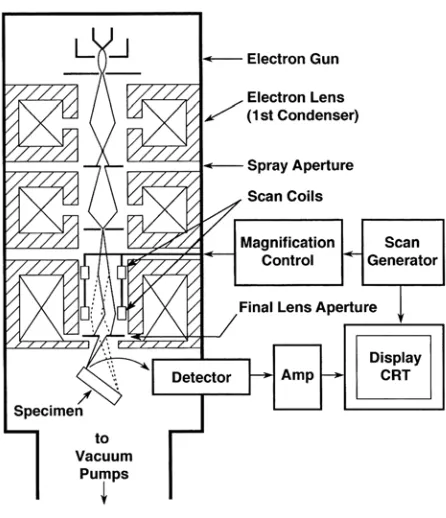
and fracture strengths are indicated on the curve……….. 31 Figure 4.2 Diagram displaying the major components of the scanning electron
microscope……… 33 Figure 4.3 Schematic representation of the depth of focus in an SEM image…………... 34 Figure 4.4 Example of x-ray diffraction pattern for sodium chloride powder…………... 36 Figure 4.5 Dimensions of the final machined cylindrical tensile specimens built
in the EBM machine………... 38 Figure 5.1 Schematic of the slightly tapered cylindrical tensile specimens after
machining……….…. 42 Figure 5.2 Fractograph of Ti-6Al-4V tensile specimen produced via EBM
showing apparent columnar structure………... 46 Figure 5.3 Fractograph of Ti-6Al-4V tensile specimen produced via EBM
showing tear ridges (arrow) along apparent grain boundaries……….. 47 Figure 5.4 Fractograph of Ti-6Al-4V tensile specimen produced via EBM
showing mostly small equiaxed dimples and several large dimples…………. 48 Figure 5.5 Fractograph of Ti-6Al-4V tensile specimen produced via EBM and
β heat treated displaying a mixed mode of cleavage and dimple
rupture. A cleavage fracture facet (arrow) is noted……….. 49 Figure 5.6 Fractograph of Ti-6Al-4V tensile specimen produced via EBM and
β heat treated displaying a mixed mode of cleavage and dimple
Figure 5.7 Fractograph of Ti-6Al-4V tensile specimen produced via EBM and
β heat treated. Equiaxed and elongated dimples are indicated in
regions A and B, respectively………... 51 Figure 5.8 Fractograph of Ti-6Al-4V tensile specimen produced via EBM and
β heat treated. Serpentine glide ridges are shown in region A, and
small equiaxed dimples occur at the lath boundary in region B………... 52 Figure 5.9 Optical micrograph of Ti-6Al-4V produced via EBM showing the
columnar structure parallel to the build direction………. 55 Figure 5.10 Optical micrograph of Ti-6Al-4V produced via EBM showing the
equiaxed structure at the cross-sectional ends of the columnar
structure……….56 Figure 5.11 Optical micrograph of Ti-6Al-4V produced via EBM which has been
β treated showing an equiaxed grain along the growth direction………. 57
Figure 5.12 Optical micrograph of Ti-6Al-4V produced via EBM and β treated
for one hour and argon gas quenched………... 58 Figure 5.13 Optical micrograph of Ti-6Al-4V produced via EBM and β treated
for one hour and furnace cooled………... 59 Figure 5.14 Optical micrograph of Ti-6Al-4V produced via EBM and β treated
for two hours and furnace cooled……….. 60 Figure 5.15 X-ray diffraction pattern of Ti-6Al-4V produced via electron beam
Figure 5.16 X-ray diffraction pattern of Ti-6Al-4V produced via EBM and
β treated for one hour and argon gas quenched……… 66 Figure 5.17 X-ray diffraction pattern of Ti-6Al-4V produced via EBM and
β treated for one hour and furnace cooled………... 67 Figure 5.18 X-ray diffraction pattern of Ti-6Al-4V produced via EBM and
Chapter 1
Introduction
1.1 Material and Applications
Titanium is a nonferrous and lightweight metal which is abundant in nature, being the ninth
most plentiful element. Titanium was discovered in 1791 by the British mineralogist and
chemist William Gregor. In 1910, Matthew Albert Hunter from Rensselaer Polytechnic
Institute was able to separate the metal by reacting titanium tetrachloride with sodium in a
steel bomb. In 1932, Wilhelm Justin Kroll of Luxembourg was able to provide a means of
producing large quantities of titanium. Shortly thereafter, titanium based alloys were
explored for aerospace applications, specifically aircraft engines. Today, titanium alloys are
used in a variety of areas including aerospace, automotive, biomedical, chemical and nuclear
engineering due to their high strength and superior corrosion resistance [1].
1.2 Fabrication
Traditionally, titanium based alloy parts are fabricated by forging or casting. However, these
methods of production require expensive dies or molds. The cost per part is very high for
those components produced in low quantities. New technology, known as solid freeform
fabrication, aims to produce high dimensional tolerance parts with similar mechanical
competing solid freeform processes are the laser additive and electron beam melting
methods. Laser additive manufacturing utilizes a laser as its energy source whereas electron
beam melting uses high energy electrons. One of the main advantages of electron beam
melting compared to laser sintering is its high energy conversion efficiency. Much of the
input power is lost during laser enhanced processes, whereas the electron beam melting
system uses nearly all of its energy input [2,3]. This new technology has high hopes from the
aerospace, automobile, and biomedical industries in which many near net shape parts are
needed.
1.3 Research Objectives
Most solid freeform fabrication research has focused on the titanium alloy consisting of six
percent aluminum and four percent vanadium, denoted as Ti-6Al-4V. The aim of this study is
to determine if the electron beam melting process with the help of post processing is a viable
alternative for the production of Ti-6Al-4V by using analytical techniques to characterize the
structure and properties. Post processing of Ti-6Al-4V is an important step in order to
improve the mechanical properties for any production route. The effectiveness of post heat
1.4 Referenced Literature
[1] C. Leyens, M. Peters (Eds.), Titanium and Titanium Alloys: Fundamentals and
Applications, Wiley, Weinheim, 2003, p. 532.
[2] J. Hiemenz, EBM Offers a New Alternative for Producing Titanium Parts and
Prototypes, in: Time-Compression Technologies, vol 14, Rapid News Publications,
UK, 2006.
[3] U. Lindhe, O. Harrysson, Rapid Manufacturing with Electron Beam Melting (EBM) –
A manufacturing revolution, in: SME Direct Metal Fabrication Forum, Dearborn,
Chapter 2
Structure and Properties of Titanium
Alloys
Titanium alloys are classified into three sectors according to the phases present: α, α+β, and
β alloys. The α+β alloys are the most commonly used due to a wide range of excellent material properties. The α+β alloys consist of an α and at least one β stabilizing element. The most common α stabilizing elements include aluminum, oxygen, nitrogen, and carbon, and the most common β stabilizers are molybdenum, vanadium, chromium, niobium, copper, and iron. The "workhorse" of the titanium alloys is the α+β titanium alloy consisting of six percent of the α stabilizer aluminum and four percent of the β stabilizer vanadium and is denoted as Ti-6Al-4V [1-5].
2.1 Crystal Structure
The α phase has a hexagonal close packed (hcp) crystal structure, and the β phase is a body centered cubic (bcc) structure. The hcp crystal structure is anisotropic, meaning the physical properties depend on the direction in which they are measured. Therefore, the material properties will greatly depend on the preferred orientation, or crystallographic texture, of the
In the α+β alloyTi-6Al-4V, the addition of aluminum provides additional strength of the α
phase. Vanadium is added to stabilize the β phase which improves the ability for the material to plastically deform. Slip deformation is more energetically favorable in bcc crystals than hcp because it has a shorter path length. According to Von Mises criterion, a minimum of five independent slip systems is needed in order to have homogeneous plastic deformation. In the case of hexagonal close packed structure, there are a total of four independent slip
systems which makes the α (hcp) titanium difficult to plastically deform. The introduction of the β (bcc) phase in Ti-6Al-4V gives rise to additional independent slip systems which improves the ductility [1-5].
The transformation from the β phase to the α phase upon cooling occurs as the close packed slip planes of the β (bcc) titanium transform to the basal planes of the α (hcp) titanium. The final transformation from the α to β phase is slightly distorted due to the differences in atomic distances between the {0001} basal plane of the α (hcp) and the {110} diagonal close packed plane of the β (bcc). The a axis of the hcp is expanded, and the c axis is contracted
thereby reducing the c/a ratio of the α titanium below the value for an ideally close packed
hexagonal lattice. The burgers relationship between the slip planes and slip directions for the phase transformation is given below:
{0001}α / / {110}β
<1120>α / / <111>β
2.2 Microstructure
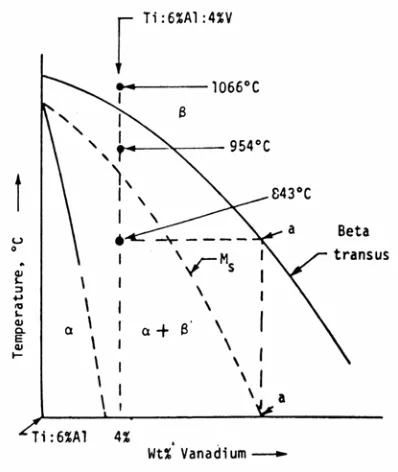
In view of the equilibrium phase diagram, the final microstructure may be predicted when considering the chemical composition, processing history, and post processing heat treatment. The diagram in Figure 2.1 is the pseudo-binary phase diagram of Ti-6Al with varying vanadium composition.
Figure 2.1: Pseudo-binary phase diagram of Ti-6Al with varying vanadium composition [4].
At four percent vanadium, water quenching from above the β transus temperature produces hcp titanium martensite (α′) by a diffusionless phase transformation process. The
dislocation density due to the rapid transformation. When air cooled from above the β transus temperature, acicular α is formed from the β phase by nucleation and growth. Slow furnace cooling from above the β transus temperature will produce coarse plate-like α structure with some intergranular β due to the slow cooling rate [1-5]. Figure 2.2 shows examples of microstructures cooled from the β region at different rates.
Cooling from the α+β region yields slightly different microstructures and mechanical
properties. When Ti-6Al-4V is quenched just below the β transus, the β phase is transformed to α′ and the primary α remains. Air cooling in the same region produces primary α in a transformed β matrix which is acicular. An equiaxed α structure containing intergranular β is formed by furnace cooling from the α+β region [1-5]. Figure 2.3 shows examples of
microstructures cooled from the α+β region at different rates.
2.3 Mechanical Properties
The mechanical properties of titanium alloys are highly dependent on the phase composition and microstructure. Near α titanium alloys exhibit increased strength and high creep
resistance due to the limited volume diffusion in the hcp crystal structure. On the other hand, the β titanium alloys provide excellent toughness and fatigue properties due to ease of plastic deformation. The presence of both the α and β phases in Ti-6Al-4V enhances the range of good mechanical properties which is why this alloy makes up more than 50% of all
performance alloys [1-3].
(a) (b)
(c)
(a) (b)
(c)
Figure 2.3: Micrographs of Ti-6Al-4V heat treated below the β transus at 954°C and (a) water quenched, (b) air cooled, and (c) furnace cooled.(×250) [5].
grain size influences the strength of the material. Separate studies by Hall and Petch showed that smaller grain sizes provide higher yield strength by inhibiting dislocation motion. The yield stress increases because there are more boundaries to block the movement of
dislocations during deformation. The Hall-Petch relationship is given by Equation 2.1, where
σy represents the yield strength, d is the grain diameter, and σo and K are constants.
d K
σ
σy = o + (2.1)
The yield strength (σy) is inversely related to the grain diameter (d) [6,7]. Also, small grain
size in the Ti-6Al-4V alloy improves the fracture toughness since large grains provide long intergranular fracture paths at the grain boundary [3].
The microstructure of the α phase affects the mechanical behavior as well. Several α
morphologies may emerge depending on the processing history. A fine equiaxed
microstructure provides excellent strength, and large equiaxed α grains offer the greatest ductility. Although not as great as the equiaxed structure, good strength may be obtained from a fine acicular α structure, and soft, ductile properties are seen in coarse lamellar structures. A bimodal distribution of equiaxed and lamellar structures offers the best combination of tensile properties [1,3,8].
2.4 Effect of Impurities
causes embrittlement of titanium alloys by precipitating titanium hydrides when the hydrogen content increases above a critical value. In α+β titanium alloys, these hydrides precipitate more easily due to the lower hydrogen solubility in the α phase. By using an alloy grade of low hydrogen content and by processing in vacuum or an inert atmosphere,
2.5 Referenced Literature
[1] C. Leyens, M. Peters (Eds.), Titanium and Titanium Alloys: Fundamentals and Applications, Wiley, Weinheim, 2003, p. 532.
[2] J. C. Williams, Titanium alloys: production, behavior and application, in: H. M. Flower (Ed.) High Performance Materials in Aerospace, Chapman & Hall, Cambridge, 1995, pp. 85-134.
[3] J. Matthew J. Donachie (Ed.) Titanium: A Technical Guide, ASM, Metals Park, 2000, p. 381.
[4] W. F. Smith, Titanium and Its Alloys, in: Structure and Properties of Engineering Alloys, McGraw-Hill, New York, 1993, p. 630.
[5] Titanium and Titanium Alloys, in: Metals Handbook, vol 9, ASM, Metals Park, 1985, pp. 458-475.
[6] E. O. Hall, Proceedings of the Physical Society of London Section B 64 (1951) 747-753.
[7] N. J. Petch, Journal of the Iron and Steel Institute 174 (1953) 25-28.
Chapter 3
Production of Titanium Alloys
Titanium components are most commonly produced by forging because the microstructure may be easily controlled by deformation and heat treatment. Investment casting is
implemented for manufacturing complex shapes and/or expensive parts [1]. The latest technology for creating near net shape components involves melting metal powder using a laser or electron source.
3.1 Conventional Fabrication Methods
3.1.1 Forging
Forging is used for the fabrication of titanium alloy components because large cross sections and near net shape parts may be created while controlling the microstructure by
thermomechanical processing. The resulting microstructure of forged products depends primarily on the forging temperature, rate of deformation, and cooling rate. The final microstructure also depends on the microstructure of the starting material. The process of producing forging stock begins with cylindrical ingot casts which have been vacuum arc remelted and then hand forged to the desired billet shape. Forging above or below the β
The selected secondary die forging process depends on the preferred microstructure. Forging at temperatures above the β transus produces a colony microstructure which is characterized by clusters of α plates growing in the same direction. These α plates are known to improve the fracture toughness greatly but reduce the fatigue properties. The microstructure may also consist of a continuous α phase at prior β grain boundaries which gives unfavorable
mechanical properties. Another major concern associated with β processing is hydrogen pick up which occurs at high temperatures and leads to hydrogen embrittlement. Forging at
temperatures in the α+β region results in a fine equiaxed primary α structure which provides excellent strength and ductility [1-3]. However, several types of fracture defects may develop from working in the α+β region. Such defects include strain-induced porosity, wedge
cracking at the triple points of β grain boundaries, and the formation of microvoids as a result of high strain rates. In order to avoid cracking, forging in the α+β region is done at 30°C to 100°C below the β transus [3].
One of the major issues with forging titanium is non-uniform heating due to its low
conductivity. Shear cracking is a concern for α+β titanium alloys when working in either the
β or α+β region. This type of defect is caused by non-uniform deformation of the workpiece as a result of the non-uniform heating. Shear bands or shear cracks occur between regions of low and high deformation [3].
3.1.2 Casting
Titanium cast products are formed by melting the alloy in a vacuum furnace or in an inert atmosphere since titanium is highly reactive at high temperatures. The molten metal is poured into a mold of the desired shape. The resultant macrostructure consists of columnar grains solidified from the mold walls and equiaxed grains toward the center [1,4].
Casting of titanium can be difficult since it offers low fluidity and high reactivity thereby leading to casting defects like porosity, shrinkage cavities, and surface defects. Careful selection of the molding materials is required so that the reaction between the molding materials and the molten titanium is limited. Oxide molds such as Al2O2 and ZrO2 are
common investment casting materials for Ti-6Al-4V [4]. However, it is impossible to completely eliminate reactions at the metal-mold interface, and the as-cast material will comprise of an outer layer of unfavorable constituents known as α case. This brittle layer is detrimental to the mechanical properties and must be removed by pickling or machining [1,4]. Ways in which the α case layer thickness may be decreased include increasing the cooling rate, decreasing the temperature of the molten metal, and not preheating the mold [4].
3.2 Solid Freeform Fabrication
3.2.1 Laser Additive Manufacturing
Laser additive manufacturing utilizes a high power laser (CO2 or Nd-YAG) as a heat source
in addition to a computer aided design model for building near net shape components from powdered material in a layer by layer fashion. Typically, this process is performed in an inert atmosphere, such as argon, to reduce oxidation effects. Selective Laser Sintering (SLS) and Laser Engineered Net Shaping (LENS) are the two foremost laser based fabrication
technologies. These processes are similar in that they both raster the desired areas of the powder bed one layer at a time. The layer thickness usually ranges between 50 and 200 microns, depending on the powder size and material. After rastering of one layer is complete, a new layer of powder is spread across the previous layer, and the process is repeated until completion of the final shape [7-9]. Figure 3.1 illustrates how the SLS and LENS systems operate.
The LENS process differs from SLS because it has the ability to feed powder into the melt pool produced by the laser, therefore alloy composition may be adjusted where needed. Originally, high dimensional tolerance parts using SLS were built for manufacturing
polymeric materials, but the process since has broadened its use for producing steels, nickel-based alloys, and α/β titanium alloys [8,9].
Figure 3.1: process [11
Schematic ].
representatio
(a)
(b)
Figure 3.2: Ti-6Al-4V micrograph showing a martensitic structure within columnar grains which are formed parallel to the build direction during the SLS process [14].
The microstructure changes when the processing parameters such as laser power and traverse speed are varied. An increase in the traverse speed results in faster cooling thereby reducing the grain width and refining the microstructure. An increase in the incident energy (laser power divided by traverse speed) results in larger grain size and coarse microstructure. Therefore, a high power and low traverse speed will result in large grains, and a low power and high traverse speed will result in smaller grain size [12-15].
it may be associated with the type of CO2 laser used [15]. Processing parameters must be
aptly adjusted in order to obtain adequate densification of the component. For Ti-6Al-4V alloys, there is a small processing window for optimizing these parameters, and careful consideration is required to ensure that the laser power and traverse speed yield a suitable incident energy for the best densification [13,15].
3.2.2 Electron Beam Melting
Electron Beam Melting (EBM) is similar to laser additive manufacturing in that near net shape components are built in a layer by layer fashion. The difference is that an electron beam is used as an energy source rather than a laser. Electron beam melted parts are
Studi macr struct cross perfo accor which Figure 3.3: ies conducte ostructure ob ture was par
-sectional gr ormed, as we rding to AST
h are illustra
Schematic
d prior to th bserved in th rallel to the g
rowth plane. ell, on rectan TM E8. The ated in Figur
representatio
e current inv he laser assis growth direc
. This is illus ngular tensile specimens w re 3.6.
on of the ele
vestigation r sted solid fre ction, and an strated in Fig e specimens were built fo
ectron beam
evealed the eeform fabri equiaxed st gures 3.4 an with a two-i or three diffe
melting mac
same colum ication syste tructure was d 3.5. Tensil inch gage le erent growth
chine [5].
mnar
m. The colu seen on the le tests were ngth, built
orientations umnar
(a) (b) (c) Figure 3.6: Schematics of rectangular tensile specimens built in the EBM
machine for three different growth orientations: (a) face growth plane, (b) cross-sectional growth plane, and (c) edge growth plane.
The average values for the ultimate tensile strength, yield strength, and percent elongation for the three different growth planes are presented in Table 3.1. A significant difference in tensile properties is found in the edge growth plane specimens, particularly the percent of elongation which is increased by a sizable margin. It is possible that the differences in macrostructure due to the directional solidification effect contributes to the anisotropy of tensile properties, or preferred orientation of the α laths may play a role as well.
Table 3.1: Mechanical properties of electron beam melted Ti-6Al-4V for three different growth orientations.
UTS (MPa)
YS
(MPa) %EL
Growth Plane
1 Face (Growth Plane Normal to Tensile Axis) 1052 973 8 2 Cross-section (Growth Plane Parallel to Tensile Axis) 1082 1028 8 3 Edge (Growth Plane Normal to Tensile Axis) 1082 959 15
freeform fabrication, the processing parameters must be optimized in order to achieve adequate densification.
3.3
Post Processing
Post processing methods are necessary for the optimization of alloy properties. For example, hot isostatic pressing (HIP) is used to improve the strength by eliminating voids which arise from residual shrinkage during solidification. For Ti-6Al-4V components, a standard HIP process occurs around 900°C with an applied pressure of 100 MPa. Hot isostatic pressing allows the material to undergo slight creep deformation in order to relieve cavity stresses but does not change the overall part geometry [1]. This post processing technique is commonly performed after casting, and more recently has been included in the solid freeform fabrication process regime [18].
In order to tailor the microstructure for specific mechanical requirements, various heat treatments are carried out. Time and temperature of the thermal treatment and the cooling rate are the critical factors affecting the final microstructure. In two phase α+β alloys, high strengths and adequate ductility are obtained by heat treating high in the α+β field to produce a bimodal microstructure of large equiaxed α grains in an acicular transformed β
energy thereby delaying crack propagation. The fracture toughness is increased with more colonies of α lamellae [1,2,20,22]. A disadvantage of heat treating above the β transus is the loss of ductility caused by coarsening of the continuous α grain boundary which promotes crack nucleation and fracture as a result of localized strain along the α boundary [1,2,19,20]. The current research aims to improve the tensile properties, specifically ductility, of the EBM as-processed components by post heat treatment. Although some loss of ductility is seen in β
heat treatments, the current study anticipates improved ductility of the EBM components after processing in this region for two reasons:
1. Because preferential growth of α laths occurs due to directional solidification effects, an increase in ductility is expected after β heat treating to remove any preferred orientation by reformation of α grains.
2. An improvement in the tensile properties is possible if, upon cooling from the
3.4 Referenced Literature
[1] C. Leyens, M. Peters (Eds.), Titanium and Titanium Alloys: Fundamentals and Applications, Wiley, Weinheim, 2003, p. 532.
[2] J. C. Williams, Titanium alloys: production, behavior and application, in: H. M. Flower (Ed.) High Performance Materials in Aerospace, Chapman & Hall, Cambridge, 1995, pp. 85-134.
[3] S. L. Semiatin, V. Seetharaman, I. Weiss, Journal of the Minerals Metals & Materials Society 49 (1997) 33-39.
[4] L. Nastac, M. N. Gungor, I. Ucok, K. L. Klug, W. T. Tack, International Journal of Cast Metals Research 19 (2006) 73-93.
[5] J. Hiemenz, EBM Offers a New Alternative for Producing Titanium Parts and Prototypes, in: Time-Compression Technologies, vol 14, Rapid News Publications, UK, 2006.
[6] U. Lindhe, O. Harrysson, Rapid Manufacturing with Electron Beam Melting (EBM) – A manufacturing revolution, in: SME Direct Metal Fabrication Forum, Dearborn, Michigan, USA, 2003, p. 6.
[7] A. Simchi, F. Petzoldt, H. Pohl, International Journal of Powder Metallurgy 37 (2001) 49-61.
[8] G. K. Lewis, E. Schlienger, Materials & Design 21 (2000) 417-423.
[10] J. P. Kruth, P. Mercelis, J. Van Vaerenbergh, L. Froyen, M. Rombouts, Rapid Prototyping Journal 11 (2005) 26-36.
[11] M. Grujicic, G. Cao, R. S. Figliola, Applied Surface Science 183 (2001) 43-57.
[12] J. Mazumder, A. Schifferer, J. Choi, Materials Research Innovations 3 (1999) 118-131. [13] P. A. Kobryn, E. H. Moore, S. L. Semiatin, Scripta Materialia 43 (2000) 299-305. [14] P. A. Kobryn, S. L. Semiatin, Journal of the Minerals Metals & Materials Society 53
(2001) 40-42.
[15] X. Wu, J. Mei, Journal of Materials Processing Technology 135 (2003) 266-270. [16] D. Cormier, Optimization of the electron beam melting process, in: IIE Annual
Conference and Expo, Houston, Texas, USA, 2004.
[17] S. Watakabe, K. Suzuki, K. Nishikawa, ISIJ International 32 (1992) 625-629. [18] S. Das, M. Wohlert, J. J. Beaman, D. L. Bourell, Materials & Design 20 (1999)
115-121.
[19] W. F. Smith, Titanium and Its Alloys, in: Structure and Properties of Engineering Alloys, McGraw-Hill, New York, 1993, p. 630.
[20] J. Matthew J. Donachie (Ed.) Titanium: A Technical Guide, ASM, Metals Park, 2000, p. 381.
Chapter 4
Experimental Methods
Ti-6Al-4V samples were produced by the solid freeform electron beam melting technique. The microstructure of the as-processed samples was altered through post heat treating in order to improve upon the mechanical properties, specifically the ductility. Several analytical techniques were used to compare the as-processed samples to those which were heat treated. The following sections explain the methods used for analysis and the overall design of experiments.
4.1 Methods of Analysis
4.1.1 Mechanical Testing
Figure 4.1: Engineering stress-strain curve typical of metals. The tensile, yield, and fracture strengths are indicated on the curve [1].
The force is converted to engineering stress by the following relationship in which F is the applied load and Ao is the original cross-sectional area of the specimen.
o
A F
σ= (4.1)
Engineering strain is known by the following equation, where Δl is the elongation and lois
the initial gage length [1].
o
l
Δl
The mechanical strength values specified for engineering design purposes include tensile and yield strength. The tensile strength is the maximum stress that a material can withstand while in tension, therefore it is determined by the maximum stress on the engineering stress-strain curve. The yield strength is the stress at which elastic deformation ends and plastic
deformation begins. Because yielding in metals is a gradual transition, a 0.2% strain offset is used to resolve the yield strength. By the offset method, a line is drawn parallel to the elastic region of the stress-strain curve from the 0.002 strain offset, and the point at which the line intersects the stress-strain curve is defined as the yield strength (Figure 4.1) [1].
Another important mechanical property is ductility which is measured by percent elongation or area reduction. The elongation is measured using the extensometer, whereby the final displacement measurement (Δl) is divided by the extensometer gage length (lo).
100% l
Δl %EL= ×
o
(4.3)
The area reduction is determined by fitting the fractured tensile specimen back together and measuring the diameter from which the cross sectional area after fracture (Af) is calculated.
The change in the cross sectional area divided by the original cross sectional (Ao) area gives
the reduction in area [1].
100% A
A A
%RA= f − ×
o
o (4.4)
4.1.2 Scanning Electron Microscopy
Scanning electron microscopy (SEM) is a form of microscopy by which a focused electron beam rasters the area of interest to form an image via detection of secondary and/or
backscattered electrons. Images obtained in the SEM appear to be three-dimensional due to its large depth of focus. SEM imaging capabilities are dependent on the beam parameters and electron optical alignment, which are all interrelated [2]. The major components of an SEM include an electron gun and a set of electromagnetic lenses which are illustrated in Figure 4.2 below.
The microscope column is evacuated so that the electrons have a free path to the sample. The emitted electrons are accelerated through the electron gun and focused to the anode. The beam crossover is demagnified by a pair of condenser lenses to obtain the desired spot size. An objective aperture may be inserted for further demagnification. Below the objective aperture is the objective lens which focuses the beam onto the sample [2].
Essentially, there are three operator controls of SEM lenses: beam current (condenser lens strength), working distance, and aperture size. The beam current controls the final spot size. A strong condenser lens current reduces the spot size which is important for high resolution imaging, although the signal to noise ratio is compromised. A small working distance is also ideal for high resolutions since a smaller working distance allows for greater demagnification of spot size. Longer working distances are needed when a larger depth of focus is desired, however the image resolution diminishes. The depth of focus is improved by the smaller convergence angle achieved at longer working distances. Figure 4.3illustrates how a smaller convergence angle allows more image features at varying heights to appear in focus [2].
The third operator control of the SEM is the aperture size. The aperture size controls the final beam current as well as the convergence angle. A smaller aperture size means a lower beam current and smaller convergence angle which lowers the signal to noise ratio but improves both the resolution and depth of focus [2].
The Hitachi S-3200N scanning electron microscope is used to obtain secondary electron images of the fractured tensile specimens. For optimal focus, fractographs are obtained using conditions for a large depth of focus (i.e., long working distance and small objective
aperture).
4.1.3 X-Ray Diffractometry
X-ray diffraction is used to determine the phases present in the material and their relative amounts. Diffraction occurs in solids as waves interact with a crystalline structure and constructively interfere producing a diffracted beam. At a specified wavelength, diffraction occurs at a particular angle that depends on the interatomic spacing of the material. Bragg’s law, defined below, must be satisfied in order for diffraction to occur.
θ 2dsin
nλ= (4.5)
In Equation 4.5, n is an integer, λ is the wavelength used, d is the interplanar spacing, and θ
is the diffraction angle [3].
Figure 4.4: Example of x-ray diffraction pattern for sodium chloride powder [3].
The characteristic peaks correspond to specific phases and crystal orientations of the material and are indexed for a given diffraction angle using Bragg’s law and the interplanar spacing equation of the crystal structure. The equations of plane spacing for α (hcp) and β (bcc) titanium phases are given below.
α (hcp): 2
2 2 2 2 2 c l a k hk h 3 4 d 1 + ⎟⎟ ⎠ ⎞ ⎜⎜ ⎝ ⎛ + +
= (4.6)
β (bcc): 2
2 2 2 2 a l k h d
1 + +
= (4.7)
Phase analysis was conducted with a Phillips X’Pert Pro MRD (Materials Research Diffractometer) using Cu-Kα radiation (λ = 1.5405 Å). The characteristic peaks were identified, and the relative intensities of the crystal planes were compared.
4.2 Design of Experiments
Ti-6Al-4V PREP powder was used to build cylindrical test specimens in the Arcam A2EBM machine. Tensile specimens were built according to ASTM E8 with a two-inch gage length. However, the samples were built slightly larger in the EBM machine in order to compensate for final machining of the parts. The specimens were built so that the growth direction was perpendicular to the tensile axis.
Table 4.1: Three post processing conditions applied to the EBM as-processed specimens.
Temperature Time Cooling Rate
1 1030°C 1 hr Air quenched 1.1°C/s 2 1030°C 1 hr Furnace cooled
0.1°C/s 3 1030°C 2 hr Furnace cooled
0.1°C/s
A CNC machine was used to remove the rough surface typical of the EBM process. One and a half millimeters were machined off each sample to provide a nice surface finish to
eliminate any nucleation sites for cracks during tensile testing. The dimensions of the final machined part are given in Figure 4.5.
4.3 Referenced Literature
[1] G. E. Dieter, Mechanical Behavior of Materials Under Tension, in: Metals Handbook, vol 8, ASM, Metals Park, 1985.
[2] J. I. Goldstein, D. E. Newbury, P. Echlin, D. C. Joy, C. E. Lyman, E. Lifshin, L. Sawyer, J. R. Michael, Scanning Electron Microscopy and X-Ray Microanalysis, Springer, New York, 2003, p. 690.
Chapter 5
Results and Analysis
5.1 Mechanical Properties
The mechanical properties were determined from the tensile tests performed under a constant motor extension rate of 0.2 in/min. Table 5.1 lists the averages of yield strength and tensile strength along with the percent elongation and reduction of area for each set of samples, including the as-processed and the three different heat treated specimens.
It is important to note that the elongation data is not truly representative since none of the samples broke within the extensometer gage. The samples were slightly tapered by as much as three-thousandths of an inch due to inaccuracy of the machining algorithm (Figure 5.1), therefore no samples failed at the center and instead broke at the narrowed end of the gage length. Even though the elongations are not conclusive, a relative comparison can be made between the as-processed and heat treated specimens. Because the samples broke at a
Figure 5.1: Schematic of the slightly tapered cylindrical tensile specimens after machining.
Comparing data in Table 5.2, the tensile and yield strengths of the electron beam melted process are similar to those provided by wrought and cast products. In the EBM as-processed condition, the strength was significantly higher than all other process conditions, however it is evident from the reduction in area that the ductility suffered. Some ductility is restored upon heat treatment. Of the four EBM process conditions, the specimens treated for one hour and air quenched provided the best reduction in area. Although the area reduction percentage does not meet the standard for wrought products, it does surpass the average value obtained for cast products.
The measured elongations of the EBM products cannot be compared to the wrought or cast conditions since fracture did not occur within the extensometer; however, a relative
Table 5.1: Mechanical properties of electron beam melted Ti-6Al-4V products evaluated using 0.0564 in2 cross-sectional area and compared against wrought and cast products.
UTS
(MPa)
YS
(MPa) %EL %RA
I 1 Electron beam melted 1092
(±6.9)
1047
(±12.5)
5*
(±1.5)
13
(±4.7)
2 βair quenched treated for 1 hr and 955
(±22.6)
870
(±20.5)
7*
(±1.6)
23
(±2.6)
3 βfurnace cooled treated for 1 hr and 970
(±19.0)
866
(±22.9)
5*
(±0.8)
18
(±2.6)
4 βfurnace cooled treated for 2 hr and 991
(±25.8)
871
(±22.5)
5*
(±0.5)
17
(±4.3)
II Cast bar, annealed† 1015 890 10 16
III Wrought bar, annealed† 1000 925 16 34
Table 5.2: Mechanical properties of electron beam melted Ti-6Al-4V products evaluated using 0.0539in2 cross-sectional area and compared against wrought and cast products.
UTS
(MPa)
YS
(MPa) %EL %RA
I 1 Electron beam melted 1143
(±7.2)
1095
(±13.1)
5*
(±1.5)
9
(±4.9)
2 βair quenched treated for 1 hr and 999
(±23.7)
911
(±21.5)
7*
(±1.6)
20
(±2.7)
3 βfurnace cooled treated for 1 hr and 1015
(±19.9)
906
(±24.0)
5*
(±0.8)
14
(±2.8)
4 βfurnace cooled treated for 2 hr and 991
(±25.8)
871
(±21.5)
5*
(±0.5)
13
(±4.5)
II Cast bar, annealed† 1015 890 10 16
III Wrought bar, annealed† 1000 925 16 34
5.2 Fractography
The fracture surfaces of the as-processed and heat treated tensile specimens were examined under an SEM for comparison. Low and high magnification images reveal different fracture modes between that of the as-processed and β heat treated samples.
The columnar grain structure, organized in a perpendicular fashion in Figures 5.2 and 5.3, is fairly distinguishable with tear ridges in the fractographs of the as-processed specimen. At higher magnification small equiaxed dimples are visible, which suggests ductile dimple rupture caused by microvoid coalescence (Figure 5.4). The equaiaxed shape of the dimples indicates failure due to uniaxial tensile overload [1,2].
The columnar bands are not well defined in the fractographs of the heat treated specimens, and a much different fracture surface emerges as seen in Figures 5.5 and 5.6. This type of fracture appears to be a mixed mode of transgranular cleavage along the α (hcp) laths and dimple rupture with tear ridges at the grain boundaries. Also noted is the occurrence of intergranular cleavage cracking. (Intergranular fracture exists in the as-processed specimens too, but transpires by ductile dimple rupture and occurs less frequently). A higher
magnification fractograph of the heat treated condition displays equiaxed and elongated dimples (Figure 5.7). The presence of both types of dimples implies more than one mode of fracture which includes pulling in tension in addition to shearing and/or tensile tearing. Glide plane decohesion steps, signifying plastic rupture, also are noticed in many regions of the heat treated specimens (Figure 5.8) [1,2].
Figure 5.2: F columnar str
Fractograph of T ructure.
Figure 5.3: F (arrow) alon
Fractograph of T g apparent grain
Ti-6Al-4V tensi n boundaries.
Figure 5.4: F small equiax
Fractograph of T xed dimples and
Ti-6Al-4V tensi several large di
ile specimen pro imples.
Figure 5.5: F displaying a noted.
Fractograph of T mixed mode of
Ti-6Al-4V tensi f cleavage and d
ile specimen pro dimple rupture. A
oduced via EBM A cleavage fract
M and β heat trea ture facet (arrow
Figure 5.6: F displaying a observed.
Fractograph of T mixed mode of
Ti-6Al-4V tensi f cleavage and d
ile specimen pro dimple rupture. I
oduced via EBM Intergranular fra
M and β heat trea acture (arrow) is
Figure 5.7: F Equiaxed an
Fractograph of T d elongated dim
Ti-6Al-4V tensi mples are indicat
ile specimen pro ted in regions A
oduced via EBM A and B, respecti
M and β heat trea ively.
Figure 5.8: F Serpentine g boundary in
Fractograph of T glide ridges are s
region B.
Ti-6Al-4V tensi shown in region
ile specimen pro n A, and small eq
oduced via EBM quiaxed dimples
M and β heat trea s occur at the la
5.3 Microscopy
The microstructures of the EBM processes are analyzed to help explain the differences in the mechanical properties. As determined in previous research, the macrostructure of
components produced from EBM consists of columnar grains which run parallel to the build direction. A macrostructure of equiaxed grains are observed at the cross-sectional ends of the columns. Figures 5.9 and 5.10, respectively, display the columnar and equiaxed structures observed in the EBM as-processed Ti-6Al-4V.
The microstructure of the as-processed EBM products consists of fine acicular α (hcp) and intergranular β (bcc) within α (hcp) grain boundaries. This type of microstructure is often referred to as a “basket weave” structure because the α (hcp) grains grow in preferred orientations which appear to be interlacing. The fine α (hcp) structure supports increased strength due to the small slip length path of the acicular microstructure thereby delaying crack nucleation [3-5].
Upon heat treating the EBM specimens above the β transus, the columnar macrostructure is less visible but does remain. It appears that equiaxed grains are formed thereby altering the columnar grain structure, as demonstrated in Figure 5.11, and a mixture of columnar and equiaxed grains occurs along the growth direction of the heat treated specimens. The equiaxed grains may have formed as a result of grain growth during heat treating in which areas of one columnar grain impinged upon the area of a neighboring grain creating a larger grain which was equiaxed.
respectively. Common features for all the experimental heat treatments include coarse α
(hcp) lamellae and blocky α (hcp), although the latter is more prevalent in the furnace cooled samples. Discontinuous and coarse α (hcp) also is seen at the grain boundaries in the
micrographs of the heat treated samples. Large grain boundaries and blocky α (hcp) are crack initiation sites which lead to premature failure and short fatigue life [3,4,6,7]. The large, continuous α phase at the grain boundaries is perhaps the cause of the intergranular fracture noticed in Figure 5.6.
5.4 Phase Analysis
X-ray diffraction was performed for each set of experimental conditions to compare the relative amounts of phases present. PeakFit software was used for analysis of the diffraction curve, and a Gaussian distribution of the peaks was assumed for identifying all possible peaks. Established by Bragg’s law and the crystal structure, a total of ten possible reflections can occur in the 2θ range tested, seven of which belong to the α (hcp) phase, and the
remaining three are the β (bcc) phase. Table 5.3 gives the calculated diffraction angles of the possible crystallographic plane reflections for α (hcp) and β (bcc) phases. The positions of the peaks were determined using the lattice parameters for pure titanium (a = 2.9512 Å, c = 4.6845 Å for α-Ti and a = 3.3066 Å for β-Ti) [8]. The peak positions may be slightly shifted from the calculated values in the x-ray diffraction patterns of the Ti-6Al-4V alloy.
All possible peaks can be seen in the as-processed EBM process in Figure 5.15. The α (hcp) peaks align with the estimated diffraction angles, however the β (bcc) peaks are slightly shifted from the calculated. The calculated and measured diffraction angles of each reflection plane are compared in Table 5.4. Using Bragg’s law (Equation 4.5) and the equation of plane spacing for β (bcc) titanium phase (Equation 4.7), the actual lattice parameter of β (bcc) in Ti-6Al-4V is 3.2230 Å at room temperature, established from the measured data. Therefore, the retained β contracts by as much as 0.0836 Å upon cooling to room temperature in the Ti-6Al-4V alloy.
Table 5.3: Calculated 2θ values for possible reflections in the measured range.
α (hcp) β (bcc)
hkl d (Å) 2θ° hkl d (Å) 2θ°
1 (002) 2.34 38.4 1 (200) 1.65 55.6
2 (110) 1.48 63.0 2 (110) 2.34 38.5
3 (101) 2.24 40.2 3 (211) 1.35 69.7
4 (200) 1.28 74.2
5 (100) 2.56 35.11
6 (102) 1.73 53.0
7 (103) 1.33 70.7
Table 5.4: Comparison of calculated and measured diffraction angles.
α (hcp) β (bcc)
hkl 2θ° hkl 2θ°
Calculated Measured Calculated Measured
1 (002) 38.4 38.4 1 (200) 55.6 57.3
2 (110) 63.0 63.3 2 (110) 38.5 39.4
3 (101) 40.2 40.3 3 (211) 69.7 71.7
4 (200) 74.2 74.4
5 (100) 35.1 35.2
6 (102) 53.0 53.1
7 (103) 70.7 70.8
Figure 5.16: hour and arg
X-ray diffracti gon gas quenche
ion pattern of Ti ed.
i-6Al-4V producced via EBM annd β treated for o
Figure 5.17: hour and furn
X-ray diffracti nace cooled.
Figure 5.18: hours and fu
X-ray diffracti urnace cooled.
5.5 Referenced Literature
[1] V. A. Joshi, Titanium Alloys: An Atlas of Structures and Fracture Features, Taylor & Francis, Boca Raton, 2006, p. 227.
[2] V. Kerlins, Modes of Fracture, in: Metals Handbook, vol 12, ASM, Metals Park, 1985, pp. 12-71.
[3] J. Matthew J. Donachie (Ed.) Titanium: A Technical Guide, ASM, Metals Park, 2000, p. 381.
[4] C. Leyens, M. Peters (Eds.), Titanium and Titanium Alloys: Fundamentals and Applications, Wiley, Weinheim, 2003, p. 532.
[5] R. Filip, K. Kubiak, W. Ziaja, J. Sieniawski, Journal of Materials Processing Technology 133 (2003) 84-89.
[6] J. C. Williams, Titanium alloys: production, behavior and application, in: H. M. Flower (Ed.) High Performance Materials in Aerospace, Chapman & Hall, Cambridge, 1995, pp. 85-134.
Chapter 6
Conclusions
6.1 Summary
For all β treated conditions, the ductility increased compared to the as-processed EBM specimens. The greatest ductility is found in the samples treated in the β region for one hour and argon gas quenched.
Ductile dimple fracture seen in the as-processed condition changes to transgranular cleavage with ductile dimple rupture along the α laths for all heat treatments.
The microstructure contrasted greatly between the as-processed and heat treated specimens. After heat treating above the β transus, the columnar structure is less obvious but does occur. A mixed columnar and equiaxed structure is apparent.
One possible reason for better ductile properties in the heat treated EBM specimens is the presence of a colony microstructure formed upon cooling from the β region. The colony microstructure assists in retarding crack propagation as it creates a tortuous path for cracks.
6.2 Future Work
All tensile testing was performed perpendicular to the EBM growth direction. Further testing with the tensile load applied parallel to the growth direction is required to determine if the increase in ductility from β heat treating occurs along both tensile axes. Quantitative texture analysis using pole figures should be investigated to determine the orientation effects on the deformation behavior for both test directions.
Blocky α and grain boundary coarsening may be minimized by using shorter heating times and/or lower temperatures during heat treatment. On the other hand, longer heating times and slower cooling rates may allow the blocky α to spheroidize creating equiaxed α grains which enhance ductility. Hence, new heat treatment regimes may be considered to test the effects they have on the tensile properties.
Future work also should include the addition of trace amounts of boron to the alloy. Significant grain refinement was found in as-cast Ti-6Al-4V when between 0.1 and 1 weight percent of boron was added to the alloy. The grain refinement is thought to be due to solute partitioning between the β phase and the boron which leads to
constitutional supercooling ahead of the solidification front. A combination of the temperature difference at the liquid/solid interface and the presence of boron promote nuclei formation [1]. Furthermore, equiaxed α has been observed from subsequent heat treatment by slowly cooling from the β region in Ti-6Al-4V-2B alloy. TiB likely promotes additional nucleation sites from which α may grow [2].
6.3 Referenced Literature
[1] S. Tamirisakandala, R. B. Bhat, J. S. Tiley, D. B. Miracle, Scripta Materialia 53 (2005) 1421-1426.
[2] D. Hill, R. Banerjee, D. Huber, J. Tiley, H. L. Fraser, Scripta Materialia 52 (2005) 387-392.
![Figure 2.2: Micrographs of Ti-6Al-4V solution heat treated above the β transus at 1066°C and (a) water quenched (×500) [4], (b) air cooled (×250), and (c) furnace cooled (×250) [5]](https://thumb-us.123doks.com/thumbv2/123dok_us/1645071.1205740/20.612.332.515.107.278/figure-micrographs-solution-treated-transus-quenched-furnace-cooled.webp)
![Figure 3.1: Schematic representatioon of (a) typpical SLS settup [10] and (b) LENS](https://thumb-us.123doks.com/thumbv2/123dok_us/1645071.1205740/29.612.197.435.112.553/figure-schematic-representatioon-typpical-sls-settup-b-lens.webp)
![Figure 3.3: Schematic representatioon of the eleectron beam melting macchine [5].](https://thumb-us.123doks.com/thumbv2/123dok_us/1645071.1205740/32.612.212.403.114.325/figure-schematic-representatioon-eleectron-beam-melting-macchine.webp)
![Figure 4.3: Schematic representation of the depth of focus in an SEM image [2].](https://thumb-us.123doks.com/thumbv2/123dok_us/1645071.1205740/46.612.225.407.447.619/figure-schematic-representation-depth-focus-sem-image.webp)