Accelerated Protein Evolution and Origins of Human-Specific Features:
FOXP2 as an Example
Jianzhi Zhang,
1David M. Webb and Ondrej Podlaha
Department of Ecology and Evolutionary Biology, University of Michigan, Ann Arbor, Michigan 48109 Manuscript received August 15, 2002
Accepted for publication September 6, 2002
ABSTRACT
Genes responsible for human-specific phenotypes may have been under altered selective pressures in human evolution and thus exhibit changes in substitution rate and pattern at the protein sequence level. Using comparative analysis of human, chimpanzee, and mouse protein sequences, we identified two genes (PRM2 and FOXP2) with significantly enhanced evolutionary rates in the hominid lineage. PRM2 is a histone-like protein essential to spermatogenesis and was previously reported to be a likely target of sexual selection in humans and chimpanzees. FOXP2 is a transcription factor involved in speech and language development. Human FOXP2 experienced a⬎60-fold increase in substitution rate and incorporated two fixed amino acid changes in a broadly defined transcription suppression domain. A survey of a diverse group of placental mammals reveals the uniqueness of the human FOXP2 sequence and a population genetic analysis indicates possible adaptive selection behind the accelerated evolution. Taken together, our results suggest an important role that FOXP2 may have played in the origin of human speech and demonstrate a strategy for identifying candidate genes underlying the emergences of human-specific features.
I
N spite of the relative young age of our species, we molecular technology, calls have been made for system-have many distinct morphological, physiological, atic searches for genes that make us human (Gibbons and behavioral features that are not found in apes, most 1998;McConkeyet al.2000).notably, bipedalism, a large brain, susceptibility to AIDS, We tackle this problem by comparing the rate of pro-speech, and higher-order cognitive function (Boydand tein sequence evolution in the human lineage (since Silk2000;McConkeyet al.2000;Varki2000;Gagneux the human-chimpanzee split) with that in nonhuman and Varki 2001). Understanding how and why these mammals. This comparison is useful because pheno-and other features unique to humans evolved is a key type-affecting genetic modifications can be subject to to disclosing the mystery of human origins and is of sub- positive Darwinian selection, under which the rate of stantial medical importance (Gibbons1998;McConkey amino acid substitution can be greatly enhanced (Nei
et al.2000;Varki2000). Fortunately, most of the genetic and Kumar 2000). A change in substitution rate may bases of these features lie somewhere in theⵑ3 billion also result when the function of a protein shifts so that nucleotides of our genome, a huge, albeit limited, pool the selective pressure is either enhanced or relaxed (Nei in which to look for answers. Gagneux and Varki andKumar2000). In the following, we report identifi-(2000) recently reviewed genetic differences between cation of two genes with significant rate enhancements humans and great apes. Although many genetic changes in the hominid lineage and discuss their relevance to that have occurred in the human lineage have been the origins of human-specific features.
found, including chromosomal fusion, gene duplica-tion, gene deletion/inactivaduplica-tion, nucleotide
substitu-tion, and change in gene expression, very few, if any, of MATERIALS AND METHODS these changes have been linked to specific phenotypes
Database search: In our design of the rate comparison, important to the origin and well being of our species
orthologous protein sequences from humans (Homo sapiens), (Gibbons 1998;Gagneux andVarki 2001). With the chimpanzees (Pan troglodytes), and, as an outgroup, mice (Mus availability of the human draft genome sequence, accu- musculus) are used (Figure 1A). Use of mice rather than pri-mates for the outgroup makes the estimate of the substitution mulation of ape DNA sequences, and rapid advances in
rate less subjective to sampling errors because a long-term average is obtained. Also many more genes have been se-quenced and functionally characterized for the mouse than
Sequence data from this article have been deposited with the
for any other nonhuman mammal. It has been suggested that
EMBL/GenBank Data Libraries under accession nos. AY143178–
the average amino acid substitution rate is higher in rodents
AY143181 and AF539547–AF539550.
than in primates (Gu and Li 1992; but see Easteal et al.
1Corresponding author:Department of Ecology and Evolutionary
Biol-1995). This will likely make our detection of accelerated
hu-ogy, University of Michigan, 3003 Nat. Sci. Bldg., 830 N. University
Ave., Ann Arbor, MI 48109. E-mail: [email protected] man protein evolution more conservative. Here we focus on
orthologous genes because a change in substitution rate after Computer simulation:To determine the frequency of type-I error (false-positive results) in the binomial test described gene duplication (Lynch andConery2000) would
compli-cate our analysis. Ideally, no gene duplication should be al- above, we conducted a computer simulation. In the simula-tion, a constant substitution rate is used for branches 1, 3, lowed in any branches of the tree of human, chimpanzee,
and mouse (Figure 1A). However, duplications occurring in and 4. Let this rate bersubstitutions per amino acid site per million years (MY). Substitution rate variation among sites branches 5 and 2 have virtually no effects on our results, as
we are largely concerned with branches 1, 3, and 4. Duplica- does not affect the simulation result, asrcan also be regarded as the average substitution rate over the entire sequence. Given tions in branch 4, or the rodent-specific duplications, have
only small effects because a basal substitution rate in mammals the length of a protein (namino acids), the number of substi-tutions in branch 1 is a Poisson random variable with mean⫽ can still be estimated relatively accurately. All annotated gene
sequences in GenBank were screened to find cases satisfying 5.5nrand that for the branches 3 ⫹4 is a Poisson variable with mean⫽174.5nr. These two random numbers were gener-the above criteria. Specifically, all annotated chimpanzee gene
sequences were retrieved from the GenBank. The translated ated by computer and the binomial test was performed to see if the null hypothesis of rate constancy could be rejected. protein sequences were BLASTed against the GenBank
data-base to find the closest human and mouse sequences. Various Such simulations were repeated 5000 times for each given parameter ofnr.ChenandLi (2001) estimated that the aver-sources of information and analyses, including previous
evolu-tionary analyses of the genes (ChenandLi2001), functional age substitution rate between humans and chimpanzees isr⫽ 0.013/(11 MY) ⫽0.00118 substitutions per amino acid site data, UniGene search, human/mouse homology maps, and
phylogenetic analysis, were used to determine that the se- per million years. The average length for the 120 proteins examined in this study isⵑn⫽350 amino acids. Thus, average quences are orthologous and that no gene duplications have
occurred in branches 1 and 3 of the tree in Figure 1A. Never- nr is ⵑ350 ⫻ 0.00118 ⫽ 0.413 substitutions per sequence per million years for orthologous proteins of humans and theless, it is possible that some cases may still have undetected
duplications in branch 1 or 3 or may include paralogous genes, chimpanzees. In fact, the averagenrfor the 120 genes, which was 0.323, may also be computed from theappendix. Consid-due to incomplete genome sequences of human and mouse
and limited genetic information on the chimpanzee. This ering that nr varies from 0 to 1.41 for the 120 genes, our simulation was conducted under a wide range ofnr, from 0.04 did not have serious effects on our results because we were
interested mainly in the very few cases showing significant to 4.
FOXP2 DNA sequencing and analysis:All 17 exons of the rate changes; additional experiments and analyses could be
conducted after initial identification of candidate genes. FOXP2 gene from the chimpanzee, pygmy chimpanzee, go-rilla, and orangutan were PCR amplified and sequenced in
Obtaining new chimpanzee sequences:In addition to the
sequences retrieved from GenBank, we sequenced the coding both directions. The orthologous human (accession no. AF33-regions of five chimpanzee genes for which the orthologous 7817) and mouse (accession nos. AY079003 and NT_023632) human and mouse sequences were available in GenBank. The sequences were obtained from GenBank. The orthology of five genes are BRCA2, CATSPER, FOXP2, RNASE4, and RNH. the FOXP2 sequences was confirmed by phylogenetic analysis PCR primers were designed following the known human se- and observation of expected levels of synonymous nucleotide quences and the chimpanzee genes were amplified by PCR distances. Parsimony (Fitch1971) and distance-based Bayes-and sequenced in both directions using automated DNA se- ian (ZhangandNei1997) methods were used to infer num-quencer. bers of synonymous and nonsynonymous nucleotide
substitu-Rate analysis:The obtained protein sequences were aligned tions (NeiandKumar2000) in the FOXP2 gene tree of the using Clustal X (Thompsonet al.1997) and gaps were removed above six species.
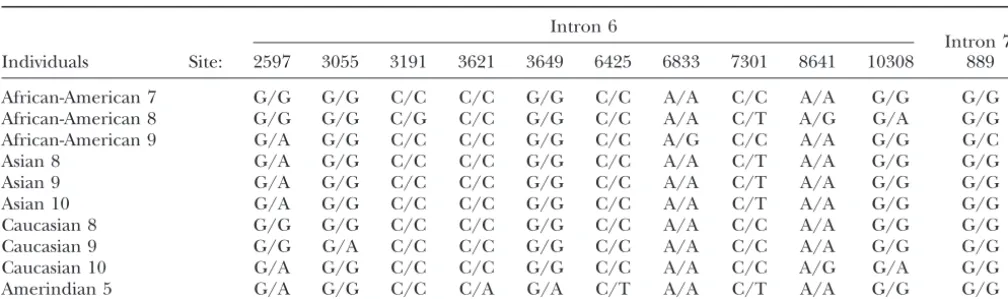
before rate analysis. Aligned proteins with lengths (before To determine the variability of the amino acid positions in removal of gaps) of ⬍100 amino acids were discarded. For which humans experienced substitutions, part of exon 7 of each protein, the numbers of amino acid substitutions in FOXP2 was PCR amplified and sequenced in both directions branches 1, 2, and 3⫹4 are denoted byh,c, andm, respectively from an additional 24 mammals and the chicken (see Figure (Figure 1A). These numbers were derived from branch length 3). The same region was also sequenced in 32 human individu-estimates of the tree of orthologous human, chimpanzee, and als to determine the polymorphism at the aforementioned mouse proteins. The branch lengths were estimated using amino acid positions.
the neighbor-joining method (SaitouandNei1987). Several For population genetic analysis, 8679 nucleotides in intron distance measures were used, including the proteinp-distance, 6 and 1305 nucleotides in intron 7 of the FOXP2 gene were Poisson distance, and gamma distance with the shape parame- sequenced in both directions in 10 human individuals. All ter of 2.0 (equivalent to Dayhoff distance; Nei and Kumar singletons were confirmed from a second PCR reaction and 2000). The results were found to be similar and p-distance sequencing. Nucleotide diversity () and Watterson’swere results are presented as this distance is associated with a rela- computed as described in Tajima (1989). Tajima’s (1989) tively low variance. Primates and rodents divergedⵑ90 million and Fu and Li’s (1993) tests were conducted using 50,000 years ago (MYA;KumarandHedges1998;Archibaldet al. coalescent simulations. To test the neutral evolution hypothe-2001;Neiet al.2001) and humans separated from chimpan- sis for the polymorphic data of FOXP2, we compiled available zees ⵑ5.5 MYA (Chen and Li2001; Stauffer et al. 2002). data on worldwide polymorphisms in other noncoding regions An acceleration index for the human lineage (branch 1) in of the human genome that are at least 3000 nucleotides long comparison to the mammalian lineage before the human- and are not known to be under selection. Six data sets were chimpanzee split (branch 3⫹4) is defined by ⫽(h/5.5)/ found and the Hudson-Kreitman-Aguade´ (HKA) test ( Hud-[m/(2⫻90⫺5.5)]⫽31.7h/m. In other words, if a protein sonet al.1987) was used to compare FOXP2 with these neutral evolves with a constant rate (i.e., ⫽1), the number of amino sequences. DnaSP (RozasandRozas1999) was used for all acid substitutions in branch 3⫹4 (m) is expected to be 31.7 population genetic analyses.
times greater than that in branch 1 (h). Givenhandm, the tail probability in a binomial distribution ofB(h⫹m, 0.03056) is computed for testing the statistical significance of rate
en-RESULTS AND DISCUSSION hancement in the human lineage. Here, 0.03056 is from 5.5/
180, the time span for branch 1, relative to that for branches
Identification of proteins with accelerated evolution
1⫹3⫹4. Similarly, an acceleration index for the chimpanzee
TABLE 1
Type-I error of the binomial test of rate constancy
nr Error rate (%) False positives
0.04 0.12 0.14
0.08 0.16 0.19
0.4 0.14 0.17
2 0.20 0.24
4 0.30 0.36
Parameternris the number of substitutions per sequence per million years. The averagenris 0.323 for the 120 genes examined in this study. Error rate gives the frequency of sig-nificant cases atP⬍0.003 in simulations. False positives are expected numbers of false-positive cases in 120 genes, derived from simulation results.
were false-positive cases. For this, we conducted a com-puter simulation. As described in the above section, our simulations were designed to examine the type-I error of the binomial test. The results suggest that the expected number of false-positive cases isⰆ1 for our sample of 120 genes (Table 1). Thus, our positive detection is unlikely due to statistical artifact.
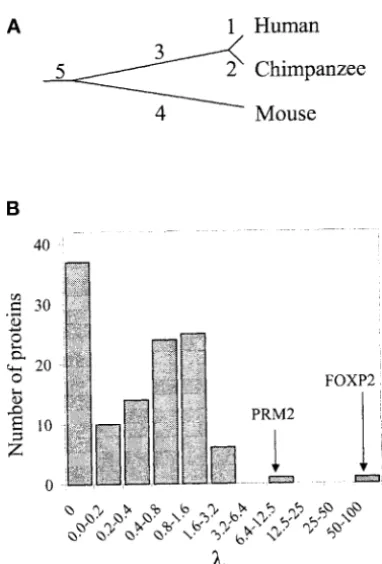
Figure 1.—In search of accelerated protein evolution in The two positive cases, PRM2 and FOXP2, are listed the human lineage. (A) A gene tree of orthologous human,
in Table 2. PRM2 (protamine 2) is a DNA-binding pro-chimpanzee, and mouse proteins. Branches are named by the
tein that replaces histones in spermatogenesis. It has numbers. Only cases with no gene duplications in branches
been shown to evolve rapidly in humans and chimpan-1 and 3 are considered in this work. (B) Frequency distribution
of, the acceleration index for human proteins. Two of the zees and was suggested to be a likely target of sexual 120 analyzed proteins have no substitutions in any branches selection (Wyckoffet al. 2000). Thus, it is not unex-and are not included in the distribution.
pected that PRM2 is identified in our analysis. However, the fact that both human and chimpanzee lineages ex-perienced accelerated evolution (andare both sig-above section, we identified 115 genes from GenBank
nificantly ⬎1) suggests that the type of selection on and obtained 5 additional genes from our laboratory
PRM2 is probably not unique to humans. In contrast, that were suitable for the rate analysis. Figure 1B shows
FOXP2 has the highest(63.4) of all genes examined, the distribution of the acceleration indexfor the 120
whileis 0 (Table 2), suggesting hominid-specific accel-genes. Results from each of the 120 genes are given in
eration. We thus focus our analysis on FOXP2 in the theappendix. The meanis 1.13⫾0.54 and the
me-remainder of the article. dian is 0.39. The distribution is skewed because no
Enhanced substitution rate of human FOXP2:FOXP2
amino acid substitutions are found in the human
lin-belongs to the winged helix/forkhead class of transcrip-eage in about one-third (39/120⫽0.325) of the genes
tion factors (Laiet al. 2001; Shuet al. 2001). It is ex-examined. A majority of the genes have ⬍3.2. Only
pressed in multiple fetal and adult tissues with a high two genes havesignificantly⬎1 (P⬍0.003 andP⬍
expression in certain regions of the fetal brain (Laiet
0.001, respectively; binomial test). Since 120 tests were
conducted, it was necessary to evaluate whether there al.2001;Shuet al.2001). Mutations in the gene cause
TABLE 2
Proteins with significantly enhanced rates of evolution in the human lineage
No. of
Protein name amino acids h c m P() P()
FOXP2 714 2 0 1 63.40 0.00 0.003 NS
Protamine 2 (PRM2) 97 6.5 3.5 27.5 7.49 4.03 ⬍0.001 0.041
Figure
2.—Amino
acid
sequence
alignment
of
FOXP2
genes
from
human,
great
apes,
and
mouse.
Dots
represent
identical
residues
to
the
human
sequence,
while
dashes
represent
gaps.
The
two
a
mino
acid
substitutions
in
humans
(in
boldface
type)
are
both
in
exon
7
.
The
FOX
domain
is
boxed
a
nd
the
b
roadly
defined
transcription
repression
domain
is
underlined
with
the
zinc-finger
domain
italicized.
The
alignment
of
the
poly(Q)
region
is
a severe speech and language disorder in affected indi-viduals despite their adequate intelligence and opportu-nity for language acquisition, suggesting that FOXP2 is specifically involved in speech development (Laiet al.
2001). FOXP2 is a conserved protein, with only three amino acid differences (and a 1-amino-acid insertion/ deletion) between human and mouse in its entire length of 715 amino acids (Figure 2). We sequenced the coding regions of the FOXP2 gene from the chimpanzee, pygmy chimpanzee, gorilla, and orangutan and deter-mined that two of the three aforementioned tions occurred in the hominid lineage and no substitu-tions occurred in chimpanzees (Figure 2). As indicated in Table 2, the acceleration in the evolution of human FOXP2 is statistically significant. This significance is also obtained (P⫽ 0.001–0.006) when we consider ranges of divergence times for the human-chimpanzee split at 4.0–7.0 MYA (Chenand Li 2001; Brunetet al. 2002; Stauffer et al. 2002) and the primate-rodent split at 80–110 MYA (KumarandHedges1998;Archibaldet al.2001;Neiet al.2001).
The two amino acid substitutions in the human lin-eage are a Thr-to-Asn change at position 303 and an Asn-to-Ser change at position 325, both in exon 7. These
Figure 3.—Uniqueness of the human FOXP2 sequence. substitutions are located in a broadly defined
transcrip-Shown here are the amino acids from the chicken and 29 tion repression domain (Shuet al.2001; Figure 2), so mammals at the two positions where humans experienced it is possible that they affect the binding of FOXP2 substitutions.
with regulatory sequences of its target genes. If these substitutions are important to speech development, they
in the lineage before the human-chimpanzee separation should be fixed in normal humans and not be found
([2.5⫹ 4.5 ⫹ 127.5]/[90 MY ⫻ 2 ⫺ 5.5 MY]⫽ 0.77 in nonhuman organisms. Indeed, these substitutions
for the branches linking node A and mouse; see Figure are shared by all 32 normal humans surveyed (9 African
4). Thus, there is no indication of enhanced mutation Americans, 10 Caucasians, 9 Asians, and 4
Amerindi-rate at FOXP2 in the human lineage. This conclusion ans), but by none of the 29 nonhuman species
exam-is strengthened as the true number of synonymous sub-ined. These species include a bird and 28 placental
stitutions is likely to be higher than the parsimony esti-mammals from 12 representative orders (Figure 3).
In-mate for the long branch leading to the mouse, but terestingly, the Asn-to-Ser substitution also occurred
in-not for the short branches within hominoids. Use of dependently in carnivores, suggesting that this
substitu-Bayesian estimates of ancestral sequences confirmed tion alone is not sufficient for the origin of speech and
language.
Driving forces behind the accelerated evolution of
human FOXP2:It would be interesting to identify the
driving force behind the two amino acid substitutions and the accelerated evolution of human FOXP2. There are three possibilities: enhanced mutation rate, relaxed purifying selection, and positive selection. Because syn-onymous nucleotide changes are usually immune to selection, the rate of synonymous substitutions can be used to measure the mutation rate (Nei and Kumar 2000). Using parsimony, we determined the number of
synonymous substitutions in each branch of the FOXP2 Figure 4.—Nucleotide substitutions in the evolution of FOXP2. The number of nonsynonymous substitutions fol-gene tree of five hominoids and mouse (Figure 4). It can
lowed by the number of synonymous substitutions is given for be seen that the number of synonymous substitutions in
each branch. The numbers of amino acid changes equal those the human lineage (two) is smaller than that in the two
of nonsynonymous substitutions. The amino acid change in chimpanzee lineages (three and four, respectively). The the mouse lineage was from Asp to Glu at position 80 and number of synonymous substitutions per MY is also the one in the orangutan lineage was from Ala to Val at
TABLE 3
Allelic sequences of 10 humans at polymorphic sites of FOXP2 introns 6 and 7
Intron 6
Intron 7: Individuals Site: 2597 3055 3191 3621 3649 6425 6833 7301 8641 10308 889
African-American 7 G/G G/G C/C C/C G/G C/C A/A C/C A/A G/G G/G African-American 8 G/G G/G C/G C/C G/G C/C A/A C/T A/G G/A G/G African-American 9 G/A G/G C/C C/C G/G C/C A/G C/C A/A G/G G/C
Asian 8 G/A G/G C/C C/C G/G C/C A/A C/T A/A G/G G/G
Asian 9 G/A G/G C/C C/C G/G C/C A/A C/T A/A G/G G/G
Asian 10 G/A G/G C/C C/C G/G C/C A/A C/T A/A G/G G/G
Caucasian 8 G/G G/G C/C C/C G/G C/C A/A C/C A/A G/G G/G
Caucasian 9 G/G G/A C/C C/C G/G C/C A/A C/C A/A G/G G/G
Caucasian 10 G/A G/G C/C C/C G/G C/C A/A C/C A/G G/A G/G Amerindian 5 G/A G/G C/C C/A G/A C/T A/A C/T A/A G/G G/G
Sites refer to the positions in the sequences of human introns 6 and 7, respectively. Only parts of the two introns are examined. The haplotypes are undetermined.
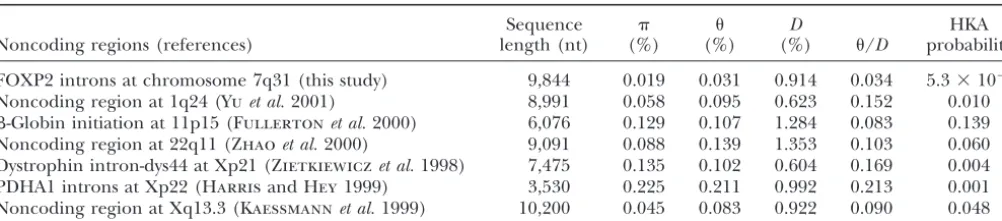
this result. Furthermore, the ratio of nonsynonymous et al.1987) yielded a very significant result when FOXP2 introns were compared with all other regions combined substitutions to synonymous substitutions in the human
lineage (2/2⫽ 1; see Figure 4) is significantly greater (P⬍0.00001; Table 4). When these regions were com-pared individually with FOXP2, all indicated a lower-than the ratio in the branches linking node A and mouse
(1/[2.5 ⫹ 4.5 ⫹ 127.5] ⫽ 0.007; P ⬍ 0.002, Fisher’s than-expected polymorphism in FOXP2 and four out of six cases showed statistical significance (Table 4). exact test; Zhanget al.1997), suggesting that the rate
difference is due to a difference in selection. It is un- Mutation-rate variation among loci would not result in significant HKA test results (Hudsonet al.1987). Popu-likely, however, that the functional constraint and
puri-fying selection on FOXP2 has been relaxed in humans, lation demographic changes cannot explain them ei-ther, because they would have affected all loci in a simi-as mutations show severe deleterious effects (Laiet al.
2001). Consistent with the existence of strong purifying lar way (Hudsonet al.1987). Rather, these comparisons suggest background selection and/or selective sweeps. selection, no amino acid polymorphisms in FOXP2 were
found in a survey of 48 humans (Newburyet al.2002). Here background selection refers to purifying selection on deleterious mutations in tightly linked exons and Thus, positive selection remains as the most likely cause
of the accelerated evolution of human FOXP2. selective sweep refers to quick fixation of advantageous mutations in these exons. These events, if recent We noted, however, that the rate ratio of
nonsynony-mous to synonynonsynony-mous substitutions per site is not⬎1 in enough, can lead to a reduced present-day polymor-phism in introns 6 and 7 (Maynard SmithandHaigh the human FOXP2 lineage. This is likely due to the fact
that FOXP2 is an overall conserved protein and many 1974;Charlesworthet al.1993). Consistent with the HKA test results,Tajima’sD(⫺1.36,P⫽0.076) andFu sites are under purifying selection. Under such
circum-stances, population genetic data may provide useful in- andLi’sF* (⫺1.81,P⫽0.064) are both negative for the FOXP2 intron data, although they are only marginally formation on the evolutionary force. We therefore
se-quenced 9984 nucleotides in introns 6 and 7 of the significant. Note that these tests are conservative as a recombination rate of zero was assumed in the coales-FOXP2 gene from 10 humans (3 African-Americans,
3 Caucasians, 3 Asians, and 1 Amerindian) and one cent simulation.
If the nonneutral pattern of introns 6 and 7 is due chimpanzee (Table 3). Introns 6 and 7 are adjacent to
exon 7, where the two amino acid substitutions occurred to background selection, the selection intensity must be high, because weak background selection is known to in humans (Figure 2). By tight linkage to exon 7, these
intron sequences may preserve information on the fixa- be ineffective in reducing the polymorphic level. This suggests that the adjacent exons must be under strong tion process of the amino acid changes. For comparison,
we also compiled available data on worldwide polymor- functional constraints with no relaxed purifying selec-tion, which would imply that positive selection is the phisms in other noncoding regions of the human
ge-nome that are at least 3000 nucleotides long and are only possible explanation for the accelerated protein evolution. If a relatively recent selective sweep caused not known to be under selection. We found that the
level of polymorphism is lower in FOXP2 introns than the low polymorphism, at least one of the two amino acid changes in exon 7 must be advantageous because in any other neutral noncoding regions examined
TABLE 4
Intra- and interspecific DNA sequence variations in noncoding regions of the human genome
Sequence D HKA
Noncoding regions (references) length (nt) (%) (%) (%) /D probability
FOXP2 introns at chromosome 7q31 (this study) 9,844 0.019 0.031 0.914 0.034 5.3⫻10⫺6
Noncoding region at 1q24 (Yuet al.2001) 8,991 0.058 0.095 0.623 0.152 0.010 -Globin initiation at 11p15 (Fullertonet al.2000) 6,076 0.129 0.107 1.284 0.083 0.139 Noncoding region at 22q11 (Zhaoet al.2000) 9,091 0.088 0.139 1.353 0.103 0.060 Dystrophin intron-dys44 at Xp21 (Zietkiewiczet al.1998) 7,475 0.135 0.102 0.604 0.169 0.004 PDHA1 introns at Xp22 (HarrisandHey1999) 3,530 0.225 0.211 0.992 0.213 0.001 Noncoding region at Xq13.3 (Kaessmannet al.1999) 10,200 0.045 0.083 0.922 0.090 0.048
nt, nucleotide., nucleotide diversity per site; for X chromosome data, it is corrected by multiplication by 4/3., Watterson’s estimate of polymorphism per site; for the X chromosome, it is corrected by multiplication by 4/3.D, number of nucleotide differences per site between human and chimpanzee sequences. HKA probability, probability from the HKA test, with comparison to the FOXP2 intron data. The first row is the result from the comparison between FOXP2 and all other regions combined.
are located within 100 kb of FOXP2 exon 7. Taken Perspective:In this study we focused on identification of proteins with accelerated evolution in the hominid together, unless positive selection is invoked, one
can-lineage. Other strategies that may also be used in the not explain the accelerated evolution of FOXP2 protein
search for genetic bases of uniquely human features and low polymorphism of introns simultaneously. The
include identifying human genes that are under positive finding that FOXP2 is critical to speech and language
selection, human-specific gene duplications, deletions or development (Laiet al.2001) does not by itself
demon-deactivations, and changes in gene expression (Gag-strate the role of this gene in the origin of human
neux and Varki 2001; Enard et al. 2002). Different speech, because the function of FOXP2 could have
re-from these methods, our approach is useful when the mained unchanged during human evolution while
phenotype-affecting genetic changes are simple amino other speech-related genes changed. However, the
reve-acid substitutions. Our computer simulation showed lation of significant acceleration and positive selection
that unless the substitution rate per sequence (nr) is in human FOXP2 suggests functional and fitness
rele-high, our rate-constancy test is quite conservative. While vance of the two amino acid substitutions and provides
this property somewhat reduces the power of our ap-support for the role of this gene in the evolution of
proach, it also makes our claims more secure. In other speech and language. Interestingly, the notion of
selec-words, the positively identified cases will have a high tion is consistent with the belief that the origin of
lan-chance to be biologically meaningful. At present, only guage is an adaptation (PinkerandBloom1990;Boyd
a small number of chimpanzee genes have been se-andSilk 2000). In the future, it would be interesting
quenced, and only 120 genes, orⵑ0.35% of the genome, to examine the exact functional effects of the two amino
have been analyzed here. As the chimpanzee genome acid substitutions of human FOXP2 byin vitroassays of
sequencing project (Fujiyama et al. 2002) proceeds, protein function as well as characterization of human
many more genes affecting uniquely human features phenotypes of reverse mutations.
may be found by this and other methods. If the lower-than-expected nucleotide diversity in
FOXP2 introns suggested by HKA tests andDand F* We thank S. Hinshaw, A. Rooney, P. Tucker, S. Yokoyama, Y. Zhang, and the University of Michigan Museum of Zoology Mammal Division
statistics is indeed a result of a relatively recent selective
for providing DNA and animal tissue samples. We thank M. Nei, P.
sweep, the sweep probably occurred no earlier than
Tucker, and two anonymous reviewers for their comments on earlier
0.5Ngenerations ago, because the signal of a sweep is versions of the manuscript. This work was supported by a startup fund unlikely to last longer than that (Simonsenet al.1995). of the University of Michigan to J.Z.
HereNis the effective population size of humans and is generally thought to have beenⵑ10,000 (Takahata
LITERATURE CITED 1993). Thus, the sweep would have occurred no earlier
than 5000 generations, or ⵑ100,000 years, ago. This Archibald, J. D., A. O. AverianovandE. G. Ekdale, 2001 Late Cretaceous relatives of rabbits, rodents, and other extant
euthe-estimate is within the wide window of 40,000 years to 4
rian mammals. Nature414:62–65.
MYA during which human languages are believed to Boyd, B., andJ. B. Silk, 2000 How Humans Evolved. W. W. Norton, have emerged (BoydandSilk 2000). A paleo-popula- New York.
Brunet, M., F. Guy, D. Pilbeam, H. T. MacKaye, A. Likiuset al.,
tion genetic study (Lambertet al.2002) may more
accu-2002 A new hominid from the Upper Miocene of Chad, Central
rately define the timing and process of the two amino Africa. Nature418:145–151.
Charlesworth, B., M. T. MorganandD. Charlesworth, 1993
The effect of deleterious mutations on neutral molecular varia- several distantly related organisms. Proc. Natl. Acad. Sci. USA
tion. Genetics134:1289–1303. 98:2497–2502.
Chen, F. C., andW. H. Li, 2001 Genomic divergences between Newbury, D. F., E. Bonora, J. A. Lamb, S. E. Fisher, C. S. Laiet al., humans and other hominoids and the effective population size 2002 FOXP2 is not a major susceptibility gene for autism or of the common ancestor of humans and chimpanzees. Am. J. specific language impairment. Am. J. Hum. Genet.70:1318–1327.
Hum. Genet.68:444–456. Pinker, S., andP. Bloom, 1990 Natural language and natural
selec-Easteal, S., C. ColletandD. Betty, 1995 The Mammalian Molecular tion. Behav. Brain Sci.13:707–784.
Clock. R. G. Landes, Austin, TX. Rozas, J., andR. Rozas, 1999 DnaSP version 3: an integrated
pro-Enard, W., P. Khaitovich, J. Klose, S. Zollner, F. Heissiget al., gram for molecular population genetics and molecular evolution 2002 Intra- and interspecific variation in primate gene expres- analysis. Bioinformatics15:174–175.
sion patterns. Science296:340–343. Saitou, N., andM. Nei, 1987 The neighbor-joining method: a new
Fitch, W. M., 1971 Toward defining the course of evolution: mini- method for reconstructing phylogenetic trees. Mol. Biol. Evol. mum change for a specific tree topology. Syst. Zool.20:406–416. 4:406–425.
Fu, Y. X., andW. H. Li, 1993 Statistical tests of neutrality of muta- Shu, W., H. Yang, L. Zhang, M. M. LuandE. E. Morrisey, 2001
tions. Genetics133:693–709. Characterization of a new subfamily of winged-helix/forkhead
Fujiyama, A., H. Watanabe, A. Toyoda, T. D. Taylor, T. Itohet (Fox) genes that are expressed in the lung and act as transcrip-al., 2002 Construction and analysis of a human-chimpanzee tional repressors. J. Biol. Chem.276:27488–27497.
comparative clone map. Science295:131–134. Simonsen, K. L., G. A. ChurchillandC. F. Aquadro, 1995
Proper-Fullerton, S. M., J. Bond, J. A. Schneider, B. Hamilton, R. M. ties of statistical tests of neutrality for DNA polymorphism data. Hardinget al., 2000 Polymorphism and divergence in the beta- Genetics141:413–429.
globin replication origin initiation region. Mol. Biol. Evol.17: Stauffer, R. L., A. Walker, O. A. Ryder, M. Lyons-WeilerandS. B. 179–188.
Hedges, 2002 Human and ape molecular clocks and constraints
Gagneux, P., andA. Varki, 2001 Genetic differences between
hu-on palehu-ontological hypotheses. J. Hered.92:469–474. mans and great apes. Mol. Phylogenet. Evol.18:2–13.
Tajima, F., 1989 Statistical method for testing the neutral mutation
Gibbons, A., 1998 Which of our genes makes us human? Science
hypothesis by DNA polymorphism. Genetics123:585–595. 281:1432–1434.
Takahata, N., 1993 Allelic genealogy and human evolution. Mol.
Gu, X., andW. H. Li, 1992 Higher rates of amino acid substitution
Biol. Evol.10:2–22. in rodents than in humans. Mol. Phylogenet. Evol.1:211–214.
Thompson, J. D., T. J. Gibson, F. Plewniak, F. JeanmouginandD. G. Harris, E. E., andJ. Hey, 1999 X chromosome evidence for ancient
Higgins, 1997 The CLUSTAL_X windows interface: flexible human histories. Proc. Natl. Acad. Sci. USA96:3320–3324.
strategies for multiple sequence alignment aided by quality
analy-Hudson, R. R., M. KreitmanandM. Aguade, 1987 A test of neutral
sis tools. Nucleic Acids Res.25:4876–4882. molecular evolution based on nucleotide data. Genetics 116:
Varki, A., 2000 A chimpanzee genome project is a biomedical imper-153–159.
ative. Genome Res.10:1065–1070.
Kaessmann, H., F. Heissig, A. von HaeselerandS. Paabo, 1999
Wyckoff, G. J., W.Wangand C. IWu, 2000 Rapid evolution of DNA sequence variation in a non-coding region of low
recombi-male reproductive genes in the descent of man. Nature403: nation on the human X chromosome. Nat. Genet.22:78–81.
304–309.
Kumar, S., andS. B. Hedges, 1998 A molecular timescale for
verte-Yu, N., Z. Zhao, Y. X. Fu, N. Sambuughin, M. Ramsayet al., 2001 brate evolution. Nature392:917–920.
Global patterns of human DNA sequence variation in a 10-kb
Lai, C. S., S. E. Fisher, J. A. Hurst, F. Vargha-KhademandA. P.
region on chromosome 1. Mol. Biol. Evol.18:214–222.
Monaco, 2001 A forkhead-domain gene is mutated in a severe
Zhang, J., and M. Nei, 1997 Accuracies of ancestral amino acid speech and language disorder. Nature413:519–523.
sequences inferred by the parsimony, likelihood, and distance
Lambert, D. M., P. A. Ritchie, C. D. Millar, B. Holland, A. J.
methods. J. Mol. Evol.44(Suppl. 1): S139–S146.
Drummondet al., 2002 Rates of evolution in ancient DNA from
Zhang, J., S. KumarandM. Nei, 1997 Small-sample tests of episodic Adelie penguins. Science295:2270–2273.
adaptive evolution: a case study of primate lysozymes. Mol. Biol.
Lynch, M., andJ. S. Conery, 2000 The evolutionary fate and
conse-quences of duplicate genes. Science290:1151–1155. Evol.14:1335–1338.
Maynard Smith, J., andJ. Haigh, 1974 The hitch-hiking effect of Zhao, Z., L. Jin, Y. X. Fu, M. Ramsay, T. Jenkinset al., 2000 World-a fWorld-avorWorld-able gene. Genet. Res.23:23–35. wide DNA sequence variation in a 10-kilobase noncoding region
McConkey, E. H., R. Fouts, M. Goodman, D. Nelson, D. Pennyet on human chromosome 22. Proc. Natl. Acad. Sci. USA97:11354–
al., 2000 Proposal for a human genome evolution project. Mol. 11358.
Phylogenet. Evol.15:1–4. Zietkiewicz, E., V. Yotova, M. Jarnik, M. Korab-Laskowska, K. K.
Nei, M., andS. Kumar, 2000 Molecular Evolution and Phylogenetics. Kiddet al., 1998 Genetic structure of the ancestral population
Oxford University Press, New York. of modern humans. J. Mol. Evol.47:146–155.
Nei, M., P. XuandG. Glazko, 2001 Estimation of divergence times
Communicating editor: S.Yokoyama
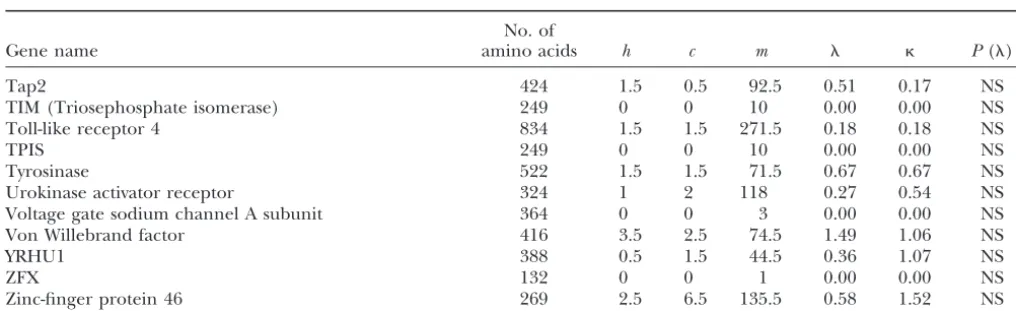
APPENDIX
Evolutionary rate analysis of 120 orthologous proteins of human, chimpanzee, and mouse
No. of
Gene name amino acids h c m P()
␣-2-HS-glycoprotein 345 3 4 126 0.75 1.01 NS
␣-Fetoprotein 605 2.5 2.5 204.5 0.39 0.39 NS
Androgen receptor 882 1.5 1.5 91.5 0.52 0.52 NS
Angiogenin 143 0 1 37 0.00 0.86 NS
Angiotensin II type-1 receptor 359 1 0 19 1.67 0.00 NS
Angiotensinogen 475 2 2 184 0.34 0.34 NS
Apolipoprotein H precursor 345 1.5 1.5 78.5 0.61 0.61 NS
Apoliprotein E 309 5 3 77 2.06 1.24 NS
Atrophin-1 291 0 0 34 0.00 0.00 NS
-1,3-Galactosyltransferase 1 326 0 0 1 0.00 0.00 NS
-1,3-Galactosyltransferase 5 294 2.5 2.5 77.5 1.02 1.02 NS
nerve growth factor 240 2.5 0.5 33.5 2.37 0.47 NS
-2-Microglobulin 119 0 0 38 0.00 0.00 NS
Blue opsin 345 0 0 48 0.00 0.00 NS
Brain natriuretic protein 121 0.5 1.5 89.5 0.18 0.53 NS
BRCA1 1101 15.5 7.5 486 1.01 0.49 NS
BRCA2a 1569 10 8 736 0.43 0.34 NS
C5a anaphylatoxin chemotactic receptor (C5aR) 337 1.5 1.5 110.5 0.43 0.43 NS
CATSPERa 400 4.5 3.5 309.5 0.46 0.36 NS
C-C chemokine receptor type 5 352 2 0 60 1.06 0.00 NS
CD22 329 4.5 6.5 145.5 0.98 1.42 NS
CD4 453 1.5 3.5 197.5 0.24 0.56 NS
CD55 decay accelerating factor 338 3.5 3.5 167.5 0.66 0.66 NS
CD81 236 0 0 19 0.00 0.00 NS
CMP-N-acetylneuraminic acid hydroxylase 473 2.5 1.5 34.5 2.30 1.38 NS C-myc(Myc proto-oncogene) 438 1.5 0.5 34.5 1.38 0.46 NS
Coagulation factor IX 449 0.5 0.5 78.5 0.20 0.20 NS
Complement CI inhibitor 113 0 0 25 0.00 0.00 NS
Complement C2 748 0.5 3.5 177.5 0.09 0.63 NS
Complement C4 170 1.5 2.5 19.5 2.44 4.06 NS
Complement C5a receptor 339 1.5 1.5 113.5 0.42 0.42 NS
Complement receptor 1 427 3.5 1.5 183.5 0.60 0.26 NS
Connexin 36 237 0 0 6 0.00 0.00 NS
CXC chemokine receptor 4 352 0 0 30 0.00 0.00 NS
Cystic fibrosis transmembrane conductance 230 2 0 66 0.96 0.00 NS
Cyt oxidase subunit 4 144 0 0 31 0.00 0.00 NS
Cytochrome C 105 0 0 9 0.00 0.00 NS
DEAD box protein 5 111 0 0 3 0.00 0.00 NS
DEAF-1 related transcriptional regulator protein 565 0.5 4.5 35.5 0.45 4.02 NS
Decay-acceleration factor 305 4 3 146 0.87 0.65 NS
Dombrock protein 261 1.5 1.5 157.5 0.30 0.30 NS
Dopamine 4 receptor 92 0 1 18 0.00 1.76 NS
ELAC 2 817 6 3 128 1.49 0.74 NS
Epcilon globin 147 0 0 27 0.00 0.00 NS
Epithelial sodium channel 637 3 4 399 0.24 0.32 NS
Fetuin-A 345 3 4 124 0.77 1.02 NS
Formyl peptide receptor 348 0.5 3.5 82.5 0.19 1.34 NS
FOXP2a 714 2 0 1 63.40 0.00 0.003
Fut1 365 2.5 2.5 79.5 1.00 1.00 NS
Fut2 338 2.5 0.5 62.5 1.27 0.25 NS
Fut3 351 2 3 214 0.30 0.44 NS
G-protein-coupled receptor GPR15 353 0 0 255 0.00 0.00 NS G-protein-coupled receptor STRL33 340 1.5 0.5 223.5 0.21 0.07 NS
GASZ 475 1 3 69 0.46 1.38 NS
Glucocerebrosidase 515 0.5 0.5 68.5 0.23 0.23 NS
APPENDIX (Continued)
No. of
Gene name amino acids h c m P()
Histamine H1 receptor 485 3.5 1.5 110.5 1.00 0.43 NS
Histamine H2 receptor 358 0 0 26 0.00 0.00 NS
Histaminen-methyltransferase 117 1 0 20 1.59 0.00 NS
Histo blood group ABO 185 1.5 0.5 91.5 0.52 0.17 NS
Homeobox protein OPTX2 165 0 0 0 NA NA NS
Homeobox protein OTX1 243 0 0 4 0.00 0.00 NS
ICAM-1 (Intercellular adhesion molecule-1) 503 9 7 222 1.29 1.00 NS
Ig epsilon-chain 411 7.5 5.5 216.5 1.10 0.81 NS
Insulin 105 0.5 1.5 20.5 0.77 2.32 NS
Intercellular adhesion molecule cd54 503 9 7 222 1.29 1.00 NS
Interferon gamma 133 0.5 0.5 80.5 0.20 0.20 NS
Interleukin 16 133 0.5 0.5 80.5 0.20 0.20 NS
Interleukin 3-precursor 142 0.5 0.5 96.5 0.16 0.16 NS
Interleukin 4-receptor 506 3 5 239 0.40 0.66 NS
Interleukin receptor 8-B 352 0 2 101 0.00 0.63 NS
Involucrin 464 13.5 11.5 311.5 1.37 1.17 NS
Leptin 146 0 1 22 0.00 1.44 NS
Lipoprotein lipase (2-longer) 331 0 0 18 0.00 0.00 NS
l-Selectin 371 0.5 0.5 337.5 0.05 0.05 NS
Lysozyme c 148 0 0 35 0.00 0.00 NS
Melanocortin 1 receptor 315 3.5 5.5 72.5 1.53 2.40 NS
Melanocortin 5 receptor (mc5R) 325 2 0 62 1.02 0.00 NS
Mitogen-activated protein kinase kinase 393 0 4 4 0.00 31.70 NS Muscarinic acetylcholine receptor m2 (acm2) 440 0 0 16 0.00 0.00 NS Muscarinic acetylcholine receptor m3 (acm3) 588 1 1 47 0.67 0.67 NS
Myoglobin 153 0 1 17 0.00 1.86 NS
N-formyl peptide receptor-like 2 347 1.5 2.5 123.5 0.39 0.64 NS
OTX2 113 0 0 0 NA NA NS
p68 RNA helicase 109 0 0 1 0.00 0.00 NS
PE24 (prostaglandin E2 subtype EP4 receptor) 485 1.5 0.5 53.5 0.89 0.30 NS Poly(A)-binding protein cytoplasmic 5 119 0 0 2 0.00 0.00 NS
Prion 252 1 1 24 1.32 1.32 NS
Protamine 2 97 6.5 3.5 27.5 7.49 4.03 ⬍0.001
Pyrin 155 2 1 137 0.46 0.23 NS
Pyruvate dehydrogenase E1 alpha 1 135 0 0 1 0.00 0.00 NS
Relaxin 113 0.5 2.5 52.5 0.30 1.51 NS
Renin 401 0 0 117 0.00 0.00 NS
Retinoblastoma protein 1 881 3 1 73 1.30 0.43 NS
Rh type B glycoprotein 455 2 2 66 0.96 0.96 NS
Rh50 glycoprotein 409 3 4 90 1.06 1.41 NS
Ribonuclease inhibitor (RHN)a 455 2.5 2.5 121.5 0.65 0.65 NS
Ribonuclease K6 148 0.5 0.5 81.5 0.19 0.19 NS
RNase1 149 2 2 43 1.47 1.47 NS
RNase4 (RNL4)a 147 0.5 0.5 23.5 0.67 0.67 NS
SCAA (Amiloride-sensitive sodium channel␣-subunit) 628 3 4 374 0.25 0.34 NS
Serotonin receptor 1F 364 0 0 20 0.00 0.00 NS
Serotonin receptor 1A 421 1 2 48 0.66 1.32 NS
Serotonin receptor 1B 386 0 0 27 0.00 0.00 NS
Serotonin receptor 2A 245 0 1 18 0.00 1.76 NS
Sox9 507 0 1 13 0.00 2.44 NS
Sp100-HMG nuclear autoantigen 215 3 3 171 0.56 0.56 NS
SRY 143 1 2 72 0.44 0.88 NS
Stress-activated protein kinase 2a 360 0 0 16 0.00 0.00 NS Stress-activated protein kinase 4 356 1 0 15 2.11 0.00 NS
APPENDIX (Continued)
No. of
Gene name amino acids h c m P()
Tap2 424 1.5 0.5 92.5 0.51 0.17 NS
TIM (Triosephosphate isomerase) 249 0 0 10 0.00 0.00 NS
Toll-like receptor 4 834 1.5 1.5 271.5 0.18 0.18 NS
TPIS 249 0 0 10 0.00 0.00 NS
Tyrosinase 522 1.5 1.5 71.5 0.67 0.67 NS
Urokinase activator receptor 324 1 2 118 0.27 0.54 NS
Voltage gate sodium channel A subunit 364 0 0 3 0.00 0.00 NS
Von Willebrand factor 416 3.5 2.5 74.5 1.49 1.06 NS
YRHU1 388 0.5 1.5 44.5 0.36 1.07 NS
ZFX 132 0 0 1 0.00 0.00 NS
Zinc-finger protein 46 269 2.5 6.5 135.5 0.58 1.52 NS
The number of amino acids was counted after removal of alignment gaps.h, number of amino acid changes in branch 1 (see Figure 1A).c, number of amino acid changes in branch 2.m, number of amino acid changes in branches 3 and 4.and , acceleration index (see text for definitions). NA, not applicable; NS, not significant.P(), tail probability in the binomial test of rate constancy.