Abstract
HORTON, AARON M. Novel Reactive Dyes Based on Pyrimidine and Quinoxaline Systems. (Under the direction of Dr. Harold S. Freeman and Dr. David Hinks).
While reactive dyes have been the subject of much of the dye chemistry literature in the past 50 years, emphasis has moved from the search for new reactive systems and chromagens to novel dyes based on modifications to commercially successful technology. In this regard, researchers at North Carolina State University examined the Teegafix dyes developed using linking groups such as cysteamine to convert commercial dichlorotriazine (DCT) dyes to bis-DCT and bis-MCT dyes and found that these dyes have higher dye-fiber affinity that the corresponding commercial precursors. This work was subsequently
extended to heterobifunctional MCT/VS systems using DCT commercial dyes as the starting point. However, it remained to be determined whether the properties of other reactive
systems could be enhanced using the Teegafix dye approach.
With this in mind, the present study pertains to the synthesis and evaluation of novel reactive dyes based on commercial pyrimidine and quinoxaline reactive systems. The synthesis of the target dyes involved a 2-step modification starting with either
SO3Na N N NaOOC O N NH SO3Na HN O N N Cl Cl NaO3S N N COONa O N HN NaO3S H N O N N S S SO3Na N N NaOOC O N NH SO3Na N H O N N S S NH2 H2N HN HN N N N N Cl F F Cl F F Commercial Yellow
Two step modification of a commercial yellow dichloroquinoxaline reactive dye.
N HN SO3Na NaO3S N N NaO3S N H HO3SOH2CH2CO2S N N F F Cl NH2 O N HN
SO3Na NaO3S
N N
NaO3S
N H HO3SOH2CH2CO2S
N N
S
S Cl NH2 O
N NH NaO3S SO3Na N N SO3Na N H SO2CH2CH2OSO3H N N S S Cl NH2 O NH HN NH2 NH2 Cl F F Cl F F Commercial Blue
O N HN NaO3S O N H N N F F Cl SO3Na O N HN NaO3S O N H N N S S Cl SO3Na O N NH SO3Na O N H N N S S Cl NaO3S
H2N H N N N F F Cl Commercial Red H2N HN N N F F Cl
Two step modification of a commercial red chlorodifluoropyrimidine reactive dye.
In this study, the affinity of the modified dyes has been assessed using equilibrium exhaustion studies. Studies conducted on both commercial and target dyes at two
temperatures and four salt concentrations indicated that the target dyes had greater affinity on cotton than the corresponding commercial dyes. Laboratory scale dyeings were
Novel Reactive Dyes Based on Pyrimidine and Quinoxaline Systems
by
Aaron Michael Horton
A thesis submitted to the Graduate Facility of North Carolina State University
in partial fulfillment of the requirements for the Degree of
Master of Science
Textile Chemistry
Raleigh, North Carolina 2009
APPROVED BY:
____________________________ ____________________________
Dr. Harold S. Freeman Dr. David Hinks
Chair Advisory Committee Co-Chair Advisory Committee
____________________________ ____________________________
Dr. Jeffrey Thompson Dr. Malgorzata Szymczyk
ii
Dedication
iii
Biography
Aaron Michael Horton was born on May 15, 1984, to Lee and Barbara Horton. He has two older brothers, Tim and Chris. He graduated in 2002 from Wake Forest-Rolesville High School in Wake Forest, North Carolina. Aaron graduated Cum Laude with a American Chemical Society certified Bachelor of Science degree in Polymer and Color Chemistry in 2006 from North Carolina State University. He then returned to North Carolina State
University to pursue a Master of Science degree in Textile Chemistry in the fall of 2006. On, July 26, 2008 he married his high school love, Allyson Horton of Wake Forest, North
iv
Acknowledgments
I would like to thank Dr. Harold S. Freeman for his direction and patience throughout this work. A special thank you to Dr. Malgorzata Szymczyk for her direction and help in dye synthesis. Also thank you to Mr. Jeffery Krauss and Ms. Judy Elson for their knowledge and expertise in laboratory dye procedures. I would also like to thank Dr. Lina Cardenas, Ms. Rebecca Klossner, and Ms. Reid Clonts for their friendship and support during this work.
v
Table of Contents
List of Figures... x
List of Tables ... xiv
1 Introduction ... 1
2 Literature Review ... 2
2.1 Cellulose ... 2
2.1.1 Cellulose Structure ... 2
2.1.2 Affinities/Effects of Liquids ... 5
2.1.2.1 Water ... 5
2.1.2.2 Organic Liquids ... 5
2.1.2.3 Aqueous Alkali ... 6
2.1.3 Degradation of Cellulose ... 6
2.1.3.1 Acidic Degradation ... 6
2.1.3.2 Alkaline Degradation ... 7
2.1.3.3 Oxidative Degradation ... 7
2.1.3.4 Thermal Degradation ... 8
2.1.3.5 Enzymatic Degradation ... 9
2.2 Analytical Methods ... 9
2.2.1 Chromatography ... 9
2.2.1.1 Liquid Chromatography ... 10
2.2.1.2 High Performance Liquid Chromatography ... 12
vi
2.2.2 Mass Spectrometry ... 16
2.2.2.1 Gas-phase Methods ... 17
2.2.2.2 Desorption Methods ... 18
2.2.3 Ultraviolet and Visible Spectroscopy ... 19
2.3 Dyes for Cotton ... 21
2.3.1 Covalent Bond Formation ... 21
2.3.2 Reactive Dye Structure ... 22
2.3.2.1 Chromagen ... 23
2.3.2.2 Solubilizing Group ... 25
2.3.2.3 Bridging Groups ... 26
2.3.2.4 Reactive Group ... 26
2.3.2.4.1 Nucleophilic Substitution ... 27
2.3.2.4.1.1 S-Triazine System ... 28
2.3.2.4.1.2 Pyrimidine System ... 29
2.3.2.4.1.3 Quinoxaline System ... 30
2.3.2.4.2 Nucleophilic Addition ... 31
2.3.2.4.2.1 β-Substituted Ethyl Sulfone/Vinyl Sulfone ... 31
2.3.2.4.3 Leaving Group ... 32
2.3.2.4.3.1 Chlorine ... 32
vii
2.3.2.4.3.3 Quaternary Amine ... 33
2.3.3 Functionality ... 34
2.3.3.1 Monofunctional ... 34
2.3.3.2 Homobifunctional ... 34
2.3.3.3 Heterobifunctional ... 35
2.3.3.4 Polyfunctional ... 35
2.3.4 Key Reactions ... 36
2.3.4.1 Dye-Fiber Bond Formation ... 36
2.3.4.2 Hydrolysis ... 36
2.4 Project Proposal ... 37
3 Experimental ... 42
3.1 General ... 42
3.2 Syntheses ... 43
3.2.1 Dye Intermediates ... 43
3.2.1.1 Temperature and pH Study ... 43
3.2.1.1.1 Intermediate 4 ... 43
3.2.1.1.2 Intermediate 5 ... 43
3.2.1.1.3 Intermediate 6 ... 44
3.2.1.2 Cysteamine:Dye Ratio Study ... 44
3.2.1.2.1 Red Intermediate 10 ... 44
viii
3.2.1.2.3 Intermdiate 6 ... 45
3.2.2 Target Dyes ... 46
3.2.2.1 Modified Red Dye (11) ... 46
3.2.2.2 Modified Yellow Dye (8) ... 46
3.2.2.3 Modified Blue Dye (9) ... 46
3.3 HPLC Analysis ... 46
3.4 Mass Spectrometric Analysis ... 47
3.5 Equilibrium Exhaustion Study ... 48
3.5.1 Sample Preparation ... 49
3.5.2 Dyebath Analysis ... 49
3.6 Laboratory Dyeings ... 50
3.6.1 Washing Procedure ... 50
3.6.2 Exhaust Dyeing ... 51
3.6.2.1 Liquor Ratio 40:1 ... 51
3.6.2.2 Liquor Ratio 10:1 ... 52
3.6.2.3 Liquor Ratio 20:1 ... 52
3.6.3 Pad Batch Dyeing ... 53
3.6.4 Pad Steam Dyeing ... 53
3.7 K/S and L*a*b* Analysis ... 54
3.8 Fastness Testing ... 54
3.8.1 Colorfastness to Laundering (Accelerated Test) ... 54
ix
3.9 Calculations ... 55
3.9.1 Exhaustion of Equilibrium Exhaustion ... 55
3.9.2 Substantivity Ratio (K’) ... 55
3.9.3 Standard Affinity (-Δμ) ... 55
3.9.4 Heat of Dyeing (-ΔH) ... 56
4 Results and Discussion ... 57
4.1 Commercial Dyes ... 57
4.2 Synthesis of Reaction Intermediates ... 59
4.2.1 Effects of pH and Temperature ... 59
4.2.2 Effects of Cysteamine:Dye Ratio ... 70
4.3 Dye Synthesis ... 78
4.4 Equilibrium Exhaustion ... 85
4.4.1 Absorption Spectra ... 85
4.4.2 Exhaustion Values ... 88
4.4.3 Substantivity Ratio ... 98
4.4.4 Affinity (-Δμ) ... 101
4.4.5 Heats of Dyeing, ΔH ... 108
4.5 Laboratory Dyeings ... 110
4.5.1 Exhaust Dyeings ... 111
4.5.2 Pad-Batch Dyeing ... 111
4.5.3 Pad-Steam Dyeing ... 112
4.6 L*a*b* and K/S Values ... 112
4.6.1 Equilibrium Exhaustion ... 113
x
4.7 Fastness Testing ... 114
4.7.1 Fastness to Laundering (Accelerated) ... 114
4.7.2 Fastness to Crocking ... 115
5 Conclusions ... 116
6 References ... 117
xi
List of Figures
Figure 2.1. Cellulose polymeric structure showing AGP unit, cellobiose unit, reducing end
group and non-reducing end group. ... 3
Figure 2.2. Perhydroxyl ion formation under basic conditions. ... 8
Figure 2.3. Electrospray mass spectrometer apparatus [18]. ... 19
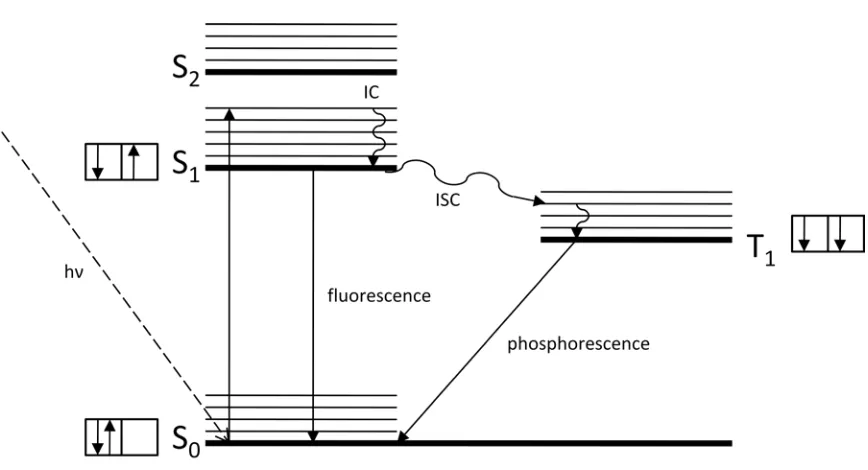
Figure 2.4. Jablonski diagram showing electron excitation pathways. ... 20
Figure 2.5. Structures of pyrimidine, quinoxaline, and pyridine, from left to right. ... 22
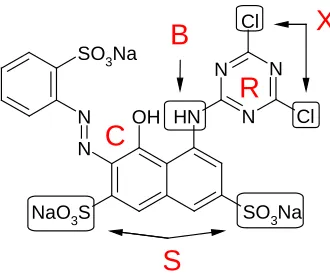
Figure 2.6. Reactive Red 1 showing dye features of reactive dyes. ... 23
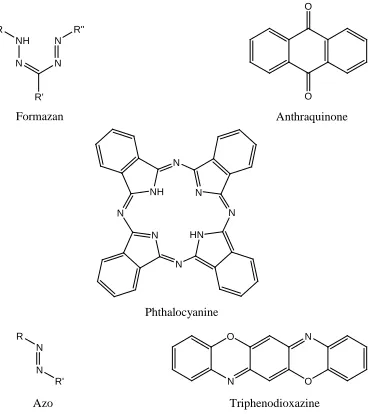
Figure 2.7. Chromophoric systems utilized in reactive dyes. ... 25
Figure 2.8. Nucleophilic substitution on the triazine system. ... 27
Figure 2.9. Fixation and hydrolysis reactions of dichlorotriazine dyes. ... 29
Figure 2.10. Reaction of tetrachloropyrimidine resulting in an isomeric mixture. ... 30
Figure 2.11. Reaction of chlorocarbonyl to produce dichloroquinoxaline dye. ... 31
Figure 2.12. Reversible masking and fixation reactions of sulfatoethylsulfone. ... 32
Figure 2.13. Proposed scheme for Reactive Red 123 modification. ... 39
Figure 2.14. Proposed scheme for Reactive Yellow 25 modification. ... 40
Figure 2.15. Proposed scheme for Reactive Blue 225 modification. ... 41
Figure 4.1. HPLC results of Reactive Red 123 (1). ... 57
Figure 4.2. HPLC results of Reactive Yellow 25 (2). ... 58
Figure 4.3. HPLC results of Reactive Blue 225 (3). ... 58
Figure 4.4. Monosubstituted product between Reactive Red 123 and cysteamine. ... 59
Figure 4.5. HPLC results from combining Reactive Red 123 and cysteamine at pH 4 and 50°C. ... 60
Figure 4.6. HPLC results from combining Reactive Red 123 and cysteamine at pH 5 and 50°C. ... 61
xii
Figure 4.8. HPLC results from combining Reactive Red 123 and cysteamine at pH 7 and 50°C. ... 62 Figure 4.9. Monosubstituted intermedaite of Reactive Yellow 25. ... 63 Figure 4.10. HPLC results from combining Reactive Yellow 25 and cysteamine at pH 4 and
50°C. ... 63 Figure 4.11. HPLC results from combining Reactive Yellow 25 and cysteamine at pH 5 and
50°C. ... 64 Figure 4.12. HPLC results from combining Reactive Yellow 25 and cysteamine at pH 6 and
50°C. ... 64 Figure 4.13. HPLC results from combining Reactive Yellow 25 and cysteamine at pH 7 and
50°C. ... 65 Figure 4.14. HPLC results from combining Reactive Blue 225 and cysteamine at pH 4 and
50°C. ... 66 Figure 4.15. HPLC results from combining Reactive Blue 225 and cysteamine at pH 5 and
50°C. ... 66 Figure 4.16. HPLC results from combining Reactive Blue 225 and cysteamine at pH 6 and
50°C. ... 67 Figure 4.17. HPLC results from combining Reactive Blue 225 and cysteamine at pH 7 and
50°C. ... 67 Figure 4.18. HPLC results from the cysteamine and Reactive Yellow 25 reaction, pH 7,
initially at 20°C and then raised to 50°C. ... 69 Figure 4.19. HPLC results from the cysteamine and Reactive Blue 225 reaction, pH 7,
initially at 20°C and then raised to 50°C. ... 69 Figure 4.20. HPLC results from reaction involving a 1:1 cysteamine:dye 1 ratio at pH 5 and
50°C. ... 71 Figure 4.21. HPLC results from reaction involving a 2:1 cyteamine:dye 1 ratio at pH 5 and
50°C. ... 71 Figure 4.22. HPLC results from reaction involving 1:1 cysteamine:dye 1 ratio at pH 7 and
50°C. ... 72 Figure 4.23. HPLC results from reaction involving 2:1 cysteamine:dye 1 ratio at pH 7 and
50°C. ... 72 Figure 4.24. HPLC results from reaction involving 1:1 cysteamine:dye 2 ratio at pH 5 and
xiii
Figure 4.25. HPLC results from reaction involving 2:1 cysteamine:dye 2 ratio at pH 5 and
50°C. ... 74
Figure 4.26. HPLC results from reaction involving 1:1 cysteamine:dye 2 ratio at pH 7 and 50°C. ... 74
Figure 4.27. HPLC results from reaction involving 2:1 cysteamine:dye 2 ratio at pH 7 and 50°C. ... 75
Figure 4.28. HPLC results from reaction involving 1:1 cysteamine:dye 3 ratio at pH 5 and 50°C. ... 76
Figure 4.29. HPLC results from reaction involving 2:1 cysteamine:dye 3 ratio at pH 5 and 50°C. ... 76
Figure 4.30. HPLC results from reaction involving 1:1 cysteamine:dye 3 ratio at pH 7 and 50°C. ... 77
Figure 4.31. HPLC results from reaction involving 2:1 cysteamine:dye 3 ratio at pH 7 and 50°C. ... 77
Figure 4.32. HPLC results of optimized Reactive Red 123 percursor (10). ... 78
Figure 4.33. HPLC results of optimized Reactive Yellow 25 precursor (5). ... 79
Figure 4.34. HPLC results of optimized Reactive Blue 225 precursor (6). ... 79
Figure 4.35. Positive ion ESI mass spectra of Red Intermediate 10. ... 81
Figure 4.36. Negative ion ESI mass spectra of Red Final Dye 11. ... 81
Figure 4.37. Positive ion ESI mass spectra of Yellow Intermediate 5. ... 82
Figure 4.38. Negative ion ESI mass spectra of Yellow Final Dye 8. ... 82
Figure 4.39. Pyrimidine Modified Red 123 structure. ... 83
Figure 4.40 HPLC results from Pyrmidine Modified Reactive Red 123 dye 11. ... 83
Figure 4.41 HPLC results from Pyrimidine Modified Reactive Yellow 25 dye 8. ... 84
Figure 4.42 HPLC results from Pyrimidine Modified Reactive Blue 225 dye 9. ... 84
Figure 4.43. UV/Visible spectrum of Reactive Red 123 (1). ... 86
Figure 4.44. UV/Visible spectrum of Reactive Yellow 25 (2). ... 86
Figure 4.45. UV/Visible spectrum of Reactive Blue 225 (3). ... 87
xiv
Figure 4.47. UV/Visible spectrum of Pyrimidine Modified Reactive Yellow 25 (8). ... 88
Figure 4.48. Calibration curve for Reactive Red 123 at 504 nm. ... 89
Figure 4.49. Calibration curve for Reactive Yellow 25 at 419 nm. ... 90
Figure 4.50. Calibration curve for Reactive Blue 225 at 603 nm. ... 90
Figure 4.51. Calibration curve for Pyrimidine Modified Red 123 at 505 nm. ... 91
Figure 4.52. Calibration curve for Pyrimidine Modified Yellow 25 at 376 nm. ... 91
Figure 4.53. Calibration curve for Pyrimidine Modified Blue 225 at 598 nm. ... 92
Figure 4.54. Equilibrium exhaustion values for Reactive Red 123 (1) at 0.5-2.0% dyebath concentrations. ... 93
Figure 4.55. Equilibrium exhaustion values for Reactive Yellow 25 (2) at 0.5-2.0% dyebath concentrations. ... 94
Figure 4.56. Equilibrium exhaustion values for Reactive Blue 225 (3) at 0.5-2.0% dyebath concentrations. ... 95
Figure 4.57. Equilibrium exhaustion values for Pyrimidine Modified Red 123 (11) at 0.5-2.0% dyebath concentrations. ... 96
Figure 4.58. Equilibrium exhaustion values for Pyrimidine Modified Yellow 25 (8) at 0.5-2.0% dyebath concentrations. ... 97
Figure 4.59. Equilibrium exhaustion values for Pyrimidine Modified Blue 225 (9) at 0.5-2.0% dyebath concentrations. ... 98
Figure 4.60. Calculated affinities for Reactive Red 123 (1) at 0.5-2.0% owf. ... 103
Figure 4.61. Calculated affinities for Reactive Yellow 25 (2) at 0.5-2.0% owf. ... 104
Figure 4.62. Calculated affinitiesfor Reactive Blue 225 (3) at 0.5-2.0% owf. ... 105
Figure 4.63. Calculated affinities for Pyrimidine Modified Red123 (11) at 0.5-2.0% owf. ... 106
Figure 4.64. Calculated affinities for Pyrimidine Modified Yellow 25 (8) at 0.5-2.0% owf. .. 107
xv
List of Tables
Table 3.1. Gradient elution component composition for HPLC analysis. ... 47
Table 3.2. Aliquot and dilution volumes based on dyebath concentration. ... 49
Table 3.3. Washing procedure used in this study. ... 50
Table 3.4. Ahiba® Texomat program procedure employed. ... 51
Table 3.5. Ahiba Nuance program procedure employed. ... 52
Table 4.1. Optimum conditions for synthesizing dye precursors (5, 6, and 10). ... 78
Table 4.2. Absorption maxima dyes prepared in this study. ... 85
Table 4.3.Calculated K' values for Reactive Red 123 (1) at 0-70 g/L salt. ... 100
Table 4.4. Calculated K' values for Reactive Yellow 25 (2) at 0-70 g/L salt. ... 100
Table 4.5. Calculated K' values for Reactive Blue 225 (3) at 0-70 g/L salt. ... 100
Table 4.6. Calculated K' values for Pyrimidine Modified Red 123 (11) at 0-70 g/L salt. ... 100
Table 4.7. Calculated K' values for Pyrimidine Modified Yellow 25 (8) at 0-70 g/L salt. ... 101
Table 4.8. Calculated K' values for Pyrimidine Modified Blue 225 (9) at 0-70 g/L salt. ... 101
Table 4.9. Heats of Dyeing, ΔH (kJ/mol), results for Reactive Red 123 (1) at varying salt levels. ... 109
Table 4.10. Heats of dyeing, ΔH (kJ/mol), results for Reactive Yellow 25 (2) at varying salt levels. ... 109
Table 4.11. Heats of dyeing, ΔH (kJ/mol), results for Reactive Blue 225 (3) at varying salt levels. ... 109
Table 4.12. Heats of dyeing, ΔH (kJ/mol), results for Pyrimidine Modified Red 123 (11) at varying salt levels. ... 110
Table 4.13. Heats of dyeing, ΔH (kJ/mol), results for Pyrimidine Modified Yellow 25 (8) at varying salt levels. ... 110
1
1 Introduction
Since the determination that direct dyes could be applied to cotton without the use of a mordanting agent, more classes of synthetic dyes have been developed for use on cotton than for any other fiber type. The driving force behind this effort was the desire for dyed cotton fabric having high resistance to color loss in consumer laundering cycles. As a consequence, vat, sulfur, azoic, and reactive dyes followed the invention of direct dyes. These dye families were each intended to overcome the propensity for cotton fibers to swell in water and lose color via desorption from the pore structure.
2
2 Literature Review
2.1 Cellulose
The most abundant naturally occurring polymer found in every land based plant across the globe, is cellulose [1-3]. However, with all available sources of cellulose, very few sources form fibers that the textile industry can utilize. Cotton, jute, flax, linen, and ramie are all used by textile manufacturers with cotton as the dominating fiber source for the apparel industry [2, 3]. The reason for cellulose dominance is attributed to ease of processing and wide abundance of cotton fibers. Structural derivatives of cellulose are created by dissolving the cellulose in particular solvents, sodium hydroxide or ammonia, and then regenerating the cellulose from solution. Cellulose, one of the most simple and unique polysaccharides, is readily described on the single polymeric chain, supramolecular and morphological
structural levels [1].
2.1.1 Cellulose Structure
The single polymeric chain is the smallest structural level with which to describe cellulose. Cellulose is a linear syndiotactic homopolymer comprised of
3
group adjacent to the ring oxygen is the reducing end of the polymer chain. The reducing end of the polymer chain exhibits properties of both an alcohol and an aldehyde under the appropriate conditions [2, 3]. The unit containing the free C-4 hydroxyl group does not undergo the same reduction reaction due to the presence of a third secondary hydroxyl group that normally reacts to make the glycosidic linkage.
Cellulose is a naturally occurring polymer in which the degree of polymerization (DP) is determined by the number of AGP units connected to one another to form the polymer chain. Figure 2.1 shows the DP of the polymer chain to be n-units and the bracketed number of units, n-3, allows the bonding structure of a single chain of AGP units to be shown. The DP of natural cellulose is dependent on the source from which is obtained and may be as high as 14,000, but is reduced to 1,000-2,000 during purification treatment involving alkali [2, 3]. Chemically regenerated forms of cellulose have much lower DPs and the differences between the natural and regenerated forms of cellulose are in the
supramolecular structure of the polymer.
O O O H O OH O O O H OH O H O H O OH H OH O H OH OH OH OH OH O n-3 Cellobiose Unit
Non-reducing end group Anhydroglucose Unit Reducing end group
1 2 3
4 5
4
The supramolecular structure of cellulose is the aggregation of polymer chains through hydrogen bonding due to macromolecule conformation and chemical constitution to create ordered structures [1]. Cellulose is a highly crystalline material, but the crystal
structure does not mirror that of its monomer units (glucose) which forms discrete crystals [2, 3]. The order of chain aggregation is not constant over each set of chains resulting in regions of high order (crystalline) and of low order (amorphous). The pattern of aggregation determines the type of cellulose that is formed and is dependent upon the source from which it was obtained, naturally occurring or regenerated from a solution. The two crystal structures important in textile processing are cellulose I and cellulose II coming from native
and regenerated sources, respectively [2, 3]. Cellulose I can be further broken down into α
and β states. The α state is obtained from bacteria and valonia algae and is metastable. The
metastable α-cellulose can be annealed into the thermodynamically more stable β state, which is naturally occurring wood or cotton cellulose [1]. Cellulose II is the creation of regenerated cellulose fibers by precipitating dissolved cellulose from a sodium hydroxide solution into an aqueous medium near room temperature. Large-scale mercerization of cotton fibers is another way to produce cellulose II on the commercial scale [1].
5
2.1.2 Affinities/Effects of Liquids
2.1.2.1 Water
Cellulose has a very hydrophilic character due to the large number of hydroxyl groups in the polymer chain. Cellulose is not soluble in water due to the size of the
polymeric chains and their interactions as a result of crystallinity. There is a competition of hydrogen bond formation between polymer chains and water molecules [1]. Hydrogen bonding between water and cellulose occurs more readily in the amorphous regions of cellulose due to the greater mobility of the chains. However, it is also not possible to
completely remove water from cellulose because it readily adsorbs water vapor found in the atmosphere that is proportional to the relative humidity and temperature [1-3]. Immersion in water causes a greater retention of water than adsorption through atmospheric humidity. Cellulose swells as an effect of water molecules on the polymer chains and swelling can be readily reversed by drying the cellulose sample [1].
2.1.2.2 Organic Liquids
Specific literature pertaining to the affinity of organic liquids for cellulose is minimal when compared to studies involving water. The effects of an organic liquid on cellulose are dependent on the liquid involved as well as the structure of the cellulose involved [1]. Liquids capable of forming hydrogen bonds interact to a greater extent than liquids that do not. Organic liquids, other than aliphatic amines, interact with cellulose to a lesser degree than water [1-3]. Small alcohol molecules capable of hydrogen bonding, methanol and ethanol, swell cellulose to slight degree. Non-polar inclusion compounds of cellulose can be
6
vacuum [2, 3]. This process creates an inclusion of non-polar liquid inside the cellulose when returned to atmospheric conditions in the absence of more polar liquids.
2.1.2.3 Aqueous Alkali
The submersion of cellulosic materials (e.g. cotton) in solutions of aqueous alkali is a process known as mercerization. Cotton fibers swell depending on the concentration of alkali, temperature and the source of the cellulose [2, 3]. Cotton fibers contain surface convolutions caused by the collapse of the lumen after harvesting. Aqueous alkali swells the cotton by filling the lumen resulting in a more uniform fiber surface. Alkali ions disrupt the hydrogen bonding between polymer chains and allow diffusion of water molecules deep into the structure and creating alkali cellulose [1]. The physical features of mercerized cotton are different from that of natural cotton.
2.1.3 Degradation of Cellulose
A feature of industrial importance is the chemical stability of the cellulosic fibers under a variety of conditions as a product of multiple processing methods. The slightest degradation of cellulose during fiber processing can cause a loss in strength and other properties and make the resulting fiber unsuitable for processing [2, 3]. There are five agents commonly used in textile processing that can cause degradation of cellulose: acid, alkali, oxidation, heat, and enzyme [1-3].
2.1.3.1 Acidic Degradation
7
increased rate of cellulosic degradation [1]. Acidic strength also affects the hydrolysis of cellulosic samples [5]. The first areas of degradation of cellulose are the amorphous regions of the polymer because of the accessibility of polar liquids to this region. DP is not an accurate reflection of the extent of hydrolysis due to the plateau effect achieved after all the amorphous regions are hydrolyzed. Hydrolysis can occur in the crystalline regions, but only at chain ends due to the reduced access of the aqueous acid to the glycosidic linkages. A solution of acid in an aprotic solvent increases the rate of hydrolysis. There is water present in cellulose due to adsorption of moisture in the atmosphere. Acid molecules diffuse into cellulose when placed in the aprotic solvent solution creating a concentrated acid solution in direct contact with the polymer chains [2].
2.1.3.2 Alkaline Degradation
The treatment of cellulosic fibers with alkali solution is a textile scouring treatment to remove the hydrophobic materials (fats, oils, and waxes) from the substrate. Cellulose is not readily degraded by alkali. On the contrary, it is stable to aqueous alkali solutions of high concentration below the boil in the absence of oxygen. Temperatures greater than 140°C in the presence of alkali cause a stepwise removal of AGP units from the reducing end of the polymer chain [2]. At temperatures above 150°C a solution of alkali will cause the random cleavage of the glycosidic bonds throughout the polymer chain [3]. However, this must be done at pressures greater than atmospheric and in closed vessels so evaporation due to boiling does not occur.
2.1.3.3 Oxidative Degradation
8
glycosidic linkage between rings. This abundance of oxygen makes the number of possible oxidation products numerous and there in no single mechanism for the oxidative
degradation of cellulose. Two oxidizing agents are utilized in the textile industry to remove natural color bodies from cotton fibers, sodium hypochlorite (NaOCl) and hydrogen peroxide (H2O2). Hypochlorite bleaching utilizes NaOCl under alkaline conditions to oxidize natural color bodies and remove motes from the substrate and it also causes “yellowing” of the fiber. The use of chlorine as an oxidizing agent produces absorbable organic halogen (AOX) by-products [5-7]. Peroxide bleaching utilizes hydrogen peroxide (H2O2
Figure 2.2
) in alkaline solution to produce perhydroxyl ions ( ) as the active bleaching agent. The produced ions then react with impurities. Transition metals, iron (Fe), manganese (Mn), and cobalt (Co) in particular, cause a spontaneous decomposition of the perhydroxyl ion and alkali earth metals, such as magnesium (Mg), are used as stabilizers of peroxide baths [2, 3]. A total oxidation of cellulose to CO2 and H2O is possible by use of K2Cr2O7/H2SO4
HO
OH OH
HO O
H2O
+
at elevated temperatures and is used to do titrimetric determinations [1].
Figure 2.2. Perhydroxyl ion formation under basic conditions.
2.1.3.4 Thermal Degradation
Cellulose has moderate thermal stability up to temperatures around 200°C. Above this temperature cellulose starts to decompose, with rapid decomposition occurring between 250 and 350°C [1]. There are two pathways of decomposition of cellulose that are
9
280°C and the subsequent exothermic reaction creating char and gases. The second is the formation of tar, mainly in the form of laevoglucosan, at temperatures greater than 280°C [2, 3].
2.1.3.5 Enzymatic Degradation
Enzymatic degradation involves the hydrolytic cleavage of the glycosidic bonds present in cellulose molecules. Cellulase, the enzyme responsible for cellulose degradation, is a component mixture of multiple enzymes [5], including cellobiohydralase,
endo-glucanase, and exo-glucanase [7, 8]. The enzymatic degradation is dependent on the crystallinity of cellulose because enzyme penetration of crystalline regions is slow. The reaction rate for enzymatic hydrolysis is decreased as the reaction continues due to the lack of accessible sites for reaction [6]. This leads to an incomplete hydrolysis method unless given an exorbitant amount of time.
2.2 Analytical Methods
2.2.1 Chromatography
10
2.2.1.1 Liquid Chromatography
LC is the separation of compounds by the passing of a liquid mobile phase through a stationary phase, that can either be a liquid or solid. The first use of liquid chromatography was in 1906, when plant pigments were separated on calcium carbonate and using alcohol as the eluent [9-11]. The mobile phase in an LC method is always a liquid, but may be comprised of components that vary in polarity to make separation more effective. There are two categories of liquid chromatography, column and planar, that are based on the way the sample is introduced to the stationary phase and carried by the mobile phase [9]. In column chromatography, the stationary phase is placed in a narrow tube and the mobile phase flows through the stationary phase and carries solute molecules as it travels. The mobile phase may travel by capillary action cause by gravity or be forced through the stationary phase by pressure. Planar chromatography brings the mobile phase in contact with the stationary phase, which is supported by a backing, and moves the mobile phase (eluent) through the stationary phase using capillary action. Thin layer chromatography and paper
chromatography are examples [9, 11]. Chromatographic separation is further divided by the mechanism of interaction between the solute and the stationary phase as the liquid phase moves, examples of which are partition, adsorption, ion-exchange, molecular exclusion, and affinity chromatography [11].
11
retention [10]. Partition chromatography can be broken into two types based on the nature of the stationary and mobile phases. Normal-phase partition chromatography uses a polar stationary phase, silica or alumina, through which a non-polar mobile phase is passed. The first eluted component is the least polar one in the mixture. Reversed-phase partition chromatography employs a non-polar stationary phase (C-18 or C-8 bonded silica) and a polar mobile phase (water/polar organic mixtures) [9, 12]. Reverse-phase chromatography accounts for 75% of partition separations conducted today [14].
Adsorption liquid chromatography involves a solid stationary phase and a liquid mobile phase; a liquid-solid chromatography method. The solute present in the mobile phase will adsorb onto the surface of the solid stationary phase and is retained for a period of time before being dislodged by the mobile phase and carried further along the stationary phase, retention. The greater the retention time, the more strongly adsorbed the solute is by the stationary phase [9, 11]. Adsorption chromatography and normal-phase partition
chromatography overlap one another because normal-phase partitioning is governed by the adsorption-displacement process of adsorption chromatography [9].
12
separation is effected by the size and effective charge of the molecules present in the solute mixture [14].
Molecular exclusion chromatography is also known as gel filtration, gel permeation [11], or size exclusion chromatography [9, 14]. This chromatographic method separates solute molecules by size which the largest solute molecules first to elute. The column consists of a stationary phase that is made up of particles that contain pores of a uniform size into which solute and solvent molecules can penetrate [14, 15]. The molecules of larger size than the pore diameter move down the column and are the first to elute with smaller molecules entering the stationary phase and traversing the pore network causing a greater retention time [9, 11-12]. This chromatographic method is different from all others because it does not depend on interactions between solute molecules and the stationary phase [9, 11].
Affinity chromatography is the most selective of the separation methods. It involves the interaction of a certain type of solute molecule with a covalently bound molecule on the stationary phase, producing a ‘lock and key’ model [14]. The mobile phase must be able to solubilize the solute and must also ensure that elution of all molecules, even those targeted for retention, is possible. To ensure elution, changes in pH or ionic strength of the mobile phase are used [9, 11]. This chromatographic method is useful for separations that involve biological species.
2.2.1.2 High Performance Liquid Chromatography
13
pressure used is in excess of 6000 psi producing flow rates that vary between 0.1 and 10.0 mL/min [9]. A separation with a constant mobile phase composition throughout the
separation process is known as an isocratic elution. One that involves changes in mobile phase composition during the separation process is gradient elution and is achieved by use of a proportioning valve in conjunction with the pump system.
Sampling loops are the most widely used devices for introducing a sample into an HPLC system without depressurizing the system and causing a dangerous pressure spike. The size of the sampling loop can vary from 1 to 1000 µL [9, 11]. The loop is part of the injection valve, which when activated, causes the pressurized mobile phase to carry the sample into the system for analysis [11]. Autosamplers, a carousel/tray of sample vials combined with an automated needle, allow for precise and reproducible injection volumes [14]. The mobile phase containing the solute passes through the column and into a detection device where that the solute is distinguished from the mobile phase.
There are many devices suitable for detection of analytes. The ideal detection device is sensitive to low concentrations of analyte, provides clean, sharp peaks, and is not
sensitive to changes in temperature and solvent composition [11]. The latter is mainly of importance if gradient elution methods are employed. Spectrophotometric detectors use light absorption as the criteria of detection, whether it is ultraviolet (UV) or visible (VIS), as most organic compounds absorb energy in one of these two regions. A spectrophotometric system normally contains dual beams that have been split from the same source, a
14
detectors can be used with either isocratic or gradient elution methods. Drawbacks of spectrophotometric detectors are that the mobile phase chosen should be as inactive as possible at the desired wavelength of detection [14] and the detector is concentration sensitive device, being based on the Beer-Lambert Law [15]. Refractive index (RI) detectors can detect almost all solutes regardless of flow rate. However, RI detectors are temperature sensitive and have poor detection limits when the analyte concentration is low [11, 15]. An RI detector cannot be used with gradient elution methods because changes in the mobile phase composition cause the refractive index of the mobile phase to change and may mask the refractive index of the analyte. One of the newest detectors for HPLC
systems is the evaporative light scattering (ELS) detector [9]. ELS detectors are useful for detection of analyte that is less volatile than the mobile phase used to elute it [11, 14]. The delivery system for ELS detectors consists of three parts: the nebulizer, drift tube, and light scattering cell [14]. The column effluent is prepared for detection by nebulization, the forcing of the liquid through a small hole by air or nitrogen gas to form uniform droplets. These droplets are then heated in the drift tube, evaporating the mobile phase and leaving analyte molecules to enter the light scattering cell. Upon entering the cell, the analyte molecules scatter a laser light and the intensity of the light is detected by a photodiode detector. ELS is a sensitive detection method and can be used with gradient elutions. The only disadvantage to ELS is that the mobile phase composition is limited to compounds that are readily
volatilized and environmentally benign unless collected [9, 11].
15
separation of strong acids and bases using a reverse-phase column, a buffering agent, and an organic counter ion [14]. Ion-pairing chromatography is more complicated than regular reverse-phase chromatography because of the associated mechanisms of separation: ion-pair formation and ion-exchange [16]. In the former, the counter ion form an uncharged ion pair with the solute ion and the resulting uncharged species is partitioned with the non-polar stationary phase. Alternately, counter ion is retained in the stationary phase and separation occurs when solute ions interact with the retained counter ions to create a reversible ion-pair complex [9]. In both cases the molecules with the greatest interaction between ion-pairs are the more strongly retained species and last eluted. Gradient elution is only possible with reverse-phase ion pair chromatography because it is difficult to maintain the stability of the stationary phase of a normal-phase column when the gradient changes [13]. Buffer systems are used to ensure the charge stability of the ions being eluted. The choice of buffer used in the system is chosen so the analyte is a charged molecule and the counter ion is of opposite charge [14]. Factors that affect ion pair chromatography are pH, counter ion type, counter ion concentration, electrolyte concentration, organic solvent, and to a smaller extent temperature [16].
Reactive dyes contain sulfonic acids groups which impart solubility to the molecule by creation of an anionic species when in aqueous solution. These negative ions are the reason ion-pair chromatography with a spectrophotometric detector is used when
16
2.2.1.3 Thin Layer Chromatography
Planar chromatography is a liquid-solid chromatographic method in which the mobile phase moves through the stationary phase by capillary action or with assistance from gravity or electric potential [9]. Thin layer chromatography (TLC) is normally conducted on silica gel, cellulose, alumina, or polyamide substrates backed with glass, aluminum, or polyester substrates [12, 17]. The polyester or aluminum backed sheets are used because they can be tailored to fit the specific application more easily than glass. A sample to be analyzed is placed 1 cm from the edge of the plate using a capillary tube and the solvent is allowed to evaporate. The samplet spot should have a small diameter and dilute samples are to be spotted multiple times with drying between applications to keep the effective diameter small [9]. The plate is then placed into a closed vessel containing an eluent that develops the plate. The solute travels up the plate, with each component having the same travel time but different migration distances [17]. The separated components can then be visualized on the plate using ultraviolet light or by staining. 2D-TLC is the development of a plate using two solvent systems. The second solvent system is introduced perpendicular to the development of the first resulting in a greater separation between the components in the mixture [9]. TLC done on reactive dyes mainly involves the unreacted form of the dye because reactive dyes cannot be removed from the substrate without degradation of the dye [12].
2.2.2 Mass Spectrometry
17
stages of MS development, the analytes needed to be sufficiently volatile to enter the gaseous phase and be introduced to the ionization source. Nowadays there are many different types of ionization that are suitable for analyzing non-volatile and thermally stable compounds. The ionization techniques can be divided into gas-phase and desorption methods.
2.2.2.1 Gas-phase Methods
Electron ionization (EI) is the oldest ionization method used in MS [15]. The sample is volatilized and subjected to bombardment by a 70 eV beam of electrons that cause the loss of electrons from the compound analyzed. EI is a hard ionization technique and the associated energy can cause a high degree of fragmentation which can obscure molecular ion detection [14, 15]. EI is restricted to the analysis of positive ions because negative ions cannot be formed with the loss of an electron [15]. Conventional EI cannot be used for polysulfonated dyes because of excessive fragmentation and inability to volatilize the sample [18].
18
2.2.2.2 Desorption Methods
Desorption ionization involves surface ionization of solids and liquids to form analyte molecules in the gaseous phase by rapid heating or sputtering by higher energy species [14-15, 19]. These methods are considered to be“soft” techniques due to low levels of fragmentation of the molecular ion.
Fast atom bombardment (FAB) involves the introduction of the sample into a beam of high energy particles [15]. The analyte is placed into a solvent matrix, such as glycerol, and spread into a thin film on a metal surface [19]. The analyte/matrix is then placed in the beam of high energy particles and molecular desorption occurs. During detection analyte ions and matrix ions travel along the ion beam with matrix ions dominating the lower (higher MW) end of spectrum [14].
Matrix-assisted laser desorption ionization (MALDI) is similar to FAB, with the ionization source being a laser instead of a beam of high energy particles [14-15, 19]. MALDI involves placing the analyte into a matrix of a benzoic acid derivative and then
impacting the analyte/matrix with the photons produced by the laser to desorb the analyte as protonated species from the sample matrix [15]. This method is normally used for large molecules with a molecular mass greater than 10,000 Da [14].
19
counter electrode (Figure 2.3) [15]. The stream of analyte molecules is dependent on the charge difference. When the difference is too small, the droplets do not move across the gap. The solvent is evaporated in much the same way as in ELS nebulization. One advantage of ESI is its ability to analyze large multivalent molecules [14].
Figure 2.3. Electrospray mass spectrometer apparatus [18].
2.2.3 Ultraviolet and Visible Spectroscopy
20
absorbed, electrons move from the ground state (S0) to an excited state of the same spin (S1). In the excited state, the associated species can do one of several things to lose energy and return to the ground state. For instance, it can release energy in the form of heat by vibrating from one energy level in the excited state to a lower energy level in the same state, a process represented by internal conversion (IC). The excited molecule can also transfer to an energy level of opposite spin (T1), which is known as intersystem crossing (ISC).
Depending on which path the species takes, it can also emit energy in the form of radiation: fluorescence (emission from the excited singlet state to the ground state) or
phosphorescence (emission from the triplet state to the ground state). UV/VIS spectroscopy is a base testing method for characterization of dye molecules, but additives like salt or urea may cause shifts in wavelength of maximum absorption of reactive dye solutions [20].
21
2.3 Dyes for Cotton
The process essential to any dyeing is the transition of the color from the dyebath to the substrate [25]. There are three ways in which a dye can be retained by a substrate: physical sorption, mechanical retention, and reaction with the fiber. Physical sorption of a dye to a substrate relies on the same intermolecular forces that promoted exhaustion from the dyebath. Dye classes that use physical sorption as a retention mechanism include direct dyes for cellulose. Mechanical retention is the formation of an insoluble pigmentary material out of previously soluble chemicals that diffused into the fiber. Vat, sulfur, and azoic
combinations are examples of dye classes that use mechanical retention. The third retention method involves dyes forming a chemical bond with the fiber. Reactive dyes are the only dye class that forms a covalent bond with fibers, whether they are cellulosic or protein. Acid and basic dyes use ionic bond formation as the retention method. A reaction between the dye molecule and the fiber results in a colored derivative of the fiber. The solubility of the dye molecule is decreased exponentially after bond formation while polymer/fiber solubility is not affected.
2.3.1 Covalent Bond Formation
22
Rattee, at ICI, and Hoechst introduced the first reactive dyes for wool in the early 1950s, s-triazine and vinylsulfone based reactive dyes, respectively [22-23, 36]. Rattee and Stephen conducted a series of experiments with dyes and cellulosic fibers under alkaline conditions and found that the addition of salt and mild alkaline pH increased substantivity and reduced hydrolysis for the dyes when applied at 20-40°C.
Reactive dyes were immediately attractive to dyers and chemists because they provided a new retention method and a full color range. The triazine heterocyclic system in the form of di- and monochlorotriazine were the earliest reactive dyes and were capitalized by ICI and Ciba. Other heterocyclic molecules with comparable reactivities including
pyrimidine, quinoxaline, and pyridine systems (Figure 2.5) were also investigated by Bayer, Sandoz, and Geigy [41]. Changes in the labile group attached to the reactive system led to new reactive systems that varied in properties from the initial dyes introduced by ICI. Presently, the environmental impact of reactive dyes is of high concern because waste water treatment and environmental safety have come to the forefront. Novel dyes created are designed to increase exhaustion and fixation properties to reduce the amount of salt and dye in effluents.
N N
N
N N
Figure 2.5. Structures of pyrimidine, quinoxaline, and pyridine, from left to right.
2.3.2 Reactive Dye Structure
23
parts: chromagen (C), solibilizing group (S), bridging group (B), reactive group (R), and leaving group (X), as illustrated in Figure 2.6.
Figure 2.6. Reactive Red 1 showing dye features of reactive dyes.
The dyes created by the combination of these features react with cellulosic and protein fibers to produce covalently bound color bodies. Each group contributes to the physical properties of the dye molecule including color, size, substantivity, diffusion, fastness, and solubility [25]. Substantivity is defined as the attraction between a substrate and a dye under specified conditions where the dye is absorbed from a dyebath by the substrate [43]. This term is often used interchangeably with affinity, but should not be. Affinity is a quantitative expression of substantivity defining the difference in chemical potential of the unfixed dye in the fiber and the chemical potential of the dye in dyebath expressed in units of joules per mole.
2.3.2.1 Chromagen
The chromagen is the color producing part of any dye molecule. It is the combination of extended conjugation and one or more chromophores. Color production occurs because
N N
NaO3S SO3Na N
H
OH N
N N
Cl
Cl SO3Na
B
X
R
24
photons of visible light excite lone pair or pi electrons from the ground state to the excited state. In the excited state, the electrons lose some energy due to heat and fall to lower excited states. The electron then returns to the ground state from which it was excited by emitting energy in the form of light or by various internal conversion processes. The light emitting process described above is known as fluorescence and occurs when the transition is of the same spin state.
The many types of chromagens in reactive dye design include azo, anthraquinone, phthalocyanine, triphenodioxazine and formazan systems (Figure 2.7). The first three are the main groups used in reactive dye systems with triphenodioxazine and formazan based dyes replacing the tinctorially weaker anthraquinone dyes [24]. Azo reactive dyes range from monoazo to trisazo, with a bathochromic shift accompanying the addition of each azo unit to the chromagen system. Azo reactive dye colors range from red to black, with
predominance in the reds, yellows, and oranges for monoazo and blues, browns, and blacks for dis/trisazo. Anthraquinone itself is pale yellow in color, but the addition of
25
N N R
R'
O
O N
NH R
R' N N
R''
N O
O N
NH N
N HN
N N
N
N
Formazan Anthraquinone
Phthalocyanine
Azo Triphenodioxazine
Figure 2.7. Chromophoric systems utilized in reactive dyes.
2.3.2.2 Solubilizing Group
26
2.3.2.3 Bridging Groups
The bridging group is the group of atoms that connects the reactive group to the chromagen and it must be sufficiently stable under basic and/or acidic conditions [33]. In most cases bridging groups consist of N, O, or S linkages. The strength of the bridge is dependent on the bridge type, the dyeing conditions, and the substituents connected by the bridge. The most typical bridging group for reactive dyes contain N in either the amine or imine structure before reaction. The bridging group effects substantivity based on the composition of the two molecules it is used to bridge, chromagen and reactive group [33, 36]. Bridges containing both amino (-NH2
2.3.2.4 Reactive Group
) and mercapto (-SH) groups were investigated by North Carolina State University [30-32].
The part of the chemical structure that undergoes chemical reaction with a functional group present on the substrate to create a colored derivative is the reactive group. The main characteristic of a reactive group is the presence of electron deficient carbon atoms capable of nucleophilic attack by either substitution or addition. A nucleophile is an atom that has an abundance of electrons, lone pairs, which bond with the electron deficient atom. The two largest problems that face dye chemists when choosing a reactive group are systems that are suitable for efficient reaction with the substrate and also produce high fastness
properties [26]. To achieve the latter, the reactive group must be able to align itself with the surface of the substrate to favor reaction. Once the dye-fiber bond is established, the stability of that bond becomes of importance due to subsequent treatment of the colored substrate [28]. In most cases, as reactivity of the group increases the stability of the
27
the group. S-triazine and quinoxaline based reactive groups enhance the substantivity of the dye for the fiber, while pyrimidine and vinylsulfone reactive groups do not change
substantivity [4].
2.3.2.4.1 Nucleophilic Substitution
Reactive groups that normally undergo nucleophilic substitution are heterocyclic compounds composed of an alternating hetero atom and carbon atom sequence. The alternating heterocycle allows substitution by nucleophilic attack at the carbon atom that has a partial positive charge due to the electronegativity of the heteroatoms, N, O, or S, in the cyclic ring (Figure 2.8). Triazine, the heterocycle in this figure was the first system to be used as a reactive group on a wool substrate. The technology was then extended to cellulose. Many five and six membered rings containing heteroatoms have been examined as possible reactive groups for cellulose and protein substrates with only a few reaching commercial success. Fused ring systems containing heteroatoms were also examined leading to the discovery of the quinoxaline reactive system.
N
N N Cl
Cl Chromagen
+ Nuc N
N N Cl
Cl Chromagen
Nuc
N
N N Nuc
Cl Chromagen
- Cl
28
2.3.2.4.1.1 S-Triazine System
The s-triazine reactive group is a six member cyclic ring containing alternating carbon and nitrogen atoms. The nitrogen heteroatoms pull electron density away from the carbon atom leaving them with a partial positive charge. This makes the carbon atoms more susceptible to attack by a nucleophile. The partial positive charge created on a carbon atom in the s-triazine ring is the greatest of any heterocyclic ring used as a reactive group. The high reactivity of the triazine group arises from the ideal placement of the nitrogen
heteroatoms [41].
The reaction of the s-triazine group in the form of cyanuric chloride with a bridging group of chromagen at cold, neutral conditions is the base reaction for the dichlorotriazine reactive dyes. The electronegativity of chlorine polarizes the carbon-chlorine bonds in cyanuric chloride and enhances the positive charge on the ring carbon atoms [34]. The chlorine atoms present on a dichlorotriazine dye are equally reactive to either the substrate or hydrolysis. Figure 2.9 shows the reaction between a dichlorotriazine dye and
nucleophile, substrate or desired molecule, at mildly alkaline conditions near room temperature yields a colored substrate (dye-OCell) or the partially hydrolyzed
monochlorotriazine dye (dye-OH), respectively. The hydrolyzed monochlorotriazine dyes are much less reactive than their dichloro precursors. Monochlorotriaznyl dyes have also been synthesized for use as reactive systems with reduced reactivity. The reactivity of the monochlorotriazinyl dyes can be enhanced by changing the leaving group present on the carbon atoms of the cyclic ring and substituent molecule that reacted with the
29
N
N N
Dye
Cl
Cl
N
N N
Dye
OH
Cl
N
N N
Dye
Cl
OCell OH
OCell
+
+ Cl
Cl
Figure 2.9. Fixation and hydrolysis reactions of dichlorotriazine dyes.
2.3.2.4.1.2 Pyrimidine System
The pyrimidine reactive group is also a six member cyclic ring containing four carbon and two nitrogen atoms that alternate. Any heterocyclic compound containing two nitrogen heteroatoms in the ring are classified as diazines [41]. The electron deficiency of the carbon atoms present on the pyrimidine ring is not a great as on the triazine system and it is not equally distributed. The C-2 carbon, between the nitrogen atoms, is the most electron deficient followed by the C-4 and C-6 positions. The C-5 position has a greater electron density than all other carbons present on the ring due to its placement with respect to the nitrogen atoms of the ring. The first pyrimidine based reactive group was 2, 4,
6-trichloropyrimidine. Reaction with a chromagen containing a bridging group results in a mixture of products. The main product resulting from reaction in either the 4 or 6 position on the ring and the minor product resulting from reaction in the 2 position [41]. The first
commercial reactive dyes based on pyrimidinyl chemistry were the 2, 4, 5,
30
products. Many attempts have been made to alter the reactivity of pyrimidine based reactive groups by changing the labile groups in the 2, 4, and 6 positions and/or the substituent group at the 5 position [27, 36].
NH2
Dye
N N
Cl
Cl
Cl
Cl
N N N
N
Cl Cl
Cl
HN HN Cl
Cl
Cl
Dye Dye
+ +
Figure 2.10. Reaction of tetrachloropyrimidine resulting in an isomeric mixture.
2.3.2.4.1.3 Quinoxaline System
Attempts made to utilize rings that included heteroatoms exhausted five and six membered single ring systems and this led to fused ring systems containing heteroatoms as reactive groups. The most effective fused ring system and the only one to achieve
commercial viability was the 2, 3–halogenoquinoxaline system. This system is the benzo derivative of the pyrazine diazine structure [41]. This reactive system is not compatible with normal bridging because once one of the halogens has reacted, the others reactivity is greatly diminished and removes its viability as a reactive group [26]. Synthesis of
31 Dye NH2 +
N N N N
Cl
Cl Cl Cl
Cl
O
HN
O
Dye
Figure 2.11. Reaction of chlorocarbonyl to produce dichloroquinoxaline dye.
2.3.2.4.2 Nucleophilic Addition
Nucleophilic addition is the reaction of a double bond in a molecule to from two new single bonds and normally consists of two carbon atoms, but can include heteroatoms. The
nucleophile attacks the π-bond causing the movement of electrons to the adjacent carbon in the double bond to form a carbanion. Attack by the carbanion on an atom that is electron deficient causes the formation of the second single bond. The only commercially available reactive dyes that undergo nucleophilic addition are the vinylsulfone dyes.
2.3.2.4.2.1 β-Substituted Ethyl Sulfone/Vinyl Sulfone
Substituted ethyl sulfones were first introduced in a dye by Hoechst in the 1950s. The reactivity of the sulfatoalkyl group was found to be enhanced when hetero atoms were
introduced in the β- or γ-positions of the group [26]. The most preferred activating group for vinyl sulfone compounds is the sulfonyl (-SO2-) group [42]. This reactive group
(-SO2CH2CH2-X) can be reacted with many chromagens directly or with bridging groups [27].
The elimination of the leaving group (X) and a hydrogen on the α-carbon under mild alkaline
32
reactive group (Figure 2.12) [36]. The vinyl sulfone is therefore masked by the leaving group until it is in solution [37]. Upon reaction with the substrate, nucleophile addition across the π
-bond occurs and a covalent -bond is formed. Generally β-sulfatoethylsulfone reactive groups have a lower substantivity than heterocyclic ring reactive systems [35].
Dye S
O S O
O
O O
OH OH
Dye S O
O
OCell
Dye S O
O
OCell
Figure 2.12. Reversible masking and fixation reactions of sulfatoethylsulfone.
2.3.2.4.3 Leaving Group
The leaving group is associated with the reactive group upon reaction of the nucleophile with the electron deficient carbon located on the reactive group. A suitable leaving group is an atom or molecule electronegative in character and relatively stable once in solution [28]. Typical leaving groups for reactive groups that undergo nucleophilic
substitution or addition include halogens and molecules that from stable ions in solution, chlorine or fluorine and quaternary ammonium or sulfato respectively. The reactivity of a reactive group can be changed by variation of the electronegativity of the leaving group associated with the system [36].
2.3.2.4.3.1 Chlorine
33
reactive dye. Cyanuric chloride is used mainly to create mono- and dichlorotriazine reactive dyes. Upon reaction with a suitable nucleophile, the chlorine atom is removed by sequential addition and elimination reactions and goes into the reactive dyebath solution as the
chloride ion. Other reactive systems originated utilizing chlorine as the labile molecule including tetrachloropyrimidine and 2, 3-dichloroquinoxaline.
2.3.2.4.3.2 Fluorine
Fluorine has also been utilized as a labile group in conjunction with triazine and pyrimidine systems. The introduction of fluorine leads to an increased reactivity when compared to chlorinated reactive groups similar in nature [34, 35]. The increased reactivity allows for lower production process temperatures and milder reaction conditions [36]. The introduction of 4, 6-difluoropyrimidinyl reactive dyes was one of the most recent innovations of reactive dyes [29].
2.3.2.4.3.3 Quaternary Amine
Tertiary amines have also been utilized as leaving groups in reactive dyes. The only requirement for the tertiary amine compound is that the nitrogen atom be sterically
34
2.3.3 Functionality
Reactive dyes are colored compounds containing a functional group capable of forming a covalent bond with a substrate [33]. The functionality of a reactive dye
corresponds to the number of reactive groups present on the molecule. The reactive groups may be similar or may differ in chemical constitution. Dyes that contain multiple reactive groups similar in nature are classified as homofunctional. Dyes that contain two or more differing reactive groups are considered heterofunctional. The most common functionalities for reactive dyes are mono- and bifunctional with a few instances of dyes with a functionality of three or greater. Advantages of increasing the number of independent reactive groups on a dye molecule are that the dye gives increased fixation and lower amounts present in waste water [27, 34]. Disadvantages include increased washing times of dyed substrates due to higher affinity of the hydrolyzed dye and decreased solubility.
2.3.3.1 Monofunctional
The classification of a dye containing a single reactive group is monofunctional. The chromagen is reacted with only a single reactive group and the dyeing properties of the dye are subject to the conditions favored by the reactive group for reaction with the substrate. Mono- and dichloro/fluorotriazine, trichloro- and chlorodifluoropyrimidine, quinoxaline and sulfato ethyl sulfone/vinyl sulfone are all examples of monofunctional dyes. The wide variety of dyes containing reactive groups allows for selection of dyes based on reactivity that gives the greatest properties for the process.
2.3.3.2 Homobifunctional
35
due to the dual independent reactive groups. Hydrolysis of one reactive group would not affect the reactivity of the other group due to their separation causing an increased chance for fixation. The first homobifunctional reactive dye was Reactive Black 5, a bis-β
-sulfatoethylsulfone, by Hoechst in 1957 [42]. Work done by a group at North Carolina State University has involved homobifunctional dyes containing a cysteamine or cysteine bridging group [30]. These dyes were compared to their commercial precursors in a production setting [31].
2.3.3.3 Heterobifunctional
A reactive dye that contains two dissimilar reactive groups is known as a
heterobifunctional reactive dye. A dye containing two reactive groups has a greater chance to react, but because of differences in the nature of each reactive group, reaction conditions are different. The advantage of a heterobifunctional dye is the ability to create a two stage application process in which conditions for the first, more reactive, species are met and then increased to the conditions for fixing the second, less reactive species. The second reactive species is subject to a very low degree of hydrolysis at the conditions of the first reactive species, but the first is subject to a high degree of hydrolysis at the conditions of the second species. Sumitomo Chemical was the first to introduce a heterobifunctional dyes to market [29, 40, 42]. The technology introduced vinyl sulfone and monochlorotriazine reactive
groups into the same reactive dyes. Novel bridging groups have also been used to introduce reactive groups to a commercial dye to create a heterobifunctional dye [32].
2.3.3.4 Polyfunctional
36
functionalities greater than two have reached marketability and commercialization and most of these are trifunctional [29, 33, 40].
2.3.4 Key Reactions
2.3.4.1 Dye-Fiber Bond Formation
Fixation, dye-fiber reaction, is the desired process, as it forms a covalent bond with the fiber. In the presence of water cellulose and protein fibers adopt either a positive or negative charge dependent on pH and auxiliaries present. The cellulosate anion is formed when cellulosic substrates are placed into alkaline solutions and is nucleophilic in nature. Nucleophilic attack of the cellulosate ion on a reactive group results in the formation of a covalent bond between the fiber and the dye molecule. Covalent bond formation is also known as fixation of the dye to the fiber.
2.3.4.2 Hydrolysis
37
during storage include the use of buffer salts and desiccation to control pH and remove excess water.
2.4 Project Proposal
Teegafix® technology, given to North Carolina State University by Procter and Gamble, pertains to a two-step modification of commercial dichlorotriazine (DCT) dyes to produce homobifunctional dyes with for cellulosic substrates (e.g. cotton). In step 1, the commercial DCT is reacted with either cysteamine or cysteine to produce an intermediate with a new linking group. The resulting intermediate is reacted with either cyanuric chloride or a second DCT molecule to produce bis-DCT or bis-MCT (monochlorotriazine) dyes. A total of four homobireactive dyes produced through these syntheses, a cysteamine linked DCT, a cysteine linked DCT, a cysteamine linked MCT, and a cysteine linked bis-MCT [30].
38
amount of dye needed to achieve the same shade depths as the commercial dyes.
Expansion of the technology to synthesis of MCT/VS heterobifunctional dyes and evaluation of their properties was also completed [32].
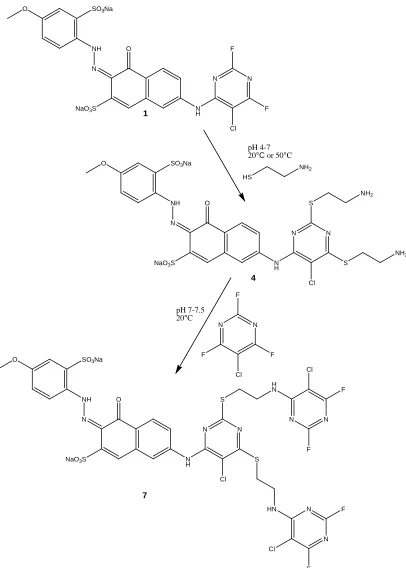
The first part of this study involves the synthesis of bis-chlorodifluoropyrimidine (CDP) dyes based on commercial red (1) and blue (3) pyrimidine structures and a
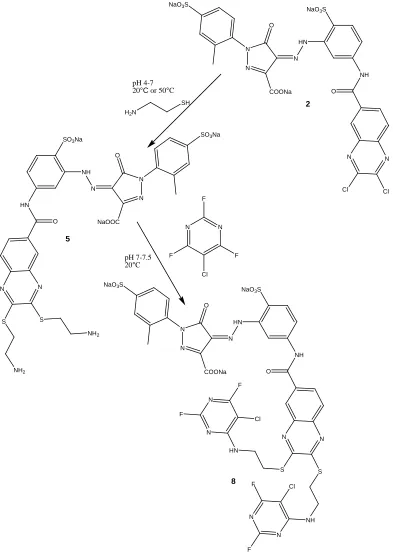
commercial yellow (2) quinoxaline structure. Figures 2.13-2.15 show the 2-step modification conducted on the commercial dyes to produce an intermediate series (4-6) and a final dye series (7-9). The modification involves the reaction of dyes 1-3 with cysteamine to produce the dye intermediates 4-6 which are subsequently reacted with chlorotrifluoropyrimidine to produce the final dyes 7-9. Following the synthesis of intermediates 4-6 and dyes 7-9, these products and dyes 1-3 will be analyzed using reverse-phase ion pair chromatography and electrospray ionization mass spectrometry.
39
O
N NH SO3Na
O N H N N F F Cl NaO3S
O
N NH SO3Na
O N H N N S S Cl NaO3S
O
N NH SO3Na
O N H N N S S Cl NaO3S
N N F F Cl F 1 4 7 NH2 HS NH2 H N N N F F Cl pH 4-7 20°C or 50°C
pH 7-7.5 20°C
HN NH2 N N Cl F F
40
NaO3S
N N COONa O N HN
NaO3S
NH O N N Cl Cl
SO3Na
N N NaOOC O N NH SO3Na
HN O
N N
S S
NaO3S
N N COONa O N HN
NaO3S
NH O N N S S
H2N
SH
NH2
NH2
pH 4-7 20°C or 50°C
N N F F Cl F HN NH N N N N Cl F F Cl F F pH 7-7.5 20°C
2
5
8
41
N HN
SO3Na
NaO3S
N N
NaO3S
N H HO3SOH2CH2CO2S
N N
F
F
Cl NH2 O
N HN
SO3Na
NaO3S
N N
NaO3S
N H HO3SOH2CH2CO2S
N N
S
S
Cl NH2 O
N HN
SO3Na
NaO3S
N N
NaO3S
N H HO3SOH2CH2CO2S
N N
S
S
Cl NH2 O
F F F Cl HN NH NH2 NH2 Cl F F Cl F F 3 6 9 H2N
SH
pH 4-7 20°C or 50°C
pH 7-7.5 20°C
42
3 Experimental
3.1 General
The commercial dyes (Levafix Brill Yellow E3G, Levafix Scarlet E-2GA Gran, and Levafix Navy Blue EBNA Gran) were obtained from Classic Dyestuffs Inc of High Point, NC. Cysteamine·HCl, Na2CO3 anhydrous, 1N H2SO4, ammonium phosphate monobasic
(NH4H2PO4), acetonitrile (CH3CN), and tetrabutyl ammonium bromide (TBAB) were obtained from Fisher Scientific. Sodium chloride (salt) was supplied by Morton Salt of Chicago, IL. Urea ((NH2)2CO) was obtained from Benntag of Durham, NC. Sera Con M-LU Gran was obtained from Dystar of Charlotte, NC. Superclear® 80 N and ApolloScour SDRS were supplied by Henkel of Ambler, PA and Apollo Chemical of Burlington, NC.
Chlorotrifluoropyrimidine was obtained from SynQuest Laboratories Inc. of Alachua, FL.
Fabric used for equilibrium exhaustion studies was 100% cotton woven crocking squares (0.25±0.01 g), obtained from the American Association of Textile Chemists and Colorists of Research Triangle Park, NC. Laboratory dyeing studies were conducted using 100% cotton woven (10.00±0.1 g or 5.00±0.1 g rectangular samples) from the
![Figure 2.3. Electrospray mass spectrometer apparatus [18].](https://thumb-us.123doks.com/thumbv2/123dok_us/1609764.1199383/37.612.116.528.204.466/figure-electrospray-mass-spectrometer-apparatus.webp)