Redundancy Allocation in an Industry using
Multi-Objective Optimization
Priya Itoriya1, Dr. Sanjay Jain2
P.G. Student, Department of Mechanical Engineering, SATI College, Vidisha, M.P., India1
Professor, Department of Mechanical Engineering, SATI College, Vidisha, M.P., India2
ABSTRACT: In engineering, redundancy is the duplication of critical components or functions of a system thus increasing system’s reliability, usually in backup or fail-safe form, or actual system performance improvement, like in the GNSS receivers’ case, or multi-threaded computer processing. In either case, inventory should contain some components or subsystems to replace the failed components. Factors like budget or storage space limits the number of components in inventory can be limited by. The redundancy allocation problem is a way to maximize reliability while minimizing the cost. In this work a case study on a small scale industry is conducted to show the benefits of the using a redundant system. For this purpose a product manufactured in the industry was selected and its process of production was studied. Further the availability of the machines involved in its production is calculated and thus availability of the whole system was determined. Redundancy Allocation Number (RAN) was calculated for each and every machine involved in the production of the product. A redundant system was allotted to the machine with highest RAN. After allocation of redundant system availability of the system was calculated again and compared with the original availability of the system to measure the effect of redundancy allocation on the system.
KEYWORDS: Redundancy, RAN, Industry, Machines.
I. INTRODUCTION
Reliability engineering is engineering that highlights dependability in a product’s lifecycle management. Dependability, or reliability, describes the ability of a system or component to function under stated conditions for a set time period. Reliability engineering represents a branch of systems engineering. Reliability can be defined as the probability of success as the frequency of failures; or in terms of availability, as a probability based on reliability, maintainability and testability. Maintainability, testability and maintenance are often described as a part of "reliability engineering". Reliability plays an important part in deciding the cost-effectiveness of systems
In engineering, redundancy is the duplication of critical components or functions of a system thus increasing system’s reliability, usually in backup or fail-safe form, or actual system performance improvement, like in the GNSS receivers case, or multi-threaded computer processing. Sometimes redundancy can decrease the reliability of system instead of increasing – it creates a more complex system which is prone to various issues, it may lead negligence of duty, and higher production demands which by overstressing the system may make it less safe.
II. RELATEDWORK
[2] ZhigangTian, Ming J. Zuo, presented an optimization model for a multi-state series-parallel system to jointly determine the optimal component state distribution, and optimal redundancy for each stage. The relationship between component state distribution, and component cost is discussed based on an assumption on the treatment on the components. An example is used to illustrate the optimization model with its solution approach, and that the proposed reliability-redundancy allocation model is superior to the current redundancy allocation models
[3] David W. Coit and Alice E. Smith presented a review of the different optimization approaches and present a new approach, a genetic algorithm (GA) which can solve the general class of the redundancy allocation problem. The GA is demonstrated on two different problems and compared with the other techniques. The natural extension of this work is to adapt the GA to problems where the component reliability values are governed by a probability density function. Constraints would then be based on a lower bound value for system reliability or cost. This represents a more realistic model of the design process. Also, it allows for the explicit consideration of risk-averse system designers and users.
[4] Mani Sharifia,Pedram Pourkarim Guilani, Mohammad reza Shahriaric dealt with a RAP with sub-systems. The structure of each sub-system is k-out-of-n and the redundancy strategy of each sub-system is active or cold-standby and is pre-defined. they presented an NSGA-II algorithm for solving MORAP for a series-parallel problem and kout-of-n sub-systems with 3 objectives. The objectives were reliability, cost, and weight. The components were CFR and the sub-system redundancy strategy was active and cold-standby. The results of the algorithm prepared a wide range of solution for decision makers. The further studies divided in to two categories. The first category is the solving methodology and the other multi-objective meta-heuristic algorithm like NRGA, MOPSO, and MOSA that may be used for solving the problem. The other category deals with problem specification. For example, this algorithm can be used for solving the problem with multi-state components, time dependent failure rate components, and repairable components.
[5] Fulya GİZEM AYTAÇ In this study, a special type of reliability optimization problems which is called as
redundancy allocation have been discussed from different perspectives based on a novel classification methodology, and latest trends in this field, in terms of models, solution methodologies etc., have been presented. The main purpose of this study is to provide researchers working in this field with a framework for future research direction.
III. PROBLEM FORMULATION
Availability of machine individually defines the overall availability of the production system. But each machine is made of various components which can fail randomly without any warning due to many reasons. In spite of having several advantages various small scale industries are ignorant towards redundancy, in this work the benefits of providing a redundant system on the availability of the system and thus on the overall productivity of the industry is discussed.
In order to improve the availability of the system it is necessary to detect the most influencing failure and allocate an alternative to perform that task as early as possible. In order to solve this problem various methods are used but they consider basic factors like failure rate and cost. In order to provide a more efficient solution to the problems we need to consider more factors into observation.
Redundancy allocation number is used here to select the subsystem whose failure affects the most. All variables affecting the overall productivity are covered in it. These variables are as follows:
Failure rate
Operation time
Number of total operations
Repair cost of machines
IV.EXPERIMENTAL RESULTS
The study was done in Electro auto Industry, it is a leading manufacturer of the steam turbines and transformer tanks. The company is located in Govindpura Industrial area, Bhopal.
Electro auto industry employs professional having a vast experience in the engineering field and their motto is “NO compromise in quality”. This industry is dedicated to perfect its process to increase the quality of their products. Large numbers of products are manufactured at electro auto industry, for the analysis purpose pipe flange of the transformer tank assembly was selected. It is a part of transformer tanks manufactured here. Its analysis required tracing the operational flow and time consumed in machining.
a) b)
Fig 1: a) Pipe Flange b) Pipe Flange welded with transformer assembly
This product is welded to the transformer tank to provide connection to other parts of the transformer assembly. The pipe of the flange is welded to the tank while the flange is connected to other parts through nuts and bolts. It is required that the face of the flange is smooth so the connection is air tight.
Casting of the flange is not done in the industry. Only milling, grinding, drilling and welding of the product are done in house. The machining process of the product is discussed below
Fig 2: Machining Process Of The Product
Milling Machine
In the industry a 3Hp ram turret milling machine made by PMT machines is used to perform the milling operations. It is multipurpose machine used for cutting the central hole on the flange. The part of the product to be machined is fixed on the bed of milling machine and tool is fed from above
Grinding Machine
A 850W and 100mm angle grinder made by Kulkarni Power Tools, India is used to perform the grinding operations. This is used for smoothening of the surface of the flange and remove roughness left after machining. It consists of a grinding disk made of abrasive material which strikes the surface at a high speed and smoothens the surface
Drilling Machine
In the industry a drilling machine made by SMT India, requiring 1.5 HP power is used to drill holes on the flanges for the nuts and bolts. It uses a drilling tool containing cutting edges at its point.
Welding Machine
V. CONCLUSION
DATA COLLECTION
In order to validate the adopted methodology input data containing downtime, uptime and frequency of failure and operation time, number of overtime hours, number of operation performed is collected. The production cost of the part was provided by the firm.
Failure Data
Maintenance reports and graphs of performance of each subsystem for roughly around 1 year (total time of about 6000 hours) were studied to gather failure data. From the data it can be deduced that overall availability of the machines was good and the downtime was compensated by overtime. But this statement does not stick for every firm and sometime overtime could also not help them to achieve target.
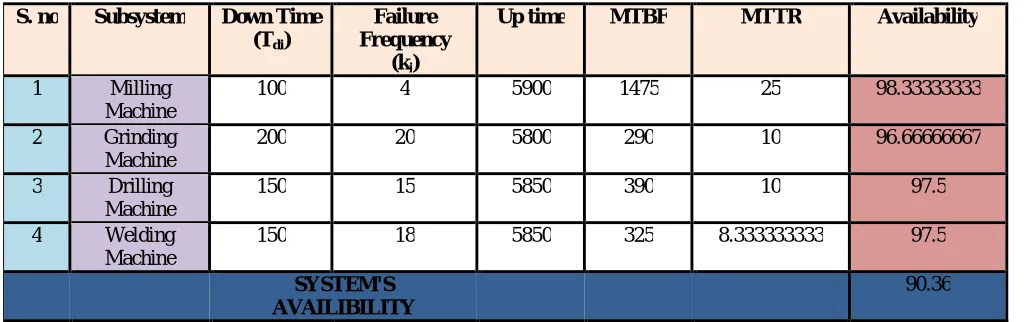
S. no Subsystem Down Time (Tdi) Failure Frequency (ki)
1 Milling Machine 100 4
2 Grinding Machine 200 20
3 Drilling Machine 150 15
4 Welding Machine 150 18
Table 6.1: Downtime and Frequency of Failure of Each system
Operation Time and Number of Operation
Total time for the machining of the part is calculated individually for every machine. These are tabulated below
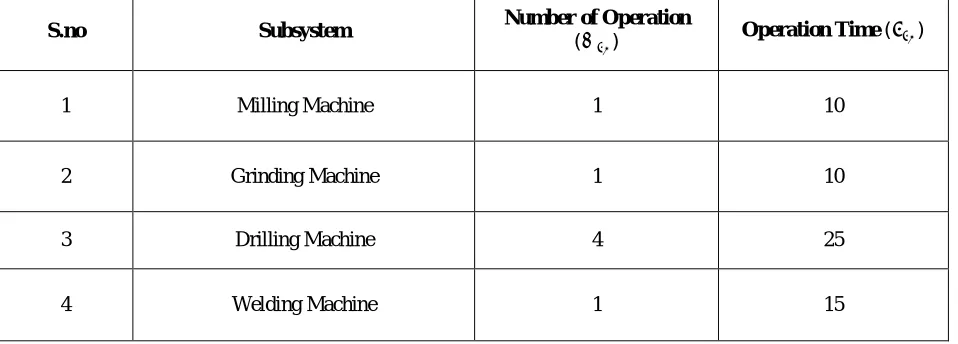
S.no Subsystem Number of Operation ( ) Operation Time ( )
1 Milling Machine 1 10
2 Grinding Machine 1 10
3 Drilling Machine 4 25
4 Welding Machine 1 15
S. no Subsystem Down Time (Tdi) Failure
Frequency (ki) Up time MTBF Failure Rate
Failure Rate Ratio
1 Milling
Machine 100 4 5900 1475 0.000677966 0.069412054
2 Grinding
Machine 200 20 5800 290 0.003448276 0.353044065
3 Drilling
Machine 150 15 5850 390 0.002564103 0.262519946
4 Welding
Machine 150 18 5850 325 0.003076923 0.315023935
SYSTEM'S FAILURE RATE 0.009767268
OVERTIME AND REPAIR COST
Due to failure of different machine overtime is required to compensate downtime. For overtime company has to provide overtime wage to the worker. Overtime wage of one worker is Rs 60/hour, and there were 8 workers on the shop floor. The repair cost of different machines collected from the maintenance report is tabulated below:
S. no Subsystem Overtime hours( ) Repair Cost ( )
1 Milling Machine 5 20000
2 Grinding Machine 1 4000
3 Drilling Machine 2 8000
4 Welding Machine 1 5000
Table 3: Overtime And Repair Cost On The Pipe Flange Availabilities of all Subsystem and System
Here total time of production is taken around 1000 hrs based on the data provided from the industry. Maintenance report provided by the industry is used to prepare a sheet for the availability of each subsystem. To calculate the availability of each subsystem data of downtime and failure frequency was considered. The calculated availability of the subsystem is tabulated below;
S. no Subsystem Down Time (Tdi)
Failure Frequency
(ki)
Up time MTBF MTTR Availability
1 Milling
Machine
100 4 5900 1475 25 98.33333333
2 Grinding
Machine
200 20 5800 290 10 96.66666667
3 Drilling Machine
150 15 5850 390 10 97.5
4 Welding
Machine
150 18 5850 325 8.333333333 97.5
SYSTEM'S AVAILIBILITY
90.36
Table 4: Availability of the production system
Allocation of RAN to Each Subsystem
The steps of allocating RAN to every subsystem are discussed below
i. Failure Rate Ratio
The failure rate ratio of each subsystem
is evaluated by calculating failure rate
of each subsystem.
S. no Subsystem Operation Time Utilization Factor
1 Milling Machine 10 0.166666667
2 Grinding Machine 10 0.166666667
3 Drilling Machine 25 0.416666667
4 Welding Machine 15 0.25
Total operation time 60
ii. Fraction of Production
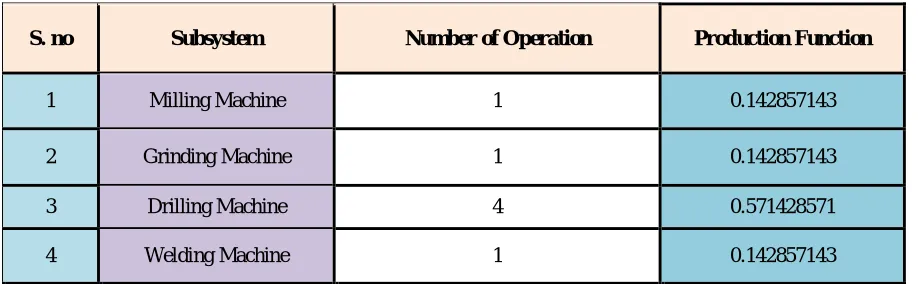
In order to calculate fraction of production the number of operations performed on every subsystem are added together.
The data is tabulated below.
S. no Subsystem Number of Operation Production Function
1 Milling Machine 1 0.142857143
2 Grinding Machine 1 0.142857143
3 Drilling Machine 4 0.571428571
4 Welding Machine 1 0.142857143
Table 6 : Production Function of the Production System
Fig 3: Production Function
iii. Utilization Factor
It is calculated by taking the operation time in to account. The calculated value of the utilization factor is shown below
Table 7: Utilization Factor
14.30% 14.30%
57% 14.40%
Production Function
Milling Machine
Grinding Machine
Drilling Machine
S. no Subsystem weightage of PF weightage of FRR
weightage of
PF weight of UF weightage of Iof RAN
1 Milling
Machine 0.285714286 0.277648214 0.285714286 0.166666667 1 730.0291664 2 Grinding
Machine 0.285714286 1.412176261 0.285714286 0.166666667 0.2 1064.557214 3 Drilling
Machine 1.142857143 1.050079784 1.142857143 0.416666667 0.4 2009.603593 4 Welding
Machine 0.285714286 1.260095741 0.285714286 0.25 0.24 1035.810026
Impact of Failure
According to the data provided by the industry the production cost of the selected part is around Rs.75000/month. Also according to overtime cost data provided by company, it pays Rs. 100 per hour to the 10 workers individually on the production line for overtime. So the extra expenditure due to failure and thus its impact on the production is tabulated below.
S.
no Subsystem Overtime Overtime Cost Repair cost Failure Impact Ratio
1 Milling Machine 5 5000 20000 0.333333333
2 Grinding Machine 1 1000 4000 0.066666667
3 Drilling Machine 2 2000 8000 0.133333333
4 Welding Machine 1 1000 5000 0.08
Table 8: Failure Impact Ratio
In order to allocate RAN to each subsystem these factor are taken into consideration. And the RAN for each subsystem is calculated as shown below
= ∝ × 1000 +
Here ϕ= -1000
The calculated values are tabulated below
Table 9: Calculation of Redundancy Allocation Number
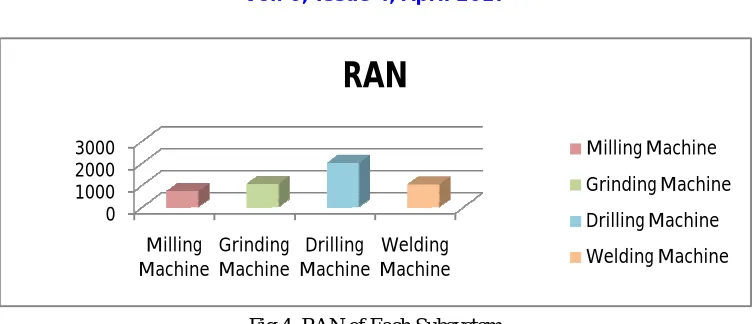
Redundancy Allocation
When all subsystem are ranked based on their RAN it is found that the drilling machine has the highest need for allocation of a redundant system. Subsystem with their ranks and RAN value is tabulated below:
S. no Subsystem RAN Ranks
1 Milling Machine 730.0291664 IV
2 Grinding Machine 1064.557214 III
3 Drilling Machine 2009.603593 I
4 Welding Machine 1035.810026 II
0 1000 2000 3000
Milling Machine
Grinding Machine
Drilling Machine
Welding Machine
RAN
Milling Machine
Grinding Machine
Drilling Machine
Welding Machine
Fig 4: RAN of Each Subsystem
Improved Subsystem and System’s Availability
After allocating the redundant system to the drilling machine and improving its maintenance schedule from monthly to fortnight the availability of the machine is calculated again. This time the down time and failure frequency is changed thus improving the availability of the system.
S.
no Subsystem
Down Time (Tdi)
Failure Frequency
(ki)
Up time MTBF MTTR
Availability
1 Milling
Machine 100 4 5900 1475 25
98.33333333
2 Grinding
Machine 200 20 5800 290 10
96.66666667
3 Drilling
Machine 50 4 5950 1487.5 12.5
99.16
4 Welding
Machine 150 18 5850 325 8.333333333
97.5
SYSTEM'S
AVAILIBILITY
91.9
Table 11: Improved Availability of the System
Availability Increment
Availability Increment % =
;
× 100
= . .
. × 100
= 1.70%
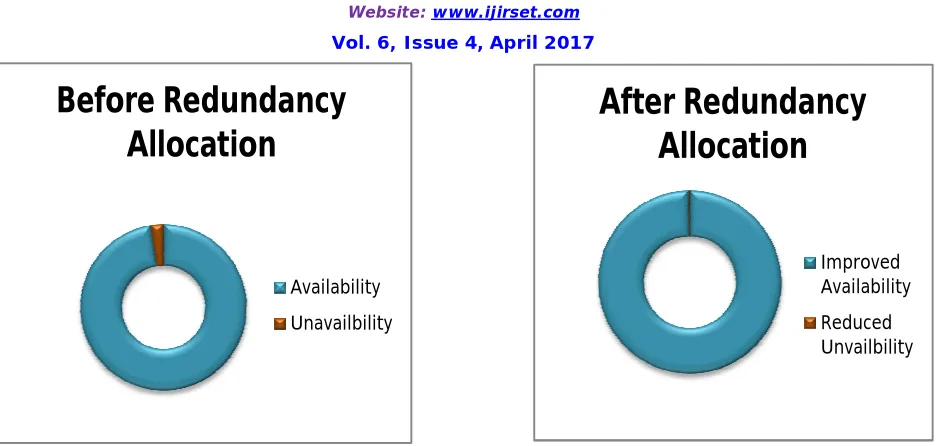
VI.RESULTS&DISCUSSION
After Redundancy
Allocation
Improved Availability
Reduced Unvailbility
Before Redundancy
Allocation
Availability
Unavailbility
Fig 7.1: Comparison of the system Availability
The RAN of the grinding as well as welding machines was also high but redundant system was allocated to the drilling machine only as its RAN was considerably much higher than both machines. But overall availability of the system is increased not only due to allocation of the redundant system but also due to improvisation of the maintenance schedule. It can be seen that as the amount of failure decrease so is the mean time between failures is decreasing, which results in the improvement of the production rate. Now the breakdown hours of this system will be reduced thus there will be no interruption in the flow of part in the different subsystem.
In this work the subsystem have good availability so the increment in the availability of the system in not much but in the industry having low availability of the system this will be more significant and the overall system’s availability would be greatly influenced.
VII. CONCLUSION
Availability of the system is an important aspect for any firm’s productivity. Allocating redundant subsystem increases the overall availability of the system and its reliability. In this work a new technique is used to specify a subsystem with series configuration to which a redundant system can be allocated thus reduce the failure rate of the system and increase its availability. This study was based on the fact that failure of a single machine can cause the breakdown of whole system. In order to allocate redundant system multi factor based redundancy allocation number is used and subsystem was selected based on this calculation.
All factors that were used to calculate the RAN had a real weightage on the productivity of the firm and they were considered based on the reports provided by the firms. At last the improvement in the overall availability of the system was checked to show the effect of redundancy allocation.
Future Scope
This research can be optimized by various methods some of them are discussed here – • Advanced mathematical tools can be used to optimize the presented model
• Various type of complex connection in system as well as subsystem can be handled by introducing some new factors
REFERENCES
1. Jing Wang Mian Li “Redundancy Allocation For Reliability Design Of Engineering systems With Failure Interactions” Proceedings of the ASME 2014 International Design Engineering Technical Conferences &Computers and Information in Engineering Conference IDETC/CIE 2014 August 17-20, 2014, Buffalo, New York, USA
3. David W. Coit and Alice E. Smith “Optimization Approaches To The Redundancy Allocation Problem For Series -Parallel Systems”
Proceedings of the Fourth Industrial Engineering Research Conference (IERC) May 1995
4. Mani Sharifia, Pedram Pourkarim Guilani, Mohammad reza Shahriari “Using NSGA II Algorithm for a Three-Objective Redundancy Allocation Problem with k-out-of-n Sub-Systems” Journal of Optimization in Industrial Engineering 19 (2016) 87-95
5. FULYA GİZEM AYTAÇ “The Redundancy Allocation Problem: A Taxonomic Review” Başkent University Institute of Science and
Engineering
6. Mani Sharifia, Mohsen Yaghoubizadeh “Reliability Modeling of the Redundancy Allocation Problem in the Series-parallel Systems and Determining the System Optimal Parameters” Journal of Optimization in Industrial Engineering 17 (2015) 67-77
7. Sadan Kulturel-Konak, Alice E. Smith, David W. Coit “Efficiently Solving the Redundancy Allocation Problem Using Tabu Search” IIE Transactions September 2002
8. Jose E. Ramirez-Marquez, David W. Coit “A heuristic for solving the redundancy allocation problem for multi-state series-parallel systems” Reliability Engineering and System Safety 83 (2004) 341–349
9. Yun-Chia Liang, Chia-Chuan Wu “A Variable Neighbourhood Descent Algorithm for the Redundancy Allocation Problem” IEMS Vol. 4, No. 1, pp. 94-101, June 2005