P o w e r S p e c t r a B a s e d S e i s m i c S t r u c t u r a l R e s p o n s e U s i n g Cross Corre-
lated F r e e - F i e l d E a r t h q u a k e M o t i o n s
Nick Simos 1), A,J. Philippacopoulos 1) and Dimitri Papandreou 2)
1) Brookhaven National Laboratory, Upton, New York, USA 2) Siemens AG, Power Generation Group (KWU), Germany
A B S T R A C T
This study attempts to re-examine the significance of the cross-correlation that may exist in the free field components of an earthquake event, and its subsequent contribution to a system response. Specifically, using as point of reference the three acceleration components of the Kobe earthquake at a recording station, strong cross- correlations are demonstrated. Further, based on a developed theoretical/computational model that allows for direct transfering of a free-field stochastic process to a multi-DOF system, the contribution of the cross terms in the free- field earthquake is assessed. Lastly, some discussion on the development of a cross-correlated free field stochastic process that may represent the family of earthquakes in the locality on the basis of observed data is presented.
I N T R O D U C T I O N
T h e need to develop acceptable earthquake floor response spectra has been an ongoing process through both
deterministic a n d stochastic means. O n one hand, the deterministic approaches seek to predict the structural
response due to a prescribed g r o u n d excitation. O n the other, the stochastic approaches attempt to envelope the
structural response to an anticipated g r o u n d excitation that belongs to a family of earthquakes that in turn is
described by target response or p o w e r spectra. It has been the practice within the stochastic processes that the
statistics which a c c o m p a n y the definition of the g r o u n d excitation to be carried over to the floor response through an
ensemble of realizations of the stochastic process defining the g r o u n d excitation. T h e direct link b e t w e e n a stochastic
characterization of the g r o u n d excitation a n d the stochastic floor response has received m u c h less attention. In [I0]
the theoretical/computational link was established that allowed the statistical properties of an anticipated family
of earthquakes, in cross spectral density form, to be transferred to a structure of deterministically defined d y n a m i c
properties. In the above study the free-field earthquake w a s generally a s s u m e d to be a 3 D - I V stochastic process
expressed through a cross-spectral density matrix. W h i l e in [I0] the contribution of the cross terms were not
assessed specifically, this study attempts to establish a process through which the contribution and/or the effect that
the cross-correlation b e t w e e n the c o m p o n e n t s of the free field earthquake has on the structural response is properly
addressed. T h e issue of the strong correlation b e t w e e n the three earthquake c o m p o n e n t s a n d its importance has been
recognized [I]. A t t e m p t s to formulate m a t h e m a t i c a l m e a n s that can generate the full stochastic process, including
the cross-correlation terms, have been m a d e in [7] a n d [8], to n a m e a few.
It is the purpose of this study to use developed m a t h e m a t i c a l tools a n d provide s o m e quantitative assessment
of the significance of the cross terms in a stochastic process that describes a real free field earthquake. A s reference,
the earthquake c o m p o n e n t s at a K o b e recording station s h o w n in Figures la, Ib a n d Ic are used to stress the point
of cross-correlation b e t w e e n the three directions. Figure 3 depicts the auto a n d cross-correlations of the acceleration
records that clearly s h o w strong correlation between the components. In general, correlation b e t w e e n the directional
c o m p o n e n t s imply strong d e p e n d e n c e of the different phases on the angle of incidence of the w a v e front.
Using the capabilities of the D I G E S code [I0], an idealized m o d e l of a reactor containment (seen as a generic
model in Figure 4), and a [3x3] free field cross spectral input,
[~input(W)],
with varying degree of correlationJ::
SMiRT 16, Washington DC, August 2001 Paper # 1754
(components shown in Figures 5a and 5b), the structural responses at a chosen location in terms of floor response spectra are evaluated and compared.
Lastly, a discussion on a possible path that will lead to the generation of a stochastic process representative of an earthquake family that exhibit correlation between its components is included.
F R E E F I E L D E A R T H Q U A K E
A N D T R A N S F E R
P R O C E S S
Consider the stationary stochastic process
g(t)
representing the free-field earthquake motion and satisfyingE [g (t)] - o
(1)
The complex unit response function
[H(w)]
connecting a multi-degree of freedom system with the free field excitationHlx (W)
Hly (w)
Hlz (w)
H2x
H2z
[ H (w)] -
H3x (w)
H3y (w)
H3z (w)
(2)o • •
H6N x
(W)
H6ny
(W)
H6N z
(W)
is a [6N x 3] matrix
T h e cross spectral density matrix of the response of the s y s t e m can be d e d u c e d f r o m
[Sour
(w)] -- [ H (w)][Sinput
(w)] [H* (w)] T (3)[Sinput(W)]
is the free-field [3x3] cross spectral density matrix while [Sout(W)] of size [6N x 6N] cross correlatesthe responses of all DOFs in the system. The diagonal terms of this matrix represent the power spectral density of the response at the particular degree of freedom. Provided that the excitation is stationary, the response is also stationary and all the mathematical relations pertaining to a stochastic process that satisfies that criterion hold. Therefore, the stochastic process in the free field that represents an earthquake family can be directly tranferred to the structure along with the stochastic properties of the family. The DIGES code that is utilized in this paper is based on this principle. The power spectral densities of the response can be easily expressed in the more conventional form of response spectrum output. When the off-diagonal terms of
[Sinput(W)]
are not zero, their contribution tothe
[Sout(W)]
will be carried to the system and they are expected to affect even the diagonal terms of[Sout(W)]
that represent directional responses. It is the objective of this study to address how important, if any, these cross terms are and search for analytical ways to generate them on the basis of real earthquake data. These issues are been discussed in the following sections.
Real Earthquake- Component Correlation
It has been accepted that strong correlations between the directional components of real earthquakes exist. These correlations stem from the arrival of the different phases of wave propagation at a given location in the free field and their connection to the impinging angle of the wave front. Given that all phases originate in the same source event, a degree of correlation will always be present, in addition to the geometric correlation. Accounting for the cross terms have been quite limited. More attention has been given to processes that represent one-directional earthquakes with spatial variation that are cross correlated through coherence functions. To address the issue of cross correlation in a 3D earthquake at a single location, actual acceleration records from the Kobe earthquake were analyzed. Specifically, the time histories for the E-W, N-S, and U-D components shown in Figure 1 were used to compute the respective autocorrelations and their cross-correlations. The result, as expected, revealed strong correlation between the three components thus re-enforcing the questions that led to this study.
Generation of Cross-Spectral Density Matrix
matrix that one h a n d satisfies all the m a t h e m a t i c a l requirements of a stochastic process a n d on the other is a reflection
of realistic earthquake data at a given site.
Consider the I-D stationary stochastic process a(t) of zero m e a n a n d autocorrelation a n d p o w e r spectral density
functions satisfying the relations,
E [a (t)]
o
E [a (t + T) a (t)] --
Raa (7".)
Saa
--1 f /
Raa
(T) e - i w T d T (4)27r oo
0 0
Rjj (T) -- Rjj
( - T ) ; j -- 1, 2, 3ROk (T) -- R°j
( - - T ) ; j , k -- 1, 2, 3 j ¢ kFor a bi-variate process, according to Shinozuka [8], in which there is a joint Gaussian density for the random phase variables (I)l and (I)2 (distributed uniformly over the interval [0,27r]), identical marginal density of mean zero, standard deviation cr and correlation coefficient p, cross-spectral densities S12 (Wl~ w2) can be derived from,
S12 (W1, W2) -- X o l (w1) X~2 ( w 2 ) e
-(l+hp)a2
(5)where h = - 1 for WlW2 _> 0 and = 1 for WlW2 _~ 0.
Given an actual earthquake in the form of ground acceleration in three principal directions, a smooth power spectral density function can be generated for each directional record. To accomplish this, the acceleration time history is converted to a response spectrum and subsequently, through a detailed procedure that is included in the DIGES code, to a matching smooth power spectrum. To accomplish this a power spectrum analytical form is chosen, such as the one shown below, and through an iterative process is matched to the spectrum. The spectral form with a parameter vector A, reflects earthquake and site parameters. Effectively, it can be said that the final form represents the family of earthquakes along a certain direction resulting from the same source.
[ ][
2
S x ( W , A ) - S o ~ P k ( I + 4 ¢ ~ )
1 - e / 1 - + 4 ¢ ~ (6)k = l
Effectively, at the end of this step the diagonal elements of the cross-spectral matrix are established. To generate the off diagonal terms, the recommendation in [8] is utilized. Specifically, realizations of ground accelerations based on the generated power spectra can be deduced from,
N
x (t) - 2
v %
+
(7)
i--1
where
wi --
i A w
andNwi
is a cutoff frequency above which the power spectrum is assumed to vanish, { ¢ i } is a vector of random phase angles uniformly distributed between 0 and 27r. The Fourier transforms of all the realizations can be computed(Xoi(w), X~i(w ))
and then inserted into (5) to generate the cross spectral terms.In addition to the approach recommended in [8], another promising methodology is listed in [6] where a set of mutually independent white noise sources are passed through a set of suitable linear systems
Aij
called an A-matrix. The computational algorithm that will allow for cross spectral matrix generation is being developed. In the next phase of this study the various recommended approaches will be compared.I L L U S T R A T I V E E X A M P L E
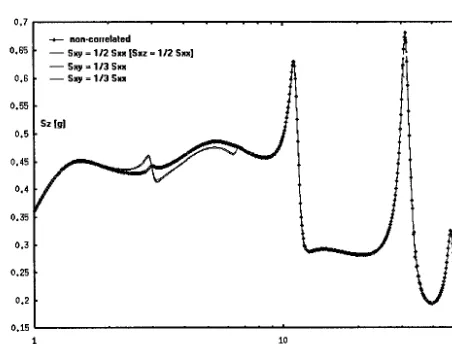
particular example chosen represents a reactor containment with inherent eccentricity (shown connected by a rigid link to the symmetric part of the model) such that the effect of the cross terms to be more pronounced. The properties of the selected model are such that the structural frequencies are within the seismic range and in particular within the prominant power frequency range of the selected earthquake. Shown in Figure 5 are power spectral densities of the cross-correlated free field. Using (3) to directly transfer the input spectral matrix to the structure, the output power spectra were evaluated for the eccentric mass of Figure 4. The directional spectral densities were used to generate the response spectra shown in Figures 6 through 8 for 2obtained for the non-correlated case that is to be used for comparative purposes and for varying degree of correlation between the x and y directions. Correlation between z and the other two directions was included but did not vary. Cross correlation between two (2) input earthquake directions appear to result in opposite trends in the response along the respective directions. Specifically, by increasing the level of correlation, response along one direction decreases with respect to the non-correlated case and along the other tends to increase. The response in the third direction (Figure 8) is less affected by the varying correlation level of the other two directions. What can be said at this point of the study is that the practice of analyzing systems with 3-component earthquake whose directional accelerations are independent may only be conservative along one of the directions of the response.
S U M M A R Y
This study addresses the effect of correlation in the directional c o m p o n e n t s of an earthquake on the structural
response. W h i l e this study is work-in-progress, it hopes to assess wether the c o m m o n practice of estimating structural
responses that are derived by analyzing the different c o m p o n e n t s separately, is conservative enough. Further, it is
believed that by expressing the earthquake input in a cross-spectral form a n d filtering it u n c h a n g e d through the
system, uncertainties of w a v e front i m p i n g m e n t a n d c o m p o n e n t geometric relations will be eleminated. It should
be noted, however, that w o r k still needs to be done in order to arrive at a m e t h o d o l o g y that satisfies all stochastic
process principles a n d derives itself from real seismic records at any site of interest.
R E F E R E N C E S
10.
1. Luco, J.E., "Linear Soil-Structure Interaction- Seismic Safety Margins Research Program," UCRL-15272, PSA No.7249809, 1980.
2. Lin, Y.K., "Probabilistic Theory of Structural Dynamics," Krieger, 1976. 3. Clough, R.W and Penzien, J., "Dynamics of Structures," McGraw Hill, 1975.
4. D. Gasparini, D., and Vanmercke, E., "Simulated Earthquake Motions Compatible with Prescribed Response Spectra," MIT/Dept. of Civil Engnrg, Report No. R76-4, 1976.
5. Pais, A. and Kausel, E., "Stochastic Response of Foundations," MIT/Dep. of Civil Engrg. Report, Research Report R85-6, 1985.
6. Bendat, J.S. and Piersol, A.G., "Engineering Applications of Correlation and Spectral Analysis," Wiley, 1980. 7. Deodatis, G., "Simulation of multi-variate stochastic process," Computational Stochastic Mechanics, pp. 297-
304, 1995.
8. Shinozuka, M., "Data-based Nonstationary Random Processes," Probabilistic Mechanics and Structural Relia- bility, pp. 39-43, 1979.
0.8
g 0.6
0.2
0
-0.2
-0.4
i i i i i i i 10 20 30 40 50 60 70
a .
gobe_EX
, 0 . 6 g
0.4 0.2 0 -0.2 -0.4 -0.6 -0°8
=eel s e c t
l - 1 l l l l l l , l 80 90 0 10 20 30 40 50 60 70 80 SO
b.
0.4 g
0.3 0.2 0.1 0 -0.1 -0.2 -0.3 -0.4
0 10 20 3O 40 5O 60 70 8O 90
C.
Figure 1. Acceleration time histories of the three components (E-W; N-S; U-D) at a recording station during the Kobe earthquake
. . . g^21$ee"3 , Kobe_El,I
. a d a ............. 1 0 0
A
0 , , . . . 0 , 0 1 0 , 1
t , . S i
I
Hz t l =
. . . .
kobe_Lr~_autocorrel Kobe_Ul)-NS_cr'oss - ~
-6
-20 -15 -10
•
I~obe_HS-EH_cross 8
6
4
2
0
-2
-4
-6
-8
-10
-12
-20
' ' ' il
, | | ;
-1S -10 -5 0
time delay {secs)
-5 5 10 15 20 ' ' '
5 10 15 20
time dela~(secs)
Figure 3. Auto and cross-correlations of Kobe earthquake components. Figure on left shows comparison between one of the autocorrelations and a cross correlation measure indicating strong cross-correlation between measured acceleration directions.
~m~
I~O-input ] . . .
... o, ... iii~i~ ~ Z ~ - f Z ~ I~,~C i:] . . . ~:
e
Figure 4. Schematic of the overall problem including the idealized model of a reactor containment structure used in the illustrative example
0.09 0.¢0 0,07 0,06 0.06 0.04 0.03 0.02 0.01 0.1
... .... ... .... ...
ft"2/sec*3
1 Hz 10
0,09
0.00
0.07 0.06 0.06 0.04 0.03 0.02 0,01 0 0.1
.. ... ... .... ... ..
It~2/rec"3
. . .
1 Hz 10
5.5 5 4.5 4 3.5 :3 2.5 2 1.5 1 0.5 0
Sa [g]
=,,,..J.L
1
strongest cross
non-cmuelated ~ Sxy = 1/3 Sxx - - [
10
H z
Figure 6. Structural response to the cross-correlated free-field earthquake in terms of floor response spectra (x-dir). Shown are varying degrees of correlation
,,,,-,.'~'~1 ~ , ~ == 1/'~ $~ ...
1
n o n - c o t [ e l a t e d
I. a 0
Figure 7. Structural response as floor response spectra (y-dir) with varying degree of correlation between x and y components.
0.7 0.65 0.6 0.55 0.5 0.45 0.4 0.35 0.3 0.25 0.2 0.15 1
non-couelated
- - Sxp = 112 Sxx [Sxz = 112 Sxx] - - Sxy = 113 Sxx - - Sxy = 113 Sxx
_ j j
. . . i , , .
10 Hz
![Figure 4 depicts the physical system. Through the DIGES model, the complete transfer function [H(w)] has been constructed and it includes kinematic interaction, foundation impedances and modal structural properties](https://thumb-us.123doks.com/thumbv2/123dok_us/1645955.1205909/3.596.104.478.381.424/physical-constructed-kinematic-interaction-foundation-impedances-structural-properties.webp)