Single-Nucleotide Polymorphisms in Soybean
Y. L. Zhu,*
,†Q. J. Song,*
,‡D. L. Hyten,* C. P. Van Tassell,
§L. K. Matukumalli,*
,**
D. R. Grimm,*
,1S. M. Hyatt,* E. W. Fickus,* N. D. Young
††and P. B. Cregan*
,2*Soybean Genomics and Improvement Laboratory, U.S. Department of Agriculture-Agricultural Research Service, Beltsville, Maryland 20705, §Animal Improvement Programs Laboratory and Gene Evaluation and Mapping Laboratory, U.S. Department of Agriculture-Agricultural
Research Service, Beltsville, Maryland 20705,††Department of Plant Pathology, University of Minnesota, St. Paul, Minnesota 55108, †Department of Bioscience and Biotechnology, Nanchang University, Nanchang 330047, People’s Republic of China,
‡Agronomy Department, Nanjing Agricultural University, Nanjing 210095, People’s Republic of China and **Bioinformatics and Computational Biology, SCS, George Mason University, Fairfax, Virginia 22030
Manuscript received May 7, 2002 Accepted for publication December 12, 2002
ABSTRACT
Single-nucleotide polymorphisms (SNPs) provide an abundant source of DNA polymorphisms in a number of eukaryotic species. Information on the frequency, nature, and distribution of SNPs in plant genomes is limited. Thus, our objectives were (1) to determine SNP frequency in coding and noncoding
soybean (Glycine maxL. Merr.) DNA sequence amplified from genomic DNA using PCR primers designed
to complete genes, cDNAs, and random genomic sequence; (2) to characterize haplotype variation in these sequences; and (3) to provide initial estimates of linkage disequilibrium (LD) in soybean. Approxi-mately 28.7 kbp of coding sequence, 37.9 kbp of noncoding perigenic DNA, and 9.7 kbp of random
noncoding genomic DNA were sequenced in each of 25 diverse soybean genotypes. Over the⬎76 kbp,
mean nucleotide diversity expressed as Watterson’swas 0.00097. Nucleotide diversity was 0.00053 and
0.00111 in coding and in noncoding perigenic DNA, respectively, lower than estimates in the autogamous
model speciesArabidopsis thaliana. Haplotype analysis of SNP-containing fragments revealed a deficiency
of haplotypesvs. the number that would be anticipated at linkage equilibrium. In 49 fragments with three
or more SNPs, five haplotypes were present in one fragment while four or less were present in the remaining 48, thereby supporting the suggestion of relatively limited genetic variation in cultivated soybean.
Squared allele-frequency correlations (r2) among haplotypes at 54 loci with two or more SNPs indicated
low genome-wide LD. The low level of LD and the limited haplotype diversity suggested that the genome of any given soybean accession is a mosaic of three or four haplotypes. To facilitate SNP discovery and the development of a transcript map, subsets of four to six diverse genotypes, whose sequence analysis would permit the discovery of at least 75% of all SNPs present in the 25 genotypes as well as 90% of the
common (frequency⬎0.10) SNPs, were identified.
S
INGLE DNA base differences between homologous max L. Merr.), which is an autogamous species, the DNA fragments plus small insertions and deletions analysis of DNA sequence variation has been mainly (indels), collectively referred to as single-nucleotide confined to single genes or DNA fragments with the goal polymorphisms (SNPs), have been shown to be the most of defining gene structure, function, or evolutionary abundant source of DNA polymorphisms in humans relationships.Scallonet al.(1987) compared 3543 bp (Kwoket al.1996;Kruglyak1997;Collinset al.1998). of theGy4glycinin locus in two genotypes and identifiedIn humans, these variations were estimated to occur at three SNPs. Subsequent work byXueet al.(1992) ana-a frequency of ana-about one per 1000 bp when ana-any two lyzed a similar region of theGy4gene in another cultivar
homologous DNA segments were compared (Cooper and found additional sequence variants.Zakharovaet et al.1985;Kwoket al.1996;Wanget al.1998). al.(1989) compared 789 bp of cDNA sequence encod-The frequency and nature of SNPs in plants is begin- ing the A3B4glycinin subunit in three soybean cultivars ning to receive considerable attention. A number of and found two SNPs. Zhu et al. (1995) sequenced a reports in Arabidopsis thaliana (L.) Heynh. and maize 400-bp fragment of restriction fragment length poly-(Zea mays ssp. mays L.) have provided estimates of se- morphism probe A-199a in three diverse soybean geno-quence diversity in these species. In soybean (Glycine types and found a total of nine SNPs. To compare SNP
frequency among DNA fragments of varying length and between populations that vary in size, measures of nucle-1Present address:Abbott Laboratories, Abbott Park, IL 60064.
otide diversity, including(Tajima1983) and(
Watt-2Corresponding author:Soybean Genomics and Improvement
Labora-erson 1975), that are normalized for length and ad-tory, Bldg. 006, Rm. 100, USDA, ARS, BARC-West, Beltsville, MD
20705. E-mail: [email protected] justed for sample size have been devised. Nucleotide
genotypes, along with a number of others (Table 1), were diversity from the four aforementioned studies of
soy-assayed to determine the frequency and nature of SNPs in bean ranges from ⫽0.00085 (Scallonet al.1987) to
soybean. The 14 genotypes were estimated byGizlice et al.
⫽0.015 (Zhuet al.1995). (1994) to have contributed 80.5% of the allelic diversity pres-As a consequence of linkage disequilibrium (LD), ent in North American soybeans. Three additional genotypes that have been used as sources of resistance to the soybean reduced genetic variability in the form of limited
haplo-cyst nematode (Heterodera glycines) were included, as were a type diversity is a frequent result. SNPs are a useful tool
number of additional cultivars that are the parents of available to quantify LD and the analysis of SNP haplotypes has
soybean recombinant inbred line mapping populations. Of been the focus of recent studies. Patil et al. (2001) the 25 genotypes, 17 are reported to be direct introductions analyzed SNP haplotype diversity across human chromo- or selections from introductions from Asia (Table 1). On the basis of the information available from the Germplasm some 21 and found an average of fewer than three
Resources Information Network (http://www.ars-grin.gov/ common haplotypes (those with a frequency ⱖ0.10).
npgs/acc/acc_queries.html), none of the 17 is derived from Generally consistent results were reported byStephens
a program of hybridization and selection. Seeds of each of et al. (2001) who analyzed SNP haplotype diversity in the 25 genotypes were obtained from the U.S. Department of 313 human genes in 82 unrelated individuals of diverse Agriculture (USDA) Soybean Germplasm Collection courtesy of Dr. Randall Nelson (USDA-ARS, University of Illinois, Ur-ancestry. On the basis of frequency of occurrence,
Ste-bana, IL).
phens et al. (2001) indicated that 80% of the global
DNA isolation:DNA was extracted from bulked leaf tissue of haplotype diversity detected was defined by three
com-30–50 plants of each of the soybean genotypes by the method mon haplotypes with mean frequencies of 0.5, 0.25, and described byKeimet al. (1988).
0.125. Selection and testing of PCR primers:From full-length genes:
A total of 90 full-length soybean genes were selected from In plants there are limited data relating to
genome-GenBank to represent a range of functions (Table 2). Primers wide haplotype diversity, but haplotype structure can
were designed using OLIGO primer design software (National be inferred from analyses of the decline of LD. In maize,
Biolabs, St. Paul) with the goal of amplifying fragments of
Tenaillonet al.(2001) reported the rapid decay of LD ⵑ500–600 bp in length containing approximately equal over only 500 bp, suggesting limited haplotype struc- amounts of coding and noncoding DNA. In several instances ture. Similar, but somewhat different conclusions were two sets of primers were selected to genes to obtain additional
sequence data. reached byRemingtonet al.(2001) who found highly
From cDNAs:A total of 88 soybean cDNAs were selected from variable rates of LD decline in different maize genes.
GenBank (Table 2). Sequences including the poly(A) tail were
Nordborg et al. (2002) indicated that in the autoga- preferentially selected so primers could be designed as close mous speciesA. thalianaLD generally declines inⵑ250 to the 3⬘-end of the transcript as possible. Primers were de-kbp (ⵑ1 cM). Studies of haplotype diversity in soybean signed as described above with predicted amplicon lengths of 300–500 bp. The rationale for the shorter predicted amplicon are limited.Coryellet al. (1999) reported the analysis
length was based upon the likelihood of an intervening in-of two SNP loci separated by 55 bp in 570 soybean
tron(s). Additional information relating to primer sequences, genotypes and found only three of the possible four fragment lengths, numbers of bases of coding and noncoding haplotypes that would be anticipated at linkage equilib- sequences, as well as the presence of SNPs in amplicons derived
rium. using PCR primers designed to complete both genes and
cDNAs can be found at http://www.genetics.org/supplemental/ In this report we assess the frequency of SNPs and
as Table S2. SNP haplotype diversity in 143 DNA fragments. These
From sequences containing mapped simple sequence repeats:The fragments were derived from coding and noncoding development of a large number of soybean simple sequence DNA associated with the coding regions, as well as ran- repeat (SSR) loci (Creganet al.1999a) provided a resource dom genomic DNA of soybean, based upon sequence of sequence-tagged sites from which to discover SNPs. Primers were designed as described above using these sequence data analysis of a group of 25 selected soybean genotypes
with predicted product lengths in the 400- to 600-bp range. representative of the genetic base of North American
From bacterial artificial chromosome subclones:The simple SSR soybean. The rationale for making these determinations marker BARC-Satt309 is closely linked to therhg1 locus, which was (1) to permit a comparison of SNP frequency and is reported to be the most important gene conditioning resis-haplotype diversity with other plant and animal species, tance to the soybean cyst nematode. Primers to BARC-Satt309 were used to identify a bacterial artificial chromosome (BAC) (2) to provide a preliminary estimate of linkage
disequi-clone, UMN-K4, as previously described by Cregan et al.
librium in soybean, and (3) to develop a strategy for
(1999b). The BAC clone was randomly subcloned into pBlues-SNP discovery aimed at the development of a pBlues-SNP-based cript as described byCreganet al.(1999c). Genomic inserts
soybean linkage map. were sequenced using the ABI Prism BigDye Terminator cycle
sequencing kit (Perkin-Elmer, Norwalk, CT; Applied Biosys-tems, Foster City, CA), using SK and/or KS primers with quence analysis on a Perkin-Elmer ABI Prism 377 DNA se-MATERIALS AND METHODS
quencer. PCR primers were designed from these sequence data as described above with predicted product lengths in the
Soybean plant material and DNA isolation:Ancestors of North
American soybean cultivars:On the basis of pedigree analysis, 400- to 600-bp range.
BLAST search of SSR flanking regions and BAC subclones:Each Gizliceet al.(1994) identified a group of 35 genotypes from
which⬎95% of the allelic variation present in North American SSR-containing sequence and each BAC subclone were
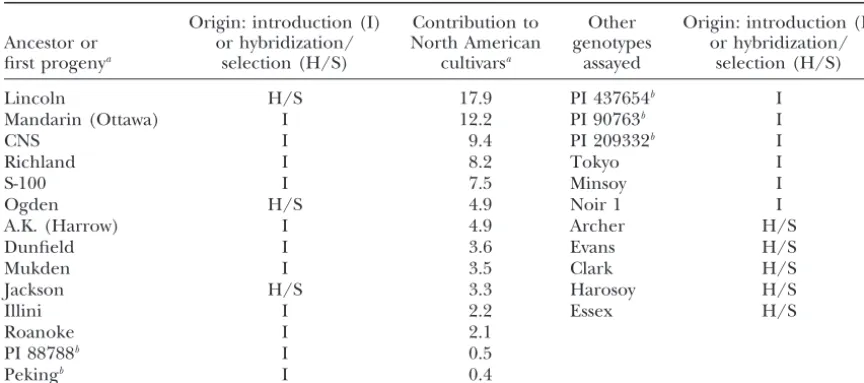
TABLE 1
Soybean genotypes analyzed for the presence of single-nucleotide polymorphisms
Origin: introduction (I) Contribution to Other Origin: introduction (I)
Ancestor or or hybridization/ North American genotypes or hybridization/
first progenya selection (H/S) cultivarsa assayed selection (H/S)
Lincoln H/S 17.9 PI 437654b I
Mandarin (Ottawa) I 12.2 PI 90763b I
CNS I 9.4 PI 209332b I
Richland I 8.2 Tokyo I
S-100 I 7.5 Minsoy I
Ogden H/S 4.9 Noir 1 I
A.K. (Harrow) I 4.9 Archer H/S
Dunfield I 3.6 Evans H/S
Mukden I 3.5 Clark H/S
Jackson H/S 3.3 Harosoy H/S
Illini I 2.2 Essex H/S
Roanoke I 2.1
PI 88788b I 0.5
Pekingb I 0.4
aFromGizliceet al. (1994). First progeny refers to genotypes including Lincoln, Ogden, and Jackson whose pedigrees are not known.
bSources of resistance to the soybean cyst nematode.
and the expressed sequence tag [EST (est)] databases to deter- “heterozygotes” would indicate the presence of two or more
paralogues. mine if any portions of the BAC subclones or SSR flanking
sequence were coding regions. Those primer sets that produced a single amplicon suitable
for sequencing were used to amplify genomic DNA from each Initial examination of PCR primers:All PCR primers were used
to amplify genomic DNA of one or two soybean genotypes. In of the remaining 24 genotypes listed in Table 1. The sequence
of each of these products was determined as described above. most cases the cultivar Lincoln was used, but in some instances
either Minsoy or Noir 1 DNA was used as template. Amplifica- When necessary, products were sequenced from both ends to
assure accurate sequence determination. tion reactions used standard PCR reagents including 30 ng
of genomic DNA template, 1.5 mmMg2⫹, 0.15mof 3⬘- and Single-nucleotide polymorphism discovery: The sequence
data from each amplicon were analyzed with PolyBayes SNP
5⬘-end primers, 100mof each nucleotide, 1⫻ PCR buffer
(10 mmTris-HCL pH 8.3, 50 mmKCl), and 2 units of Taq detection software (Marthet al. 1999). PolyBayes considers
alignment depth, the base calls in each of the sequences, the
DNA polymerase in a total volume of 50 l. PCR cycling
conditions were as follows: 45 sec denaturation at 92⬚, 45 sec associated base quality scores, the base composition in the
region, and the expecteda prioripolymorphism rate and
calcu-annealing at 50⬚(or higher depending upon optimal
anneal-ing indicated by OLIGO), and 45 sec extension at 68⬚for 32 lates the probability that sequence variants represent true
vari-ations rather than sequencing errors. Putative SNPs were ac-cycles on a MJ Tetrad thermocycler (MJ Research, Watertown,
MA). The products were analyzed on a 1.5% agarose gel cepted as true sequence variants if the probability (SNP score)
that the sequence discrepancies represented true sequence stained with ethidium bromide. Those primer sets that
pro-duced what appeared to be a single product were selected for variations, as opposed to sequencing errors, exceeded 0.99.
To avoid false negatives of low-frequency or singleton SNPs, further testing. Those that produced no products or multiple
products were further examined using lower annealing tem- the PolyBayes output (Phrap alignment) was visually
in-spected. Fragments containing visually identified sequence
peratures or higher Mg2⫹(those giving no products) or higher
annealing temperature or lower Mg2⫹(those giving multiple variants with SNP scores that did not exceed (Pⱖ0.99) were
resequenced and reanalyzed with PolyBayes. In no case was products). After these analyses, the amplicons from those
primer sets producing what appeared to be single amplicons any type of tandem repeat variant considered to be a SNP.
Statistical analyses:Nucleotide diversity (and):Nucleotide were selected for sequence analysis.
Sequence analysis of PCR products amplified from genomic diversity was estimated as, the number of segregating sites
(Watterson 1975), and its standard deviation,S() as per
DNA:After the initial determination that a set of PCR primers
appeared to produce a single amplicon from genomic DNA, Halushka et al.(1999), and as,the mean pairwise
differ-ences, and its standard deviation S() (Tajima 1983). To
the PCR product was directly sequenced using one of the
PCR primers with BigDye Terminator cycle sequencing as calculateandfor synonymous (silent nucleotide
substitu-tions) and nonsynonymous (replacement) sites, the numbers described above. The results of this sequence analysis
deter-mined if the PCR product was derived from a single locus or of synonymous and nonsynonymous sites were calculated
using DNASP sequence polymorphism software version 3.5
if it was the result of amplification from two or more
homeolo-gous regions. In those cases in which the sequence traces (RozasandRozas1999).
Tajima’s D:Tajima’s(1989)Dtest for the frequency distribu-appeared to be derived from a single locus, analysis with
Auto-Assembler software (Perkin-Elmer, Applied Biosystems) was tions of nucleotide polymorphisms was calculated for each
functional region [coding regions, untranslated regions (UTRs), used to detect ambiguous base calls that appeared as
“heterozy-gotes” that would not be anticipated from the sequence analy- introns, etc.].
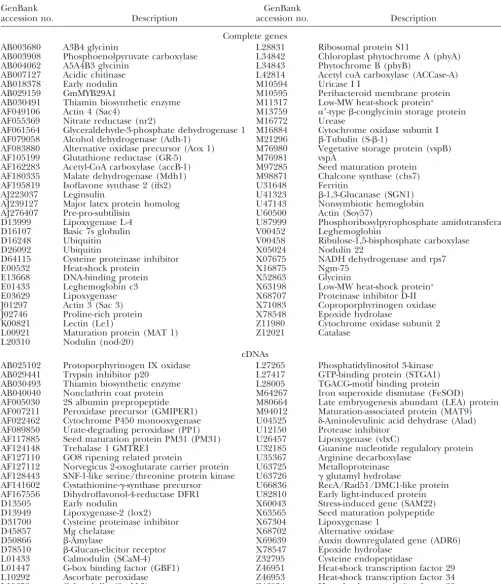
TABLE 2
GenBank accessions used in the analysis of sequence diversity
GenBank GenBank
accession no. Description accession no. Description
Complete genes
AB003680 A3B4 glycinin L28831 Ribosomal protein S11
AB003908 Phosphoenolpyruvate carboxylase L34842 Chloroplast phytochrome A (phyA)
AB004062 A5A4B3 glycinin L34843 Phytochrome B (phyB)
AB007127 Acidic chitinase L42814 Acetyl coA carboxylase (ACCase-A)
AB018378 Early nodulin M10594 Uricase I I
AB029159 GmMYB29A1 M10595 Peribacteroid membrane protein
AB030491 Thiamin biosynthetic enzyme M11317 Low-MW heat-shock proteina
AF049106 Actin 4 (Sac4) M13759 ␣⬘-type-conglycinin storage protein
AF055369 Nitrate reductase (nr2) M16772 Urease
AF061564 Glyceraldehyde-3-phosphate dehydrogenase 1 M16884 Cytochrome oxidase subunit I
AF079058 Alcohol dehydrogenase (Adh-1) M21296 -Tubulin (S--1)
AF083880 Alternative oxidase precursor (Aox 1) M76980 Vegetative storage protein (vspB)
AF105199 Glutathione reductase (GR-5) M76981 vspA
AF162283 Acetyl-CoA carboxylase (accB-1) M97285 Seed maturation protein
AF180335 Malate dehydrogenase (Mdh1) M98871 Chalcone synthase (chs7)
AF195819 Isoflavone synthase 2 (ifs2) U31648 Ferritin
AJ223037 Leginsulin U41323 -1,3-Glucanase (SGN1)
AJ239127 Major latex protein homolog U47143 Nonsymbiotic hemoglobin
AJ276407 Pre-pro-subtilisin U60500 Actin (Soy57)
D13999 Lipoxygenase L-4 U87999 Phosphoribosylpyrophosphate amidotransferase
D16107 Basic 7s globulin V00452 Leghemoglobin
D16248 Ubiquitin V00458 Ribulose-1,5-bisphosphate carboxylase
D26092 Ubiquitin X05024 Nodulin 22
D64115 Cysteine proteinase inhibitor X07675 NADH dehydrogenase and rps7
E00532 Heat-shock protein X16875 Ngm-75
E13668 DNA-binding protein X52863 Glycinin
E01433 Leghemoglobin c3 X63198 Low-MW heat-shock proteina
E03629 Lipoxygenase X68707 Proteinase inhibitor D-II
J01297 Actin 3 (Sac 3) X71083 Coproporphyrinogen oxidase
J02746 Proline-rich protein X78548 Epoxide hydrolase
K00821 Lectin (Le1) Z11980 Cytochrome oxidase subunit 2
L00921 Maturation protein (MAT 1) Z12021 Catalase
L20310 Nodulin (nod-20)
cDNAs
AB025102 Protoporphyrinogen IX oxidase L27265 Phosphatidylinositol 3-kinase
AB029441 Trypsin inhibitor p20 L27417 GTP-binding protein (STGA1)
AB030493 Thiamin biosynthetic enzyme L28005 TGACG-motif binding protein
AB040040 Nonclathrin coat protein M64267 Iron superoxide dismutase (FeSOD)
AF005030 2S albumin prepropeptide M80664 Late embryogenesis abundant (LEA) protein
AF007211 Peroxidase precursor (GMIPER1) M94012 Maturation-associated protein (MAT9)
AF022462 Cytochrome P450 monooxygenase U04525 ␦-Aminolevulinic acid dehydrase (Alad)
AF089850 Urate-degrading peroxidase (PP1) U12150 Protease inhibitor
AF117885 Seed maturation protein PM31 (PM31) U26457 Lipoxygenase (vlxC)
AF124148 Trehalase 1 GMTRE1 U32185 Guanine nucleotide regulalory protein
AF127110 GO8 ripening related protein U35367 Arginine decarboxylase
AF127112 Norvegicus 2-oxoglutarate carrier protein U63725 Metalloproteinase
AF128443 SNF-1-like serine/threonine protein kinase U63726 ␥glutamyl hydrolase
AF141602 Cystathionine-␥-synthase precursor U66836 RecA/Rad51/DMC1-like protein
AF167556 Dihydroflavonol-4-reductase DFR1 U82810 Early light-induced protein
D13505 Early nodulin X60043 Stress-induced gene (SAM22)
D13949 Lipoxygenase-2 (lox2) X63565 Seed maturation polypeptide
D31700 Cysteine proteinase inhibitor X67304 Lipoxygenase 1
D45857 Mg chelatase X68702 Alternative oxidase
D50866 -Amylase X69639 Auxin downregulated gene (ADR6)
D78510 -Glucan-elicitor receptor X78547 Epoxide hydrolase
L01433 Calmodulin (SCaM-4) Z32795 Cysteine endopeptidase
L01447 G-box binding factor (GBF1) Z46951 Heat-shock transcription factor 29
L10292 Ascorbate peroxidase Z46953 Heat-shock transcription factor 34
L19359 Calmodulin (ScaM-5) Z46954 Heat-shock transcription factor 33
1⫺兺P2
ij, where Pijis the frequency of thejth allele forith group G. Because of this known linkage relationship, only
one of these fragments (flanking regions of SSR locus locus summed across all alleles in the locus. In the case of
BARC-Satt309) was included in the analysis of genome-wide the SNPs reported here, there were only two alleles at a locus.
LD. Squared allele-frequency correlations were calculated Distribution of SNPs in coding and noncoding DNA:To
deter-as described above using haplotypes of the 54 remaining mine if SNPs were evenly distributed in the fragments assayed,
loci. theoretical SNP cumulative frequency distributions were
calcu-lated for SNPs in both coding and noncoding DNA on the basis of the assumption of uniform distribution. In the case
RESULTS of SNPs in coding regions, the cumulative frequency
distribu-tion of coding SNPs (cSNPs) was calculated assuming a
uni-Nature and frequency of SNPs in soybean:Sequence
form distribution of SNPs in these fragments. This distribution
data for 25 soybean genotypes were obtained from frag-was compared with the actual cumulative frequency
distribu-tion in these fragments using a Kolmogorov-Smirnov (KS) test ments amplified using PCR primers derived from 66
(Gibbons1976). The KS test assessed the degree of agreement complete GenBank genes and 50 cDNAs. In addition
between a sample of empirically gathered values and a target to the genes and cDNAs, sequence data were obtained
theoretical distribution. Cumulative frequency distributions
from 13 BAC subclones and 15 SSR flanking regions. also were calculated for the SNPs discovered in noncoding
The BLASTN analysis indicated that one of the BAC DNA fragments (from GenBank genes, cDNAs, and random
genomic sequence), and the KS test was used to test for devia- subclones was homologous to aG. max
aspartokinase-tion from a uniform distribuaspartokinase-tion in these fragments. homoserine dehydrogenase gene (GenBank accession
SNP haplotype frequencies in sequenced fragments:The number no. AF049708). The remaining BAC and SSR flanking of haplotypes among the 25 genotypes in fragments containing
sequences were tentatively classified as noncoding. In two or more SNPs was determined by visual inspection. A
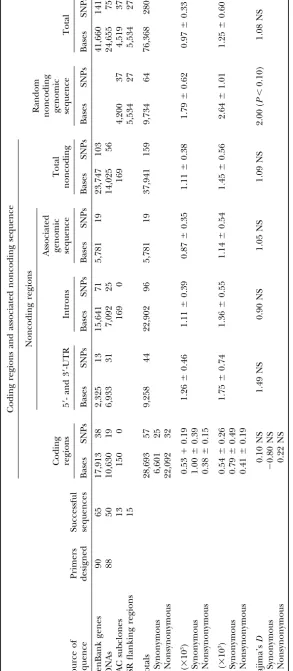
total, ⵑ28.7 kbp of coding sequence, 9.3 kbp of 5⬘
-permutation algorithm based on Churchill and Doerge
and 3⬘-UTR, 22.9 kbp of intron, and 5.8 kbp perigenic (1994) was designed to assess the likelihood that the limited
numbers of observed SNP haplotypes present in each fragment genomic sequence as well as 9.7 kbp of random
noncod-could have occurred by chance. This algorithm involves a ing genomic sequence data were obtained for each of
number of discrete steps: (1) Allele frequency at each SNP
the 25 genotypes (Table 3). A total of 280 SNPs includ-locus within each fragment was calculated on the basis of the
ing 233 single-base changes and 47 indels were identi-sample of 25 genotypes; (2) alleles at each locus within each
fied in 143 amplicons totalingⵑ76.3 kbp of sequence. fragment were randomly shuffled to create 25 hypothetical
genotypes, and the order of the shuffling was independently The mean frequency of the least common allele at the
generated for each SNP locus within a fragment; and (3) the 280 loci was 0.23 with a mean gene diversity of 0.35.
number of haplotypes present in the 25 hypothetical geno- The distribution of the allele frequencies of the least
types in the permuted data was determined. For these analyses
common allele are shown in Table 4. A total of 212 10,000,000 permutations of the observed data were generated
SNPs (76%) could be considered common (frequency for each fragment containing three or more SNPs to
character-ize the distribution of the number of haplotypes that would ⬎0.10). Of the 233 single-base changes, transitions
ac-be observed if the loci within a fragment were independent. counted for 112 (48%) and transversions for 121 (52%).
The probability of observing the number of haplotypes present MoriyamaandPowell(1996) found that transversions
in the original data or fewer was determined on the basis of
accounted for 54% of single-base changes inDrosophila the permuted data.
melanogaster, which is very similar to the 52% in soybean. LD in introductions from the Far East:For purposes of
calculat-In contrast, a 2:1 ratio of transitions to transversions has ing LD only genotypes reported to be direct introductions
from the Far East were analyzed. This was done to eliminate been reported in humans (Wanget al.1998) and mice
genotypes that would be anticipated to have reduced LD as (Lindblad-Tohet al.2000).
a result of hybridization and subsequent recombination. LD
The mean nucleotide diversity () in the 76.3 kbp of was analyzed on the following three subsets of data using
sequence analyzed was 0.00097 (Table 3). The estimate haplotypes determined from fragments containing two or
of nucleotide diversity in coding DNA ( ⫽ 0.00053) more SNPs:
was less than half that in noncoding sequence associated Subclones derived from BAC clone UMN-K4: The haplotypes of
with genes ( ⫽0.00111). Nucleotide diversities in the BAC subclones were used in the calculation of squared
UTRs, introns, and genomic sequence adjacent to genes
allele-frequency correlations (r2;Weir1996) with the
multi-were similar, ranging from ⫽ 0.00087–0.00126. In ple-allele option of Tassel 0.2 (http://statgen.ncsu.edu/
buckler/software/TASSEL/TASSEL.htm;Remingtonet al. random noncoding genomic sequence from BAC clones
2001). The significance of r2(P⬍ 0.05) was determined
and SSR flanking regions nucleotide diversity of ⫽
via permutation analysis using 1000 permutations. 0.00179 was numerically, but nonsignificantly, higher
Loci on soybean linkage group G: The SNP haplotypes of SSR
than that of the genomic DNA associated with genes.
flanking regions on soybean linkage group G (Creganet
Tajima’sDwas determined across loci in the various al. 1999a) were used in the calculation of squared
allele-frequency correlations as described above. The r2 values functional regions of genes and in genomic DNA (Table
were plotted against the known genetic distances between 3) to provide information on population structure such
loci to examine the relationship of genetic distance and as genetic bottlenecks and expanding population size
LD.
that would be anticipated to affect the entire genome Remaining loci with undefined genome positions (genome-wide LD):
rather than specific genes. Tajima’sDvalues were gener-Twelve of the 65 fragments that contained two or more
TABLE 4
Distribution of allele frequencies of the least common allele of SNPs discovered in 25 diverse soybean genotypes
Frequency of the least common allele
0–0.10 0.11–0.20 0.21–0.30 0.31–0.40 0.41–0.50
No. of SNPs (proportion) 68 (0.24) 55 (0.20) 57 (0.20) 72 (0.26) 28 (0.10)
nificant atP⬍0.10 in the 9.7 kbp of random noncoding 25 resulted from either the failure of primers to amplify (4 cases) or the amplification of two or more products genomic sequence derived from BAC clones and SSR
flanking regions. as determined via agarose gel electrophoresis (3 cases).
The failure to obtain data from the remaining 18 genes
Polymorphisms in coding regions:In the 28.7 kbp of
coding sequence analyzed, the 57 cSNPs included 51 was the result of sequence analyses that indicated het-erogeneous template, as would be anticipated if mem-single-base changes and six indels. Of the 51 mem-single-base
changes, 13, 8, and 30 were detected in the first, second, bers of a gene family or homeologous loci were ampli-fied. In the case of cDNAs, high-quality sequence data and third codon positions, respectively. A total of 25
were synonymous (no alteration in amino acid) while for all 25 genotypes were obtained for only 50 of the 88 cDNAs for which primers were designed. The failure 26 were nonsynonymous or replacement SNPs that
in-to obtain data from the remaining 38 was the result of cluded a single-base change in the third position in the
failure to amplify a product (5 cases), the amplification start codon of the glycinin gene (GenBank accession
of multiple products as determined by agarose gel elec-no. X52863) of PI 88788 that had been reported
pre-trophoresis (12 cases), and poor quality sequence data viously byScallon et al.(1987). The indels included
from what appeared to be a single PCR product on two events in accession no. AF167556, which is a
dihy-agarose (21 cases). As with the complete genes, this droflavonol-4-reductase (DFR1) gene, where two
sepa-latter outcome generally appeared to result from multi-rate insertions, one of 5 and one of 4 bases, and a
single-ple sequencing templates. base change in the third position of the stop codon
Heterogeneity of nucleotide diversity among DNA were detected in eight genotypes with a predicted
alter-fragments: The average length of the 143 amplicons
ation of the last 10 amino acids to 6 new amino acids.
analyzed for the presence of SNPs was 534 bp with a A single-base deletion in accession no. L10292, an
ascor-mean of 1.95 SNPs per amplicon. There was no sequence bate peroxidase gene, resulted in the change of the last
variation in 47 of the fragments while only 1 SNP was 4 amino acids to 11 new amino acids in the genotypes
discovered in 30 of the 143 (Table 5), suggesting an Roanoke, PI209332, and Tokyo. In GenBank accession
uneven distribution of sequence variation in this sample no. M94012, a 3-base deletion of GCT covering two
of amplicons. The Kolmogorov-Smirnov test was done codons was discovered: G(GC T)AC→GAC (Gly Tyr→
to compare the observed cumulative frequency distribu-Asp). The remaining two indels, one insertion of a
co-tions of SNPs in fragments with the theoretical distribu-don CCA and one deletion of two codistribu-dons CGACCA,
tions on the basis of the assumption of mutations being were found in GenBank accession nos. X63198 and
M13759, respectively.
TheDNASP analysis indicated that of the 28.7 kbp of
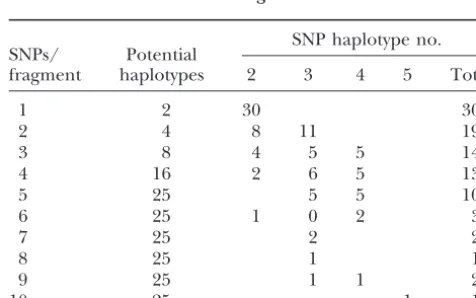
TABLE 5
coding sequence 22.1 kbp (77%) were nonsynonymous.
Numbers of SNP haplotypes observed in SNP-containing
Thus, about three-quarters of randomly occurring
sin-DNA fragments
gle-base changes in coding DNA would be anticipated to result in an amino acid alteration. However, of the
SNP haplotype no. 57 cSNPs, 32 were nonsynonymous, which included 26 SNPs/ Potential
single-base changes and 6 indels, while 25 were synony- fragment haplotypes 2 3 4 5 Total
mous. The nucleotide diversity of synonymous changes,
1 2 30 30
⫽0.00100, while not significantly greater than that
2 4 8 11 19
of nonsynonymous changes, ⫽ 0.00038, was 2.6-fold 3 8 4 5 5 14
greater. The higher frequency of synonymous cSNPs 4 16 2 6 5 13
suggests selection against mutations that result in an 5 25 5 5 10
6 25 1 0 2 3
amino acid replacement.
7 25 2 2
Failure to obtain sequence data from genes and
8 25 1 1
cDNAs:High-quality sequence data were obtained from
9 25 1 1 2
65 of the 90 complete genes to which PCR primers were 10 25 1 1
evenly distributed across the 143 fragments. In both coding and noncoding sequences, the observed and theoretical frequency distributions were determined to be significantly different (P ⬍ 0.01), indicating that there was heterogeneity in the nucleotide diversity of both the coding and noncoding DNA fragments in-cluded in this study.
SNP haplotypes and haplotype frequency:The
num-ber of SNP haplotypes present among the 25 soybean genotypes was determined in each of the 66 fragments that contained two or more SNPs (Table 5). Gene diver-sity based upon haplotypes was 0.52. In only one case were more than four haplotypes observed among the 25 genotypes. In this instance five haplotypes were
Figure1.—Linkage disequilibrium as a function of genetic found. The permutation analyses of the 49 fragments map distance based upon squared allele-frequency correla-with three or more SNPs indicated that 44 of the 49 tions (r2) among haplotypes at seven loci in a 12.5-cM region
fragments had an empirical probability of the limited on soybean linkage group G. number of haplotypes observed of ⱕ0.001. A total of
30 of the 49 fragments never had a single permutation
Genome-wide LD:Squared allele-frequency correlations randomly generated with as few haplotypes present as
were calculated among the haplotypes of 54 loci with that observed in the original data. In the five fragments
two or more SNPs. The mean r2 over all pairwise
esti-where probability did not exceed 0.001, allele
frequen-mates was 0.091 with only 8.9% of ther2values significant
cies at one or more SNP loci were maximally
asymmet-atP⬍0.05. This result indicated a low level of genome-ric. The analysis indicated a shortage of haplotypes in
wide LD in the set of 16 soybean accessions used in the relation to the number that would be anticipated at
analysis. linkage equilibrium.
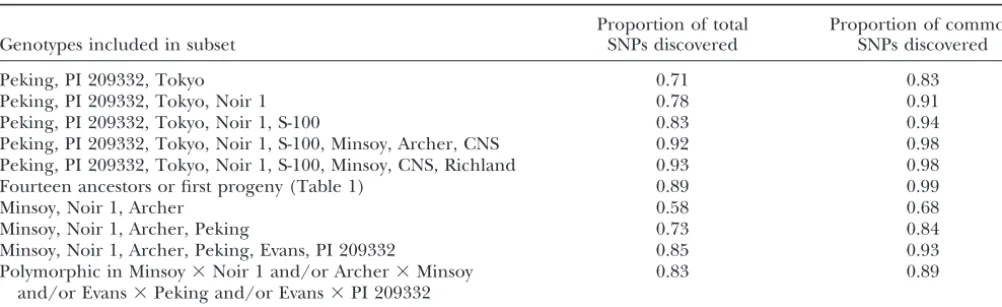
A subset of genotypes with maximum SNP diversity:
LD in introductions from the Far East:Among subclones
If the 25 genotypes analyzed here are representative of of BAC UMN-K4:Squared allele-frequency correlations
North American cultivated soybean, the limited number (r2) were calculated among each of the seven subclones
of haplotypes suggested that SNP discovery might pro-with two or more SNPs discovered in 16 genotypes that
ceed with the sequence analysis of a relatively small were direct introductions from Asia (Table 1). The
an-selected set of genotypes. The three genotypes whose cestral cultivar Illini was eliminated from the analysis
analysis would detect the largest proportion (71%) of all because it was determined to be identical at all SNP loci
280 SNPs and 83% of the 212 common SNPs discovered to A.K. (Harrow). Both Illini and A.K. (Harrow) were
among all 25 genotypes were Peking, PI 209332, and selected from the older cultivar A.K. and were
antici-Tokyo (Table 6). The addition of the fourth genotype, pated to be similar. The mean r2value for the 21
esti-Noir 1, brought these figures to 78 and 91%, respec-mates of LD was 0.36 and 18 of the 21 estirespec-mates of r2
tively. Two sets of 8 genotypes would permit the discov-indicated significant LD (P ⬍ 0.05). The positions of
ery of⬎90% of the total SNPs and 98% of the common the subclones in the 110-kbp BAC clone UMN-K4 BAC
SNPs. A total of 89% of the total and 99% of the com-are not known; however, a simulation analysis using
mon SNPs were polymorphic in the 14 soybean geno-1000 permutations indicated that seven 550-bp
frag-types that contributed 80.5% of the allelic diversity pres-ments drawn at random from a 110-kb BAC would span
ent in North American soybeans. The 6 genotypes a region of at least 53.9 kbp (P ⬎ 0.95). Thus,
signifi-Minsoy, Noir 1, Archer, Peking, Evans, and PI 209332 cant r2 values among most subclones suggest that LD
represent the parents of recombinant inbred line (RIL) exists over a distance ofⵑ50 kbp in this region of the
mapping populations available in our laboratory (Univer-soybean genome.
sity of Utah Minsoy⫻Noir 1 and Archer⫻Minsoy and Among loci on soybean linkage group G:The SNP
haplo-University of Minnesota Evans ⫻ Peking and Evans ⫻ types of flanking regions of seven SSR loci in soybean
PI 209332). The SNPs detected in these 6 genotypes linkage group G were used to provide an initial estimate
included 85% of the total and 93% of the common of the relationship of LD with genetic map distance.
SNPs. Totals of 83 and 89% of the total and common The loci cover a map distance of 12.5 cM. The meanr2
SNPs could be mapped in at least one of the aforemen-of the 21 pairwise estimates aforemen-of LD was 0.14 and only
tioned RIL populations, respectively. four of the r2 values were significant (P ⬍ 0.05). The
trend line developed from the plot ofr2against genetic
map distance is presented in Figure 1. Although these
DISCUSSION data are limited, it appears that LD has significantly
TABLE 6
The proportion of total SNPs and common SNPs (frequency⬎0.10) discovered in 25 soybean genotypes by
the analysis of selected subsets of genotypes
Proportion of total Proportion of common
Genotypes included in subset SNPs discovered SNPs discovered
Peking, PI 209332, Tokyo 0.71 0.83
Peking, PI 209332, Tokyo, Noir 1 0.78 0.91
Peking, PI 209332, Tokyo, Noir 1, S-100 0.83 0.94
Peking, PI 209332, Tokyo, Noir 1, S-100, Minsoy, Archer, CNS 0.92 0.98
Peking, PI 209332, Tokyo, Noir 1, S-100, Minsoy, CNS, Richland 0.93 0.98
Fourteen ancestors or first progeny (Table 1) 0.89 0.99
Minsoy, Noir 1, Archer 0.58 0.68
Minsoy, Noir 1, Archer, Peking 0.73 0.84
Minsoy, Noir 1, Archer, Peking, Evans, PI 209332 0.85 0.93
Polymorphic in Minsoy⫻Noir 1 and/or Archer⫻Minsoy 0.83 0.89
and/or Evans⫻Peking and/or Evans⫻PI 209332
in cultivated soybean. The initial estimate suggests that Outcrossing species are generally more effective at purg-ing deleterious mutations as a result of large effective mean nucleotide diversity is much lower in soybean ( ⫽
0.00097) than in the wild plantA. thaliana.Numerous population size. Soybean, like Arabidopsis, has a low ratio of synonymous to nonsynonymous mutation, sug-reports of sequence variation in individual Arabidopsis
genes (KawabeandMiyashita1999;Puruggananand gesting the presence of a relatively high level of slightly deleterious mutations.
Suddith1999;Kawabeet al. 2000;Kuittinenand
Agu-ade2000) have indicated a level of nucleotide diversity A notable difference between sequence diversity in soybeanvs.reports in humans was the relative levels of 5- to 8-fold higher than what we have detected in
domes-ticated soybean. Likewise, data from maize (Tenaillon nucleotide diversity in coding and noncoding sequences. In the reports ofHalushkaet al.(1999) andCargill
et al. 2001) indicated diversity ( ⫽ 0.0096) 10-fold
greater than that in soybean. This calculation was based et al. (1999) sequence polymorphism in humans was essentially identical in coding and closely associated on⬎14 kbp of sequence from each of 25 inbreds and
exotic landraces. The level of sequence diversity in an noncoding DNA.Cargillet al. (1999) suggested that the similar nucleotide diversity might be indicative of inbreeding species is expected to be lower than that
in an outcrossing species because of smaller effective regulatory or splicing function of noncoding perigenic sequence. In soybean, nucleotide diversity was 2.2 times population size (Pollak1987) and as a result of
addi-tional effects of background selection (Nordborget al. greater in noncoding DNA closely associated with cod-ing sequence and in D. melanogaster it was 2.6 times 1996). Nonetheless, nucleotide diversity in the soybean
germplasm included in our analysis is lower than some greater (Moriyama and Powell 1996). Data derived from three studies in Arabidopsis (Kawabeand
Miyas-of the lowest values reported in Arabidopsis,the model
selfing species. For example,Olsenet al. (2002) noted hita1999;Kawabeet al. 2000;KuittinenandAguade
2000) indicated that perigenic sequences had levels of the unusually low nucleotide variation in theTERMINAL
FLOWER1( ⫽0.0017) andLEAFY( ⫽0.0033; calcu- nucleotide diversity that were 2.6 times greater than that of the associated coding sequence. Apparently the lated fromOlsenet al. 2002) loci in Arabidopsis. The
relatively low level of sequence diversity we have ob- level of functional constraint on perigenic sequence in soybean, Arabidopsis, and D. melanogaster is less than served in soybean supports concerns of the narrow
ge-netic base of North American soybean (Committee on that in humans.
Limited haplotype diversity: The small number of
Genetic Vulnerability of Major Crops 1972;
Giz-liceet al. 1994). haplotypes observed in our data suggests that the ge-netic base of cultivated soybean is built upon a small The ratio of synonymous to nonsynonymous changes
in soybean (2.6) was somewhat lower than the ratio of group of progenitor genotypes. This may be the result of a small number of domestication events from the 4.8 reported in maize (Tenaillonet al.2001) and much
lower than the 8.7 ratio reported inD. melanogaster(Mor- wild relativeG. soja.Alternatively, the limited haplotype diversity observed here may be only the result of the
iyamaandPowell1996). In Arabidopsis,Olsenet al.
(2002) analyzed six genes in the floral development narrow genetic base of North American soybean germ-plasm or of limited variability in G. soja. A number of pathway and found ratios of
synonymous/nonsynony-mous nucleotide diversity ranging from 0.5 to 9.5 reports have documented the small group of progenitor genotypes that form the genetic base of North American (mean⫽ 2.9). Low diversity at nonsynonymous sites is
Vulner-ability of Major Crops1972;Delannayet al. 1983). The lack of genome-wide LD coupled with the limited haplotype diversity suggests that the cultivated soybean A comparison of sequence and haplotype diversity of
North American and AsianG. maxgenotypes along with genome is a mosaic of a limited number of haplotypes that may be the result of recombination among three a representative sample ofG. sojagenotypes would
pro-vide useful information to serve as a guide in the devel- or four ancestral haplotypes. Some natural outcrossing does occur in soybean despite its autogamous nature. opment of strategies aimed at enhancing the genetic
variability available for soybean improvement. The progeny of these rare outcrosses might have one or more distinctive features that would cause them to
Linkage disequilibrium in soybean: Our data
indi-cated that over relatively short distances of perhaps 50 be the target of selection. Such cycles of outcrossing and selection could result in substantial recombination kbp there is little decay in LD in soybean. This
conclu-sion is based upon limited data from a set of subclones over a period of⬎3000 years since the estimated time of the domestication of the soybean, which probably derived from one BAC clone that is 110 kbp in length.
This finding is in marked contrast to reports in maize took place in China during the Shang Dynasty (ca. 1700– 1100bc) or earlier (Hymowitz1990). Another alterna-indicating that LD, as estimated byr2, decayed to values
⬍0.10 within 1500 bp (Remingtonet al.2001). An even tive is that the haplotype structure of the soybean ge-nome predates domestication. Whatever the origins of more rapid rate of LD decay was noted byTenaillon
et al.(2001) in the analysis of genes on maize chromo- haplotype structure in the soybean genome it is impor-tant to further define that structure.Nordborg et al. some 1. Because of its autogamous nature, LD decay in
Arabidopsis is likely to be more comparable to that (2002) concluded that the extensive haplotype structure ofA. thalianaindicated that the development of a link-of soybean. Reports by Hanfstingl et al. (1994) and
Aguade (2001) studied individual Arabidopsis genes age disequilibrium map of Arabidopsis is feasible. Our limited data relating to the decay of LD in soybean and found limited recombination over distances of 1.2–
2.6 kbp, indicative of high levels of LD over short dis- suggest that the haplotype structure may be somewhat more extensive than that in Arabidopsis. However, a tances as would be anticipated in soybean.
The second estimate of LD reported here was also systematic assessment of genome-wide LD in soybean is clearly needed. Such an analysis would permit an based upon limited data derived from the SNPs
discov-ered in seven SSR flanking regions on soybean linkage appraisal of the likelihood that association analysis (CardonandBell2001) could be successfully applied group G. These data are quite variable as evidenced by
large deviations from the trend line developed from for gene discovery in soybean.
A soybean transcript map: One of the objectives of
the plot of the squared allele-frequency correlations on
genetic map distance (Figure 1). Nonetheless, LD as this research was to develop a strategy for SNP discovery aimed at the development of a SNP-based soybean link-estimated byr2decays to⬍0.10 at genetic map distances
⬎2.5 cM. Recent work byNordborget al.(2002) indi- age map. The large amount of soybean EST sequence data is a resource that may be useful for in silicoSNP cated that in Arabidopsis LD dissipates over distances
of 1 cM, which corresponds toⵑ250 kbp. These authors discovery as well as for the design of sequence-tagged sites (STSs) for SNP discovery via resequencing. The found a generally similar level of LD decay across the
Arabidopsis genome. Reports from other species have mapping of these SNPs would create a transcript map with candidate genes to associate with quantitative trait noted wide variation in LD decay in different genome
regions. For example, highly variable rates of LD decline loci. Information on nucleotide diversity, the rate of success with which STSs can be developed from EST were observed among different maize genes (
Reming-tonet al. 2001). Likewise, in humans wide variation in and genomic sequence, and SNP distribution allow an estimate of the feasibility of creating such a map. Of LD decay has been observed among genes (Stephens
et al. 2001) and among genomic regions (Reichet al. the 178 primer sets designed to complete genes and cDNAs, 115 yielded a sequence-tagged site from which 2001). Additional estimates of LD decline in soybean
will be necessary to determine if the LD decay observed sequence data were obtained. To a great extent, the failure to convert primer sets into STSs was the result in the 12.5-cM region on linkage group G is typical of
the soybean genome. of the amplification of multiple sites. Previous reports
of genome duplication in soybean suggest the occur-Our assessment of genome-wide LD used haplotypes
at 54 loci that we assumed were distributed across the rence of tetraploidization as well as other duplication events (Shoemakeret al.1996).Shoemakeret al.(1996) soybean genome. There was no reason to suggest that
randomly selected genes and cDNAs would derive from estimated that, on average, a given chromosomal seg-ment was duplicated 2.55 times in the soybean genome. only one or a few linkage groups. This analysis, like those
of localized LD, used the subset of 16 Asian soybean Because a STS is required both for SNP discovery via resequencing and for most methods of SNP detection, introductions that were not derivatives of modern
breeding programs and therefore artificial hybridiza- soybean genome duplication will no doubt reduce the efficiency and increase the cost of SNP discovery. tion and recombination had not contributed to the
(GenBank genes ⫹ cDNAs ⫹ 1 BAC subclone; Table tide diversity is expected to be greatest. Primer testing may be expedited by heteroduplex analysis of a homozy-3) or a rate of 3.24 SNPs/kbp in these 25 soybean
geno-types. The average length of the 116 gene fragments gous genotype to eliminate those primer sets that am-plify multiple (and heterogeneous) amplicons. Putative was 574 bp and at the rate of 3.24 SNPs/kbp, one would
anticipate 1.86 SNPs per fragment. Under these circum- locus-specific primer sets can then be used to amplify genomic DNA of a pool of diverse genotypes followed stances, a rough estimate of the probability of finding at
least one SNP in a 574-bp fragment is [1⫺(0.99676)574]⫽ by heteroduplex analysis to identify SNP-containing
fragments. Heteroduplex analysis for SNP discovery us-0.776 and one would anticipate 90 of the 116 STSs to
contain at least 1 SNP. However, at least 1 SNP was ing denaturing HPLC is well established (Jinet al. 1995). When heteroduplexes are detected, the individual geno-discovered in only 74 of the gene or perigenic DNA
fragments analyzed. The heterogeneous distribution of types can be sequenced or the amplicon derived from the pooled genotypes can be sequenced as suggested SNPs was detected by the KS tests and is a phenomenon
that is not unique to soybean. Similar evidence of wide byTaillon-Milleret al.(1999).
The identification of a small set of soybean genotypes differences in nucleotide diversity of genes and gene
fragments has been reported in maize (Tenaillonet al. in which sequence diversity is maximized will enhance the efficiency of SNP discovery. Sequence analysis of 2001), Arabidopsis (Olsenet al.2002),D. melanogaster
(MoriyamaandPowell1996), and humans (Cargill the six genotypes Minsoy, Noir 1, Archer, Evans, Peking, and PI 209332 (Table 6) is likely to identify most se-et al.1999;Halushkaet al.1999). Thus, heterogeneity
of nucleotide diversity is likely to reduce the success quence variants in North American soybean germplasm. Likewise, most of these variants will segregate in at least rate at which a SNP can be discovered in any given gene
or gene fragment. one of the RIL mapping populations available in our
laboratory. These readily available populations are well
A strategy for SNP discovery in soybean: While
ge-nome duplication and heterogeneity of nucleotide di- characterized and have well-developed molecular ge-netic maps. An important and unanswered question versity across fragments will negatively impact the
likeli-hood of successfully discovering sequence variation in is the utility of SNPs discovered in North American germplasm in a wider range of cultivated and wild soybean a particular DNA fragment, the knowledge that
nucleo-tide diversity is more than twofold greater in noncoding germplasm. If North American genotypes represent a unique soybean subpopulation in terms of sequence and perigenic DNA than in coding sequence suggests that
SNP discovery should focus on these noncoding regions. haplotype diversity, then the strategy suggested here for SNP discovery will need to be modified. If we are to The increasing availability of 3⬘-UTR data in soybean
will be useful in this regard. Another approach to max- successfully mine germplasm using the power of associa-tion analysis it is important to have at least a basic under-imizing the usefulness of the large soybean EST database
is an intron prediction protocol being used in SNP dis- standing of the variability of the target germplasm for which these analyses are intended.
covery in cattle (Bos taurus;Stoneet al. 2002). Introns
are predicted on the basis of comparison of cattle EST The authors thank Joann Mudge for her assistance in the identifica-sequence with homologous human genomic identifica-sequence tion of BAC clone UMN-K4. The authors thank the United Soybean
Board (USB grants 9222 and 1243) for support of this research. so that primers can be designed to the exon sequence
around predicted intron-exon splice sites. The resulting amplification product from genomic DNA is composed
mainly of intron sequence and would therefore be antic- LITERATURE CITED
ipated to have a greater likelihood of sequence
varia-Aguade, M., 2001 Nucleotide sequence variation at two genes of tion. In the case of soybean, the availability of an essen- the phenylpropanoid pathway, theFAH1andF3Hgenes, in
Arabi-dopsis thaliana.Mol. Biol. Evol.18:1–9. tially complete genome sequence ofA. thalianashould
Cardon, L. R., andJ. I. Bell, 2001 Association study designs for permit the use of a similar approach for intron
predic-complex diseases. Nat. Rev. Genet.2:91–99.
tion in combination with soybean EST data. The geno- Cargill, M., D. Altshuler, J. Ireland, P. Sklar, K. Ardlieet al.,
1999 Characterization of single-nucleotide polymorphisms in
mic sequence of the model legumeMedicago truncatula
coding regions of human genes. Nat. Genet.22:231–238.
should be more useful in this type of analysis. In
addi-Churchill, G. A., and R. W. Doerge, 1994 Empirical threshold tion, while we assayed onlyⵑ10 kbp of random genomic values for quantitative trait mapping. Genetics138:963–971.
Collins, F. S., L. D. BrooksandA. Charkravarti, 1998 A DNA sequence, the level of sequence diversity was higher,
polymorphism discovery resource for research on human genetic although nonsignificantly higher than that in the
non-variation. Genome Res.8:1229–1231.
coding DNA associated with genes. This suggests that Committee on Genetic Vulnerability of Major Crops, 1972
Ge-netic Vulnerability of Major Crops. National Academy of Science, the BAC-end sequence will be a good source of data for
Washington, DC. SNP discovery as will SSR flanking regions.
Cooper, D. N., B. A. Smith, H. J. Cooke, S. Niemann and J. The data reported here from a diverse set of soybean Schmidtke, 1985 An estimate of unique DNA sequence
hetero-zygosity in the human genome. Hum. Genet.69:201–205.
genotypes indicate the feasibility of large-scale SNP
dis-Coryell, V. H., H. Jessen, J. M. Schupp, D. WebbandP. Keim, 1999 covery in soybean and also provide guidance for such
Allele-specific hybridization markers for soybean. Theor. Appl. an effort. Discovery needs to focus, when possible, on Genet.98:690–696.
nucleo-et al., 1999a An integrated genetic linkage map of the soybean Patil, N., A. J. Berno, D. A. Hinds, W. A. Barrett, J. M. Doshiet
al., 2001 Blocks of limited haplotype diversity revealed by
high-genome. Crop Sci.39:1464–1490.
Cregan, P. B., J. Mudge, E. W. Fickus, L. F. Marek, D. Daneshet resolution scanning of human chromosome 21. Science 294: 1669–1670.
al., 1999b Targeted isolation of simple sequence repeat markers
through the use of bacterial artificial chromosomes. Theor. Appl. Pollak, E., 1987 On the theory of partially inbreeding finite
popula-tions. I. Partial selfing. Genetics117:353–360.
Genet.98:919–928.
Cregan, P. B., J. Mudge, E. W. Fickus, D. Danesh, R. Dennyet al., Purugganan, M. D., andJ. I. Suddith, 1999 Molecular population genetics of floral homeotic loci: departures from the
equilibrium-1999c Two simple sequence repeat markers to select for soybean
cyst nematode resistance conditioned by therhg1locus. Theor. neutral model at theAPETALA3andPISTILLATAgenes of
Arabi-dopsis thaliana.Genetics151:839–848.
Appl. Genet.99:811–818.
Delannay, X., D. M. RodgersandR. G. Palmer, 1983 Relative Reich, D. E., M. Cargill, S. Bolk, J. Ireland, P. C. Sabetiet al.,
2001 Linkage disequilibrium in the human genome. Nature
genetic contributions among ancestral lines to North American
soybean cultivars. Crop Sci.23:944–949. 411:199–204.
Remington, D. L, J. M.Thornsberry, Y.Matsuoka,L. M.Wilson, Gibbons, J. D., 1976 Nonparametric Methods for Quantitative Analysis,
pp. 56–77. Holt, Rinehart & Winston, New York. S. R.Whittet al., 2001 Structure of linkage disequilibrium and
phenotypic associations in the maize genome. Proc. Natl. Acad. Gizlice, Z., T. E. CarterandJ. W. Burton, 1994 Genetic base for
North American public soybean cultivars released between 1947 Sci. USA98:11479–11484.
Rozas, J., andR. Rozas, 1999 DnaSP version 3: an integrated
pro-and 1988. Crop Sci.34:1143–1151.
Halushka, M. K., J. B. Fan, K. Bentley, L. Hsie, N. Shenet al., 1999 gram for molecular population genetics and molecular evolution
analysis. Bioinformatics15:174–175.
Patterns of single-nucleotide polymorphisms in candidate genes
for blood-pressure homeostasis. Nat. Genet.22:239–247. Scallon, B. J., C. D. DickinsonandN. C. Nielsen, 1987
Character-ization of a null-allele for theGy4glycinin gene from soybean.
Hanfstingl, U., A. Berry, E. A. Kellogg, J. T. Costa, W. Rudiger
et al., 1994 Haplotypic divergence coupled with lack of diversity Mol. Gen. Genet.208:107–113.
Shoemaker, R. C., K. Polzin, J. Labate, J. Specht, E. C. Brummer
at theArabidopsis thalianaalcohol dehydrogenase locus: Roles for
both balancing and directional selection? Genetics138:811–828. et al., 1996 Genome duplication in soybean (Glycinesubgenus
soja). Genetics144:329–338.
Hymowitz, T., 1990 Soybeans: the success story, pp.159–163 in
Ad-vances in New Crops, edited by J.Janickand J.Simon. Timber Stephens, J. C., J. A. Schneider, D. A. Tanguay, J. Choi, T. Acharya et al., 2001 Haplotype variation and linkage disequilibrium in Press, Portland, OR.
Jin, L., P. A. Underhill, P. J. OefnerandL. L. Cavalli-Sforza, 313 human genes. Science293:489–493.
Stone, R. T., W. M. Grosse, E. Casas, T. P. Smith, J. W. Keeleet
1995 Systematic search for polymorphisms in the human
ge-nome using denaturing high-performance liquid chromatogra- al., 2002 Use of bovine EST data and human genomic sequences
to map 100 gene-specific bovine markers. Mamm. Genome13:
phy (DHPLC). Am. J. Hum. Genet.57(Suppl.): A26.
Kawabe, A., andN. T. Miyashita, 1999 DNA variation in the basic 211–215.
Taillon-Miller, P., E. E.Piernotand P.-Y.Kwok, 1999 Efficient
chitinase locus (ChiB) region of the wild plantArabidopsis thaliana.
Genetics153:1445–1453. approach to unique single-nucleotide polymorphism discovery.
Genome Res.9:499–505.
Kawabe, A., K. YamaneandN. T. Miyashita, 2000 DNA
polymor-phism at the cytosolic phosphoglucose isomerase (PgiC) locus of Tajima, F., 1983 Evolutionary relationship of DNA sequences in
finite populations. Genetics105:437–460.
the wild plantArabidopsis thaliana.Genetics156:1339–1347.
Keim, P., T. OlsonandR. Shoemaker, 1988 A rapid protocol for Tajima, F., 1989 Statistical nethods for testing the neutral mutation
hypothesis by DNA polymorphism. Genetics123:585–595.
isolating soybean DNA. Soybean Genet. Newsl.15:150–152.
Kruglyak, L., 1997 The use of a genetic map of biallelic markers Tenaillon, M. I., M. C. Sawkins, A. D. Long, R. L. Gaut, J. F. Doebleyet al., 2001 Patterns of DNA sequence polymorphism
in linkage studies. Nat. Genet.17:21–24.
Kuittinen, H., andM. Aguade, 2000 Nucleotide variation at the along chromosome 1 of maize (Zea maysssp.maysL.). Proc. Natl.
Acad. Sci. USA98:9161–9166.
CHALCONE ISOMERASElocus inArabidopsis thaliana.Genetics
155:863–872. Wang, D. G., J. B. Fan, C. J. Siao, A. Berno, P. Younget al., 1998
Large-scale identification, mapping, and genotyping of single-Kwok, P.-Y., Q.Deng, H.Zakeriand D. A.Nickerson, 1996
Increas-ing the information content of STS-based genome maps: identi- nucleotide polymorphisms in the human genome. Science280:
1077–1082.
fying polymorphisms in mapped STSs. Genomics31:123–126.
Lindblad-Toh, K., E. Winchester, M. J. Daly, D. G. Wang, J. N. Watterson, G. A., 1975 On the number of segregating sites in
genetical models without recombination. Theor. Popul. Biol.7:
Hirschhornet al., 2000 Large-scale discovery and genotyping
of single-nucleotide polymorphisms in the mouse. Nat. Genet. 256–276.
Weir, B. S., 1990 Genetic Data Analysis Methods for Discrete Genetic Data.
24:381–385.
Marth, G. T., I.Korf, M. D.Yandell, R. T.Yeh, Z.Guet al., 1999 Sinauer Associates, Sunderland, MA.
Weir, B. S., 1996 Genetic Data Analysis II. Sinauer Associates, Sunder-A general approach to single-nucleotide polymorphism discovery.
Nat. Genet.23:452–456 land, MA.
Xue, Z. T., M. L. Xu, W. Shen, N. L. Zhuang, W. M. Huet al., 1992 Moriyama, E. N., andJ. R. Powell, 1996 Intraspecific nuclear DNA
variation in Drosophila. Mol. Biol. Evol.13:261–277. Characterization of aGy4glycinin gene from soybeanGlycine max
Nordborg, M., B. Charlesworth and D.Charlesworth, 1996 cv. Forrest. Plant Mol. Biol.18:897–908.
Increased levels of polymorphism surrounding selectively main- Zakharova, E. S., S. M. EpishinandY. P. Vinetski, 1989 An attempt
tained sites in highly selfing species. Proc. R. Soc. Lond. Ser. B to elucidate the origin of cultivated soybean via comparison of
263:1033–1039. nucleotide sequences encoding glycinin B4polypeptide of
culti-Nordborg, M., J. O. Borevitz, J. Bergelson, C. C. Berry, J. Chory vated soybean,Glycine max, and its presumed wild progenitor, et al., 2002 The extent of linkage disequilibrium inArabidopsis Glycine soja.Theor. Appl. Genet.78:852–856.
thaliana.Nat. Genet.30:190–193. Zhu, T., L. Shi, J. J. DoyleandP. Keim, 1995 A single nuclear locus Olsen, K. M., A. Womack, A. R. Garrett, J. I. SuddithandM. D. phylogeny of soybean based on DNA sequence. Theor. Appl.
Purugganan, 2002 Contrasting evolutionary forces in theAra- Genet.90:991–999. bidopsis thaliana floral developmental pathway. Genetics 160: