DOI: 10.1534/genetics.107.075515
Comparative Analyses Between Lolium/Festuca Introgression Lines
and Rice Reveal the Major Fraction of Functionally Annotated
Gene Models Is Located in Recombination-Poor/Very
Recombination-Poor Regions of the Genome
Julie King,*
,1Ian P. Armstead,* S. Iain Donnison,* Luned A. Roberts,* John A. Harper,*
Kirsten Skøt,* Kieran Elborough
†and Ian P. King*
*Plant Genetics and Breeding Department, Institute of Grassland and Environmental Research, Aberystwyth, SY23 3EB, United Kingdom and†Vialactia Biosciences, Auckland 1031, New Zealand
Manuscript received May 4, 2007 Accepted for publication June 12, 2007
ABSTRACT
Publication of the rice genome sequence has allowed an in-depth analysis of genome organization in a model monocot plant species. This has provided a powerful tool for genome analysis in large-genome unsequenced agriculturally important monocot species such as wheat, barley, rye, Lolium, etc. Previous data have indicated that the majority of genes in large-genome monocots are located toward the ends of chromosomes in gene-rich regions that undergo high frequencies of recombination. Here we demonstrate that a substantial component of the coding sequences in monocots is localized proximally in regions of very low and even negligible recombination frequencies. The implications of our findings are that during domestication of monocot plant species selection has concentrated on genes located in the terminal regions of chromosomes within areas of high recombination frequency. Thus a large proportion of the genetic variation available for selection of superior plant genotypes has not been exploited. In addition our findings raise the possibility of the evolutionary development of large supergene complexes that confer a selective advantage to the individual.
T
HE rice genome, which has been physically mapped, sequenced, and annotated, can be used to predict gene content and order among monocots. Thus rice provides a powerful tool for genomic research and map-based cloning of target genes in large-genome crop species (the increased genome size of these species results from the presence of large amounts of additional repetitive DNA). Comparative analysis between the rice genome and other monocot plant species has demon-strated that gene order in different monocot species has, to a significant degree, been maintained during evolution (Bennetzenand Freeling1993; KellerandFeuillet 2000). However, there are many examples
where the microsyntenic relationship between rice and other monocot species breaks down as a result of gene duplications, deletions, translocations, and inversions (Bennetzenand Ramakrishna2002; Songet al. 2002;
Sorrells et al. 2003; La Rota and Sorrells 2004;
Miftahudinet al. 2005).
Irrespective of the,100% syntenic relationship be-tween the monocots, the rice genome provides a very powerful tool for predicting the gene content and order
in species with large and hence difficult to sequence genomes, such as grass (e.g., Lolium and Festuca spe-cies), wheat, barley, and oats, at the macrosyntenic level. Previous comparative mapping analyses in large mono-cot genomes have been undertaken via genetic mapping or bin mapping of orthologous markers since full-genome sequencing of these species is not presently viable. Both methods have been used successfully (VanDeynzeet al.
1995, 1998; Sorrellset al. 2003; Penget al. 2004; Qiet al.
2004). The major limitations with genetic mapping are: (1) it is difficult and time consuming to map large num-bers (thousands) of orthologous markers in sufficiently large mapping populations to enable high-resolution comparative analyses; (2) genetic mapping gives no in-dication of the physical distances between genes, which is of key importance for positional cloning; and (3) the requirement for polymorphism limits or prevents the mapping of some markers. Bin mapping allows the rela-tively fast mapping of large numbers of markers as has been demonstrated in wheat (Lazoet al. 2004; Qiet al.
2004). This system relies on large chromosomal dele-tions that divide the chromosomes into physically demar-cated intervals or bins into which markers can be placed. A limitation of wheat bin mapping is the low resolution of the system;i.e., the number of bins into which each chromosome is divided is small;e.g., chromosome 3A is 1Corresponding author: Institute of Grassland and Environmental
Re-search, Plas Gogerddan, Aberystwyth, Ceredigion, SY23 3EB, United Kingdom. E-mail: [email protected]
composed of only six bins (Munkvoldet al. 2004). In
addition, multiple chromosomal deletions frequently complicate deletion-bin mapping (Qiet al. 2003).
The data obtained from genetic mapping and de-letion-bin mapping have indicated that large numbers of coding sequences in the monocots studied are lo-cated in gene-rich regions that undergo high fre-quencies of recombination. In wheat, for example, the deletion-bin mapping of 16,000 expressed sequence tag loci (ESTs) found that of 23 bins with higher gene densities, all but 1 were located in the distal 40% of the chromosome arm (Qiet al. 2004). Relatively few genes
are thought to be located in proximal recombination-poor regions of the chromosomes (e.g., Eraymanet al.
2004; Qiet al. 2004).
The Lolium/Festuca introgression system provides an alternative method of comparative mapping, similar to wheat deletion mapping but with potentially far greater resolution (Kinget al. 2002a,b). The Lolium/
Festuca introgression system is based on a series of seven monosomic substitution lines. In each of these seven lines one of the chromosomes ofLolium perenne(2n ¼ 2x¼14; DNA content¼2034 Mbp; Bennettand Smith
1976) has been replaced by its homeologous equivalent fromFestuca pratensis (2n ¼ 2x ¼14; DNA content ¼ 2181 Mbp; Bennett et al. 1982). The F. pratensis
chromosome is then broken into different-sized seg-ments in a BC2mapping population through recombi-nation with the homeologousL. perennechromosome. The ability to distinguish the chromosomes of Lolium and Festuca using genomicin situhybridization (GISH), coupled with the high frequency of recombination be-tween the chromosomes of Lolium and Festuca (King
et al. 1998, 1999), enables the identification and char-acterization of individuals that carry different-size Festuca chromosome segments. For example, an introgression map of L. perenne/F. pratensischromosome 3, homeo-logous to rice chromosome 1, has been generated. The introgression map is composed of 16 individuals, each of which carry different-size Festuca chromosome segments. Alignment of overlapping Festuca chromo-some segments effectively dividesL. perenne/F. pratensis
chromosome 3 up into 18 physically demarcated bins. Screening the individuals that make up the introgres-sion map of Lolium/Festuca chromosome 3 for the presence or the absence of Festuca polymorphisms al-lows genetic markers,e.g., restriction fragment length polymorphisms (RFLPs), amplified fragment length poly-morphisms (AFLPs), simple sequence repeats (SSRs), and single-nucleotide polymorphisms (SNPs), to be as-signed to one of the 18 introgression bins (King et al.
2002a,b).
A critical factor, in addition to comparative analysis, for map-based cloning and also for the development of efficient plant breeding strategies is knowledge of how recombination frequency and distribution relate to gene distribution throughout the genome. For
exam-ple, the development of new plant varieties depends on the ability to assemble specific allelic combinations of genes that give rise to superior genotypes. This process requires the hybridization of specific parental material carrying target alleles. Recombination during meiosis leads, via reassortment, to the generation of individuals carrying the different combinations of alleles upon which the breeder can make selections. The ability to assemble specific allelic combinations is, however, com-pletely dependent on the frequency and distribution of recombination. For example, it is relatively easy to select for specific allelic combinations and select against linked deleterious alleles located in regions of the genome that show high frequencies of recombination. In contrast, it is extremely difficult, if not impossible, to select for specific allelic combinations and to break linkages with deleterious alleles present in regions of the genome that show little or no recombination. Similarly a sufficiently high frequency of recombination is required for the isolation of genes via map-based cloning strategies such as chromosome landing; i.e., genes located in an area of high recombination will be relatively easy to isolate while genes located in regions of the genome with low recombination will be difficult if not impossible to isolate.
Here we describe the exploitation of the published rice genome sequence to bin map sequences from func-tionally annotated gene models on approximately every 5th to 10th BAC/PAC clone from rice chromosome 1 to the Lolium/Festuca chromosome 3 introgression map to (1) further elucidate the syntenic relationship be-tween rice and the large-genome monocots, (2) deter-mine the physical location of rice chromosome 1 genes in large-genome monocots, and (3) determine the re-lationship between gene distribution and recombina-tion in large-genome crop species.
MATERIALS AND METHODS
Plant material: A 14-chromosome L. perenne/F. pratensis monosomic substitution plant (13 Lolium chromosomes and a single group 3 Festuca chromosome; Kinget al. 2002a,b) was
isolated from the progeny of a cross between a triploid Lolium/Lolium/Festuca hybrid (male parent) and diploid L. perenne, c.v. Liprio (female parent) (Kinget al. 1998). The
monosomic substitution plant was backcrossed as the male parent to the same diploidL. perennegenotype (female parent) to produce a BC2mapping population (Kinget al. 2002a,b).
The BC2 population was genetically mapped using AFLPs (Kinget al. 2002a). Sixteen BC2plants carrying a recombinant
chromosome were analyzed using GISH. The Festuca seg-ments in these 16 genotypes were measured and used to produce an introgression map of Festuca chromosome 3 in which the chromosome was physically divided into 18 bins (Kinget al. 2002b).
DNA extraction, PCR, and clean up: Genomic DNA was extracted using an AutoGen 740 (AutoGen, Holliston, MA).
manufacturer’s buffer systems (Roche, Lewes, UK) in ABI9700 thermocyclers (Applied Biosystems, Warrington, UK). Ther-mal cycling was performed beginning with 5 min at 96°; followed by 10 cycles of 1 min at 95°, 1 min at 60°(with the temperature reduced by 0.5°per cycle), 3 min at 72°; followed by 30 cycles of 1 min at 95°, 1 min at 55°, and 3 min at 72°; and a final extension step of 7 min at 72°. For a small number of primers the initial annealing temperature was 55°, dropping to 50°over the course of the first 10 cycles.
DNA was cleaned either directly from the PCR amplification using the QIAquick PCR Purification Kit (QIAGEN, Crawley, UK) or from an agarose gel using the QIAquick Gel Extraction Kit (QIAGEN).
Development and introgression mapping of SNPs:Strategy:
1. Develop primers, on the basis of conserved orthologous sequence alignments, from approximately every 5th to 10th BAC clone from rice linkage group 1.
2. Identify primers that generate SNPs between Lolium and Festuca group 3 chromosomes.
3. Assign each of the SNP markers located on Lolium/Festuca linkage group 3 to one of the 18 bins making up the in-trogression map of this chromosome.
Primer design:Primers were developed from sequence from approximately every 5th to 10th BAC/PAC clone from rice linkage group 1 on the basis of the following three strategies:
1. Sequence from a putative gene on a selected rice BAC/PAC clone was put through a blastn search against other mono-cot ESTs and cDNAs in the public domain. Primers were designed from conserved regions of sequence in two dif-ferent exons from the rice gene on either side of an intron. 2. Sequence from a putative gene on a selected rice BAC/PAC clone was put through a blastn search against other mono-cot ESTs and cDNAs in the public domain. Primers were designed from conserved regions of sequence from within one exon of the rice gene.
3. Access to a GeneThresher database (Gillet al. 2006) in
which 25,000 sequences have already been aligned to the rice genome allowed the selection of a sequence from a putative gene on a BAC/PAC clone of interest and primers were then designed from within that sequence. ½Gene Thresher sequences used had all previously been aligned to a BAC/PAC clone on rice linkage group 1. As an ad-ditional check all sequences used were searched against the rice database using the The Institute for Genomic Research (TIGR) blastn function for coding sequences (CDSs).
Rice genome sequence was obtained from The Institute for Genomic Research (http://www.tigr.org/tdb/e2k1/osa1/ pseudomolecules/info.shtml).
Blastn searches against all monocot ESTs and cDNAs were carried out via Plant GDB blastn search (http://www.plantgdb. org/PlantGDB-cgi/blast/PlantGDBblast).
Alignment of the GeneThresher database with the rice ge-nome sequence was carried out through GRAMENE (http:// www.gramene.org/Oryza_sativa/).
SNP discovery (detection of polymorphism between Lolium and Festuca group 3 chromosomes):All primers were initially tested by the PCR amplification of genomic DNA from the plants involved in the production of the chromosome 3 monosomic substitution½F. pratensis,L. perenne(diploid), andL. perenne(tetraploid)(Kinget al. 1998), theL. perenne/L. perenne/
F. pratensistriploid hybrid, and the group 3 substitution line itself with the amplification products run on a 1% agarose gel.
Primers that produced no amplification products in F. pratensis or F. pratensis amplification products that did not appear in either the triploid hybrid or chromosome 3 sub-stitution when run on the agarose gel were discarded.
Primers producing a single amplification product in each of the five genotypes listed above and that showed no differences in running speed on agarose gels were re-PCRed and the products cleaned and sequenced.
Primers producing more than one band when run on the agarose gel had the correct size band (estimated from the rice sequence) cut from the gel. The DNA was then cleaned and sequenced.
Sequencing was carried out on an ABI 3100 (Applied Biosystems). The sequences obtained for the five genotypes were aligned using Genedoc (http://www.psc.edu/biomed/ genedoc). The aligned sequences were then checked for the presence of single-nucleotide polymorphisms between the parentalF. pratensisgenotype and the twoL. perennegenotypes. The presence of SNP markers located in the Lolium and Festuca group 3 chromosomes was confirmed by their pres-ence in the sequpres-ences of the triploid hybrid and group 3 substitution.
Introgression mapping of group 3 SNP markers: Having established the presence of a SNP between F. pratensis and L. perennegroup 3 chromosomes the primers were then used to amplify genomic DNA of the 16 genotypes composing the Festuca introgression map. Screening for the presence or the absence of theF. pratensisandL. perennebases in each of the 16 genotypes carrying different-sized and overlapping Festuca chromosome segments allowed each SNP, derived from rice linkage group 1 BAC/PAC clones, to be assigned to a bin on the Festuca introgression map. The sequence data from F. pratensiswas blastn searched back against the rice genome to confirm that the products amplified in the Lolium and Festuca genotypes were orthologous to the original sequence obtained from rice.
In addition to the above procedure a modified procedure was applied for some primers designed across introns. These primers occasionally produced amplification products in the five genotypes½F. pratensis,L. perenne(diploid and tetraploid), L. perenne/L. perenne/F. pratensistriploid hybrid, and the group 3 substitutionthat showed differences in running speed on agarose gels. DNA containing a heteroduplex of F. pratensis and L. perenneDNA, i.e., the triploid hybrid and the substi-tution line, showed retardation in the running speed com-pared to DNA from only one species. The lag in running speed was presumably due to imperfectly paired DNA, i.e., the presence of loops, etc., within the heteroduplex. The retar-dation was also observed when heteroduplex DNA was am-plified in one or more of the 16 genotypes composing the Lolium/Festuca introgression map. It was therefore possible to physically locate the polymorphism (and hence the rice BAC/PAC clone on which it was located) to its correct bin on the Lolium/Festuca map. The amplifiedF. pratensisproduct was sequenced and the sequences blastn searched back against the rice genome to confirm amplification of the correct product.
RESULTS
Primer design: Three strategies, as outlined in
materials and methods, were followed for primer
de-sign and hence SNP discovery. Ninety-one percent of primers designed within two exons on either side of an intron produced an amplification product in both Festuca and Lolium. Of these, 37% were successful in physically
mapping a BAC/PAC clone; i.e., the amplification
sequence data of sufficient quality (without cloning) for reliable SNP discovery. Ninety-six percent of primers designed entirely within an exon produced amplifica-tion products in Festuca and Lolium and of these 40% were successful in physically mapping a BAC/PAC clone. While sequence data generated from the ampli-fication products of these primers were much clearer and more reliable, the sequences in general showed much lower levels of polymorphism between Festuca and Lolium. Ninety-five percent of the primers de-signed using the GeneThresher database produced am-plification products in Festuca and Lolium, 30% of which were successful in the physical mapping of a BAC/PAC clone. This final strategy, however, was em-ployed only on a very small number of BAC/PAC clones and these numbers do not therefore provide an accu-rate estimate of the success of this third staccu-rategy.
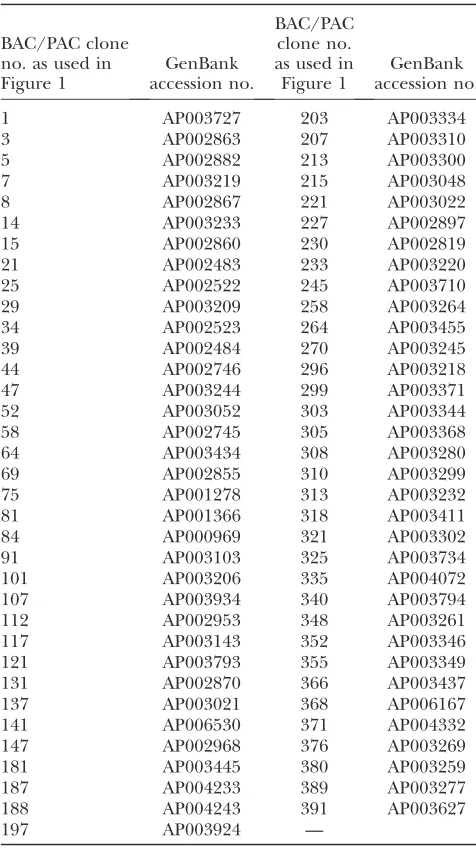
Syntenic relationship between rice and the grasses: We bin mapped sequences from 69 BAC/PAC clones from rice chromosome 1 onto the Lolium/Festuca chro-mosome 3 introgression map, 67 of which were mapped using primers designed from sequence within function-ally annotated gene models and 2 within putative
transposon sequence (Figure 1). The BAC/PAC clones on rice linkage group 1 were numbered 1–393 accord-ing to the minimum tilaccord-ing path from The Institute of Genomic Research as of September 2006. This number-ing is used for Figure 1. The GenBank accession number for each BAC/PAC clone used is given in Table 1. An extended version of Table 1 is available in supplemental material at http://www.genetics.org/supplemental/. This table gives full primer details along with the locus iden-tifier of the functionally annotated gene model used.
The data obtained allowed us to infer the distribution of rice linkage group 1 on Lolium/Festuca chromo-some 3 and the syntenic relationship between rice and Lolium/Festuca at the macro level. The linear order of BAC/PAC clones was virtually the same in Lolium/ Festuca as in rice (Figure 1). We observed only two dis-ruptions to macrocolinearity between the two species. BAC/PAC clones 1, 3, and 5 map to the second bin on the arm that carries a nucleolar organizer region (NOR) (between physical distances of 82.4 and 86.6%) instead of, as expected, to the end bin (between physical dis-tances of 86.6 and 100%). BAC/PAC clone 6, however, was found to be physically located in the end bin,i.e.,
Figure 1.—Introgression map of
Lolium/Festuca chromosome 3. Physical and genetic distances are shown on the left. Horizontal black arrows indicate sites of recombination between Festuca and Lolium (alternating blue and yel-low colors are used only to aid discrim-ination between different recombinant lines carrying different-sized segments). The positions of the centromere (blue arrow) and the nucleolar organizer re-gion (NOR) (red arrows) are also shown on the left (Kinget al. 2002b). The NOR
between 86.6 and 100%. The second disruption in-volved BAC/PAC clones 299, 303, and 305 that mapped to the bin on the non-NOR arm between physical dis-tances of 19.7 and 28.9%. However, BAC/PAC clones 286 and 308 map in the neighboring bin between physical distances of 28.9 and 38.0% as expected. The first disruption to macrocolinearity of the rice BAC/ PAC clones was therefore the smaller of the two consist-ing of a maximum of 5 BAC/PAC clones, respectively. The second disruption has the potential to be somewhat larger, consisting of a maximum of 21 BAC/PAC clones.
However, introgression mapping of the rice BAC/PAC clones between 286 and 299 is required to assess the actual extent of this disruption to macrocolinearity.
The work described is not testing the microcolinearity between Lolium/Festuca and rice. Also, by the nature of the primer design we concentrated on generally con-served sequences. Therefore it was not possible to de-velop SNPs for grass and rice sequences that have diverged.
DISCUSSION
Recombination distribution and gene density: We have previously shown that recombination frequency varies along the length of Lolium/Festuca chromosome 3 (Kinget al. 2002b). Two major peaks in the frequency
of recombination are located at 12% of the distance along the chromosome from the telomere of the non-NOR arm and at 18% of the distance from the telomere of the NOR arm. In the non-NOR arm the distal 15.5% (which just covers the peak in recombination) contains 9% of the BAC/PAC clones from rice chromosome 1 (Figure 2). In the NOR arm the distal 20% (which again just covers the peak in recombination) also contains 9% of the BAC/PAC clones from rice chromosome 1. There-fore 82% of the BAC/PAC clones from rice chromo-some 1 are physically located in the remaining 64.5% of the chromosome, much of which has a very low level of recombination (Figure 2). (The peaks in recombina-tion frequency are actually fairly narrow with the most distal regions of both arms also having low recombina-tion frequencies.) The estimate above is therefore an overestimate of the number of BAC/PAC clones within the regions of high recombination frequency. If the BAC/PAC clones in the end bin of the NOR arm and the end two bins of the non-NOR arm (Figure 2) are also considered as low recombination areas, then 90% of the BAC/PAC clones from rice linkage group 1 are located within regions of low recombination frequencies (which equates to 85% of the physical distance on Lolium/ Festuca chromosome 3).
The distribution of BAC/PAC clones (together with the functionally annotated gene models on each clone as listed by The Institute of Genome Research) from rice allows an estimate of the distribution of gene density from rice linkage group 1 to be plotted on Lolium/ Festuca chromosome 3 (Figure 2). The terminal 15.5% of the non-NOR arm (which includes the peak in re-combination frequency for that arm) contains 12.6% of the functionally annotated gene models (calculated by counting all the loci minus transposons, retrotranspo-sons, and hypothetical proteins, listed by The Institute of Genome Research for the BAC/PAC clones bin mapped within the terminal 15.5% of the non-NOR arm) found in rice linkage group 1 while the terminal 20% of the NOR arm (which again includes the peak in frequency of recombination for that arm) contains
TABLE 1
Introgression-mapped rice linkage group 1 BAC/PAC clones
BAC/PAC clone no. as used in Figure 1
GenBank accession no.
BAC/PAC clone no. as used in Figure 1
GenBank accession no.
1 AP003727 203 AP003334
3 AP002863 207 AP003310
5 AP002882 213 AP003300
7 AP003219 215 AP003048
8 AP002867 221 AP003022
14 AP003233 227 AP002897
15 AP002860 230 AP002819
21 AP002483 233 AP003220
25 AP002522 245 AP003710
29 AP003209 258 AP003264
34 AP002523 264 AP003455
39 AP002484 270 AP003245
44 AP002746 296 AP003218
47 AP003244 299 AP003371
52 AP003052 303 AP003344
58 AP002745 305 AP003368
64 AP003434 308 AP003280
69 AP002855 310 AP003299
75 AP001278 313 AP003232
81 AP001366 318 AP003411
84 AP000969 321 AP003302
91 AP003103 325 AP003734
101 AP003206 335 AP004072
107 AP003934 340 AP003794
112 AP002953 348 AP003261
117 AP003143 352 AP003346
121 AP003793 355 AP003349
131 AP002870 366 AP003437
137 AP003021 368 AP006167
141 AP006530 371 AP004332
147 AP002968 376 AP003269
181 AP003445 380 AP003259
187 AP004233 389 AP003277
188 AP004243 391 AP003627
197 AP003924 —
11.8% of the genes. The remaining 64.5% of the chro-mosome therefore contains 75.6% of the functionally annotated gene models from rice linkage group 1. Thus, there is a fairly even distribution of genes across the physical distance of the chromosome with the greatest proportion of genes on rice linkage group 1 located in regions of low or very low recombination. (The number rises to 81.4% if the distal regions of the chromosome arms are also included as regions of low recombination frequency.) In rice, the density of ex-pressed genes is greater on the distal portions of the chromosome arms compared with the regions around the centromeres (International Rice Genome S e-quencingProject2005). Therefore, the areas of low
recombination do contain, as expected, a higher pro-portion of transposons, retrotransposons, and hypothet-ical proteins compared to those regions of higher recombination frequency; i.e., 6% of the transposons, retrotransposons, and hyopothetical proteins are lo-cated in the distal 15.5% of the non-NOR arm and 7% are located in the distal 20% of the NOR arm with 86% located in the remaining 64.5% of the chromosome.
We undertook a specific examination of the classes of genes (functionally annotated gene models as compared to transposons, retrotransposons, and hypothetical pro-teins) in the regions of the chromosome exhibiting very low frequencies of recombination,i.e., from 38 to 73% of the distance along the chromosome (Figure 1). This region covers 35% of the physical distance of Lolium/ Festuca chromosome 3 and contains both the
centro-mere and the NOR. Recombination in this region of the chromosome is extremely low throughout, almost touching zero in places (Kinget al. 2002b). Despite this
low frequency of recombination, 50% of BAC/PAC clones from rice group 1 containing 36% of the func-tionally annotated gene models are physically located within this 35% region of Lolium/Festuca chromosome 3 (Figure 2).
Recombination and gene distribution in other monocots: Localization of chiasma to the distal ends of the chromosomes is not specific to Lolium and Festuca. For example, Snapeet al. (1985) demonstrated
little or no crossing over between the centromere and the NOR in chromosome 1B of wheat. More recently wheat deletion mapping has demonstrated chiasma localization; i.e., it has been shown that there is a gradient in recombination increasing from the centro-mere to the telocentro-mere (Lukaszewskiand Curtis1993;
Akhunovet al. 2003a). Erayman et al. (2004) showed
that one-fourth of the wheat genome present around
the centromere accounted for ,1% of the total
re-combination. Chiasma localization has also been dem-onstrated in sorghum (Kleinet al. 2003; Kimet al. 2005)
and barley (Ku¨ nzel et al. 2000). The average rate of
recombination across the heterochromatic portion (con-centrated in proximal regions) of sorghum was34-fold lower than that of recombination in euchromatic re-gions (concentrated in more distal rere-gions of the chro-mosomes). In barley chromosome 3H, a region spanning the centromere and covering45% of the total physical
Figure 2.—Introgression map of
length of the chromosome was reported to show no recombination (Ku¨ nzelet al. 2000).
The gene loci distribution we describe differs from the general conclusions drawn in wheat over the last decade, where the large majority of genes have been described as being located toward the distal regions of the chromosome arms (leaving the pericentromeric/ proximal regions of the chromosome largely gene poor). Eraymanet al. (2004) located 94% of the genes in wheat
to 48 gene-rich regions (29% of the wheat genome). No gene-rich regions were located in the centromeric regions of any of the wheat chromosomes and only one small gene-rich region containing 4% of the arm’s genes was observed in the proximal 20% of any chro-mosome. A very similar pattern of gene distribution has been described for sorghum where higher gene densi-ties were reported for the distal regions of chromosome 3 compared to the pericentromeric region (Kleinet al.
2003; Kimet al. 2005). Likewise in barley, recombination
hotspots making up 4.9% of the total barley genome were found to contain 47.3% of the 429 markers (most thought to represent genes) mapped to the physical map (Ku¨ nzelet al. 2000). These regions of high
recom-bination were located mainly in the distal regions of the chromosomes but also in some interstitial positions specific to each of the individual chromosome arms.
Although much of the published work has indicated the presence of distally located gene-rich regions, it has recently been speculated that there is actually a more even distribution of genes in the wheat genome (Devos
et al. 2005) in agreement with results from the early stages of cereal comparative mapping. From this early work it was apparent that the gene content of whole rice chromosomes (particularly rice linkage groups 8, 10, 11, and 12) might map into pericentromeric/proximal
regions in wheat and barley (Moore 1995; Moore
et al. 1995; Van Deynzeet al. 1995). As a rice
chromo-some is likely to contain thousands of genes, the prox-imal regions are also likely therefore to contain a similar number of genes. Studies exploiting barley deletions also inferred this physically (Korzunand Ku¨ nzel1996)
by showing that RFLPs localized on the linkage maps of rice chromosomes 5 and 10 were allocated to cytolog-ically defined regions of barley chromosome 5 (1H). The rice map of linkage group 5 was divided into two parts relating to the distal portions of both the short and the long arms of the barley chromosome. The map of rice chromosome 10, however, was related to an inter-stitial segment on the long arm of barley chromosome 5 (1H), a region highly suppressed in recombination activity. This distribution of genes is also substantiated by the National Science Foundation project in bin mapping wheat unigenes. First, for example, the con-sensus chromosome for wheat group 3 shows the most proximal bin in the long arm to have a higher number of mapped ESTs than some bins in more distal positions. In addition, in both long and short arms a central bin
had very high numbers of mapped ESTs (Munkvold
et al. 2004). Second, synteny between rice chromosome 1 and the wheat group 3 consensus chromosome would suggest that a large number of the BAC/PAC clones from rice linkage group 1 are actually located in the proximal regions on wheat group 3. Approximately BAC/PAC clone 90 (AP000815) to BAC/PAC clone 253 (AP003760) were located in the bins immediately sur-rounding the centromere; i.e.,163 BAC/PAC clones (42% of the total from rice linkage group 1) are located in these proximal regions (Munkvoldet al. 2004). If the
most proximal half of each chromosome arm is looked at then250 BAC/PAC clones (64% of the total) from rice linkage group 1 are located within this region. It is possible that microsynteny may be greatly disrupted within these proximal regions but this would be in con-tradiction to the general evolutionary trends previously described (Akhunovet al. 2003b). These studies showed
that new loci, as well as fixed deletions, are more fre-quent in high-recombination regions at the distal ends of the wheat chromosomes. As a result of these trends the distal regions of wheat chromosome arms have been evolving faster than the proximal regions, resulting in more frequent exceptions to the colinearity and micro-colinearity between rice and wheat at the distal chro-mosome regions.
Likewise, alignment of the sorghum 3 physical map to rice chromosome 1 shows the location of 157 BAC/PAC clones from rice chromosome 1 occurring within the region from 62.0 to 105.2 cM (43.2 cM) that spans the sorghum centromere.
The results from the Lolium/Festuca introgression mapping strongly support these latter findings, i.e., large numbers of BAC/PAC clones and hence gene loci (albeit with a relatively high ratio of transposons, retro-transposons, and hypothetical proteins) mapping to regions of the chromosomes showing very low frequen-cies of recombination.
The more recent work described above suggests that physical mapping of ESTs in both wheat and sorghum may not be detecting proximally located genes that are orthologous to sequences in rice. Both the deletion maps of wheat and thein situhybridization maps of sorghum are built on the mapping of wheat and sorghum ESTs fol-lowed by comparisons to rice made via their homology to rice genes. In contrast, in the introgression mapping work described here, orthologous grass markers have been developed directly from rice coding sequences. It is these orthologous markers that have then been bin mapped in Lolium/Festuca. The reasons for the absence of genes in the proximal regions of wheat and sorghum could there-fore possibly result from (1) only partially representative EST libraries or (2) an inability to detect ESTs as a result of low sequence polymorphism (Sorrellset al. 2003 and
Randhawaet al. 2004 reported between 24 and 45% of
Synteny: Macrocolinearity between Lolium/Festuca chromosome 3 and rice chromosome 1 appears to be largely intact with only the two disruptions, neither of which is as extensive as the segmental inversion in the short arm of chromosome 3 of sorghum compared to rice as reported by Kleinet al. (2003), which involved
63 of the rice linkage group 1 BAC/PAC clones. Microcolinearity is probably less intact although to answer this properly would require the introgression mapping of several sequences from functionally anno-tated gene models from the same BAC/PAC clone. Disruption to microcolinearity would be consistent with work in wheat where some bins on the deletion maps have been shown to have a greater synteny to rice com-pared to others. However, even in the conserved bins, an average of 35% of the putative single-copy genes still mapped to different and syntenically unexpected rice linkage groups (Sorrells et al. 2003; La Rota and
Sorrells 2004). Similar disruption to synteny at the
individual gene level has also been described in other cereals such as maize (Bennetzen and Ramakrishna
2002).
Physical alignment of Lolium/Festuca chromosome 3 and wheat homeologous group 3 chromosomes:It is possible to make initial comparisons between Lolium/
Festuca and other monocot species through rice. Figure 3 shows the BAC/PAC clones from rice linkage group 1 that have been physically mapped on Lolium/Festuca chromosome 3 compared to their physical locations in wheat. To avoid possible complications with micro-synteny only those BAC/PAC clones that have been mapped in both Lolium/Festuca and wheat using the same functionally annotated gene model in rice are shown. For example, BAC/PAC clone 371 (AP004332) has been physically mapped in both Lolium/Festuca and wheat, using sequence from Locus_OS01g70170 (transaldolase 2, putative, expressed).
Many of the 21 gene loci used to compare the Lolium/ Festuca chromosome 3 introgression map with the wheat group 3 consensus map can presently be mapped to a more specific bin in Lolium/Festuca. Despite the complicated overall picture there does appear to be a fairly good level of synteny between Lolium/Festuca 3 and wheat consensus group 3. This does not extend to all loci, however, and with only 21 putative gene loci mapped in common a great deal of care must be taken in making generalizations. Figure 3 does show the very clear benefits that accrue from pooling work from different species. For example, where loci have been mapped to a narrower region in one species, the physical
Figure 3.—Alignment of Lolium/
map may be used to increase the resolution of the physical map in the other species.
The consequences of low recombination on allelic reassortment:Our research strongly suggests that mod-ern and past breeding strategies may have only skimmed the surface of the genetic variation available for the development of improved varieties;i.e., the majority of selections for new and novel allelic combinations have, by default, been centered on relatively few genes lo-cated in regions of high recombination near the ends of the chromosomes. Linked genes in areas of very low recombination will assort only very rarely, if at all. In addition, the probability of detecting a rare re-combinant event in a region of low recombination frequency in breeding programs without prior knowl-edge and the use of markers flanking these target regions of the genome is very small. From these data we predict that, in grasses, for example, 47% of the sequences that are orthologous to rice linkage group 1 coding sequence will remain linked and thus will be resistant to selection in breeding programs and iso-lation via map-based cloning. The Lolium/Festuca in-trogression system will provide a means of exploiting these low recombination regions. Lolium/Festuca group 3 monosomic substitution is fully fertile and therefore
it is possible to generate many thousands of BC2
plants. These plants can then be screened for flanking markers either side of a region of interest to break the region into much smaller physical bins. With the rice BAC/PAC clones physically mapped it will then be possible to say within fairly narrow limits which re-gion(s) of the rice genome is syntenic to this targeted region of Lolium/Festuca. This procedure has presently been exploited in grass and led to the isolation of a gene that confers delayed senescence and that underlies Mendel’sIlocus that controls color in pea (Armstead
et al. 2006, 2007).
In addition, the presence of large numbers of coding sequences located in regions of the genomes of grass, wheat, and sorghum, etc., that undergo very low levels of recombination also has a significant evolutionary sig-nificance;i.e., specific allelic combinations will remain linked over many generations;e.g., it has been specu-lated that such regions of the genome may carry co-adapted gene complexes, supergenes, or homozygous housekeeping genes.
The work we have described is enabling the transfer of information between rice and the large-genome mono-cot crop species and is being used to inform breeding and basic research programs. A genomewide high-resolution comparison of gene order and distribution in rice, Lolium, wheat, barley, etc., is presently being undertaken.
We thank Mark Sorrells for critical reading of the manuscript. This work was supported by the Biotechnology and Biological Sciences Research Council and in addition J. K. was supported by a European Molecular Biology Organization Restart Fellowship.
LITERATURE CITED
Akhunov, E. D., A. W. Goodyear, S. Geng, L-L. Qi, B. Echalier
et al., 2003a The organisation and rate of evolution of the wheat genomes are correlated with recombination rates along chromo-some arms. Genome Res.13:753–763.
Akhunov, E. D., A. R. Akhunova, A. M. Linkiewicz, J. Dubcovsky,
D. Hummelet al., 2003b Synteny perturbations between wheat
homoeologous chromosomes caused by locus duplications and deletions correlate with recombination rates. Proc. Natl. Acad. Sci. USA100:10836–10841.
Armstead, I., I. Donnison, S. Aubry, J. Harper, S. Ho¨ rtensteiner
et al., 2006 From crop to model to crop: identifying the genetic basis of the stay-green mutation in theLolium/Festucaforage and amenity grasses. New Phytol.172:592–597.
Armstead, I., I. Donnison, S. Aubry, J. Harper, S. Ho¨ rtensteiner
et al., 2007 Cross-species identification of Mendel’sIlocus. Sci-ence315:73.
Bennett, M., and J. B. Smith, 1976 Nuclear DNA amounts in
angio-sperms. Philos. Trans. R. Soc. Lond. Ser. B Biol. Sci.274:227–274. Bennett, M. D., J. B. Smithand J. C. Heslop-Harrison, 1982
Nu-clear DNA amounts in angiosperms. Proc. R. Soc. Lond. Ser. B
216:179–199.
Bennetzen, J. L., and M. Freeling, 1993 Grasses as a single genetic
system: genome composition, colinearity and compatibility. Trends Genet.9:259–261.
Bennetzen, J. L., and W. Ramakrishna, 2002 Numerous small
re-arrangements of gene content, order and orientation differenti-ate grass genomes. Plant Mol. Biol.48:821–827.
Devos, K. M., J. Ma, A. C. Pontaroli, L. H. Prattand J. L. Bennetzen,
2005 Analysis and mapping of randomly chosen bacterial arti-ficial chromosome clones from hexaploid bread wheat. Proc. Natl. Acad. Sci. USA102:19243–19248.
Erayman, M., D. Sandhu, D. Sidhu, M. Dilbirligi, P. S. Baenziger
et al., 2004 Demarcating the gene-rich regions of the wheat ge-nome. Nucleic Acids Res.32:3546–3565.
Gill, G. P., P. L. Wilcox, D. J. Whittaker, R. A. Winz, P. Bickerstaff
et al., 2006 A framework linkage map of perennial ryegrass based on SSR markers. Genome49:354–364.
InternationalRiceGenomeSequencingProject, 2005 The
map-based sequence of the rice genome. Nature436:793–800. Keller, B., and C. Feuillet, 2000 Colinearity and gene density in
grass genomes. Trends Plant Sci.5:246–251.
Kim, J.-S., M. N. Islam-Faridi, P. E. Klein, D. M. Stelly, H. J. Price
et al., 2005 Comprehensive molecular cytogenetic analysis of sorghum genome architecture: distribution of euchromatin, het-erochromatin, genes and recombination in comparison to rice. Genetics171:1963–1976.
King, I. P., W. G. Morgan, I. P. Armstead, J. A. Harper, M. D. Hayward
et al., 1998 Introgression mapping in the grasses. I. Introgression ofFestuca pratensischromosomes and chromosome segments into Lolium perenne. Heredity81:462–467.
King, I. P., W. G. Morgan, J. A. Harper and H. M. Thomas,
1999 Introgression mapping in the grasses. II. Meiotic analysis of theLolium perenne/Festuca pratensistriploid hybrid. Heredity
82:107–112.
King, J., L. A. Roberts, M. J. Kearsey, H. M. Thomas, R. N. Jones
et al., 2002a A demonstration of a 1:1 correspondence between chiasma frequency and recombination using aLolium perenne/ Festuca pratensissubstitution. Genetics161:307–314.
King, J., I. P. Armstead, I. S. Donnison, H. M. Thomas, R. N. Jones
et al., 2002b Physical and genetic mapping in the grassesLolium perenneandFestuca pratensis. Genetics161:315–324.
Klein, P. E., R. R. Klein, J. Vrebalovand J. E. Mullet, 2003
Sequence-based alignment of sorghum chromosome 3 and rice chromosome 1 reveals extensive conservation of gene order and one major chro-mosomal rearrangement. Plant J.34:605–621.
Korzun, L., and G. Ku¨ nzel, 1996 The physical relationship of
bar-ley chromosome 5 (1H) to the linkage groups of rice chromo-somes 5 and 10. Mol. Gen. Genet.252:225–231.
Ku¨ nzel, G., L. Korzunand A. Meister, 2000 Cytologically
inte-grated physical restriction length polymorphism maps of the bar-ley genome based on translocation breakpoints. Genetics154:
397–412.
LaRota, M., and M. E. Sorrells, 2004 Comparative DNA sequence
relationships between rice and wheat. Funct. Integr. Genomics4:
34–46.
Lazo, G. R., S. Chao, D. D. Hummel, H. Edwards, C. C. Crossman
et al., 2004 Development of an expressed sequence tag (EST) resource for wheat (Triticum aestivumL.): EST generation, unigene analysis, probe selection and bioinformatics for a 16,000-locus bin-delineated map. Genetics168:585–593.
Lukaszewski, A. J., and C. A. Curtis, 1993 Physical distribution of
recombination in B-genome chromosomes of tetraploid wheat. Theor. Appl. Genet.84:121–127.
Miftahudin, T. Chikmawati, K. Ross, G. J. Scoles and J. P.
Gustafson, 2005 Targeting the aluminium tolerance geneALT3
region in rye, using rice/rye micro-colinearity. Theor. Appl. Ge-net. 110: 906–913.
Moore, G., 1995 Cereal genome evolution: pastoral pursuits with
‘lego’ genomes. Curr. Opin. Genet. Dev.5:717–724.
Moore, G., K. M. Devos, Z. Wangand M. D. Gale, 1995 Grasses,
line up and form a circle. Curr. Biol.5:737–739.
Munkvold, J. D., R. A. Greene, C. E. Bermudez-Kandianis, C. M. La
Rota, H. Edwardset al., 2004 Group 3 chromosome bin maps
of wheat and their relationship to rice chromosome 1. Genetics
168:639–650.
Peng, J. H., H. Zadeh, G. R. Lazo, J. P. Gustafson, S. Chaoet al.,
2004 Chromosome bin map of expressed sequence tags in ho-meologous group 1 of hexaploid wheat and homeology with rice and Arabidopsis. Genetics168:609–623.
Qi, L. L., B. Echalier, B. Friebeand B. S. Gill, 2003 Molecular
characterization of a set of wheat deletion stocks for use in chro-mosome bin mapping of ESTs. Funct. Integr. Genomics3:39–55. Qi, L. L., B. Echalier, S. Chao, G. R. Lazo, G. E. Butler et al.,
2004 A chromosome bin map of 16,000 expressed sequence tag loci and distribution of genes among the three genomes of polyploidy wheat. Genetics168:701–712.
Randhawa, H. S., M. Dilbirligi, D. Sidhu, M. Erayman, D. Sandhu
et al., 2004 Deletion mapping of homeologous group 6-specific wheat expressed sequence tags. Genetics168:677–686. Snape, J. W., R. B. Flavell, M. O’Dell, W. G. Hughesand P. I. Payne,
1985 Intrachromosomal mapping of the nucleolar organiser region relative to three loci on chromosome 1B of wheat (Triti-cum aestivum). Theor. Appl. Genet.69:263–270.
Song, R., V. Llacaand J. Messing, 2002 Mosaic organization of
or-thologous sequences in grass genomes. Genome Res.12:1549– 1555.
Sorrells, M. E., M. LaRota, C. E. Bermudez-Kandianis, R. A. Greene,
R. Kantetyet al., 2003 Comparative DNA sequence analysis of
wheat and rice genomes. Genome Res.13:1818–1827.
VanDeynze, A. E., J. C. Nelson, E. S. Yglesias, S. E. Harrington,
D. P. Bragaet al., 1995 Comparative mapping in grasses. Wheat
relationships. Mol. Gen. Genet.248:744–754.
VanDeynze, A. E., M. E. Sorrells, W. D. Park, N. M. Ayres, H. Fu
et al., 1998 Anchor probes for comparative mapping of grass genera. Theor. Appl. Genet.97:356–369.