DOI: 10.1534/genetics.104.032979
Patterns of Sequence Divergence in 5
ⴕ
Intergenic Spacers and Linked
Coding Regions in 10 Species of Pathogenic Bacteria Reveal
Distinct Recombinational Histories
Austin L. Hughes
1and Robert Friedman
Department of Biological Sciences, University of South Carolina, Columbia, South Carolina 29205 Manuscript received June 29, 2004
Accepted for publication August 30, 2004
ABSTRACT
We compared the pattern of nucleotide difference in 8034 genes and in their 5⬘ intergenic spacers between conspecific pairs of genomes from 10 species of pathogenic bacteria. Certain genes or spacers showed much greater sequence divergence between the genotypes compared to others; such divergent regions plausibly originated by recombinational events by which a gene and/or spacers was donated from a divergent genome. Different patterns of divergence in genes and spacers identified different recombinational patterns. For example, inChlamydophila pneumoniae, there were examples of both unusually divergent spacers and unusually divergent genes, but there were no cases in which a gene and its spacer were both unusually divergent. This pattern suggests that, inC. pneumoniae, recombination events have broken up the linkage between genes and 5⬘spacers. By contrast, inStreptococcus agalactiae, there were a number of cases in which both spacer and gene were unusually divergent, indicating that a number of large-scale recombination events that included both genes and 5⬘spacers have occurred; there was evidence of at least two large-scale recombination events in the genomic region including the purgenes in S. agalactiae.
T
HE extent to which recombination occurs in free- tween genes and adjacent spacers may be an important living bacterial populations is an important factor factor in the evolution of intraspecific differences in in their population biology. In the case of pathogenic gene regulation.bacteria,Feilet al.(2000) argue that an understanding A number of recent reviews have focused on the need of the role of recombination is important for prophy- to understand the evolutionary dynamics of promoters laxis and treatment because recombination will have a and other genomic regions involved in the regulation major impact on the evolution of pathogenicity and the of gene expression (Rodriguez-Trelles et al. 2003; effectiveness of vaccines. Classical studies, using tech- Wray et al. 2003). Promoter sequences required for niques such as multilocus enzyme electrophoresis, as- gene expression are expected to be subject to purifying sessed recombination between protein-coding loci (Sel- selection (Kohnet al. 2004). Alternatively, there is
evi-ander et al. 1986). More recently, studies focused on dence that natural selection may favor differentiation
sequence data have tested for evidence of small-scale of promoter regions between populations within species intralocus recombinational events (McGrawet al. 1999). (Rockmanet al. 2003) or between closely related species However, little attention has been paid to the extent of (Kohnet al. 2004) when environmental differences fa-recombination between protein-coding loci and adja- vor changes in the pattern of gene expression. In bacte-cent intergenic (spacer) regions. ria, a number of studies have analyzed genome-wide Intergenic regions in prokaryotes are much shorter patterns of nucleotide substitution in protein-coding on average than those of eukaryotes, and consequently genes by comparing conspecific genomic sequences the density of regulatory elements per intergenic region
(Hugheset al. 2002;Jordanet al. 2002). This approach
is expected to be much higher in prokaryotes than in
has not been extended to intergenic spacers except in eukaryotes (Rogozinet al. 2002). Spacers between genes
a recent study by Fuglsang (2004) analyzing the 50 in a head-to-head orientation will include promoters for
nucleotides upstream of start codons and downstream both genes, while spacers between genes in a
head-of stop codons inEscherichia coliand two related species. to-tail orientation will include the promoter of one
Here we analyze patterns of nucleotide difference in gene. Consequently, the extent of recombination
be-5⬘ intergenic spacers and linked protein-coding genes by comparing conspecific genomic sequences from 10 species of pathogenic bacteria. This data set enables us
1Corresponding author:Department of Biological Sciences, University
to compare the pattern of sequence differentiation in
of South Carolina, Coker Life Sciences Bldg., 700 Sumter St.,
Colum-bia, SC 29208. E-mail: [email protected] intergenic regions with that in protein-coding genes. By
comparing the sequence divergence in protein-coding tween orthologous genes from pairs of closely related genomes, each nucleotide difference between the two genes with that in adjacent intergenic regions, we obtain
evidence regarding the extent to which these two types sequences must have arisen since their most recent com-mon ancestor. Thus, each comparison is phylogeneti-of sequence share recent evolutionary histories. This in
turn provides evidence regarding the relative preva- cally and statistically independent of each other com-parison (Felsenstein1985). In statistical analyses, we lence of recombination between genes and their
pro-moters in comparison to events in which the gene and assumed that each orthologous sequence pair evolves independently of other genes in the genome. However, promoter region are exchanged as a unit.
because we used the orthologous gene pair as the unit of statistical analysis, our analyses did not require the
METHODS
assumption that each nucleotide site evolves indepen-dently, a biologically unrealistic assumption that is rou-Comparisons were made of orthologous pairs of
genes and 5⬘ intergenic regions (spacers) between 10 tinely made in studies of molecular evolution.
Both coding and spacer regions were aligned using pairs of conspecific complete genomes: Chlamydophila
pneumoniaeCWL029 (NC_000922) and J138 (NC_002491); the program ClustalW 1.83 (Thompsonet al. 1994). In the case ofS. agalactiae, the BLASTZ program (Schwartz E. coli K12 (NC_000913) and O157:H7 (NC_002695);
Helicobacter pylori 26695 (NC_000915) and J99 (NC_ et al. 2003) was used to align the complete genomic sequences. For coding regions, gaps were not allowed 000921);Mycobacterium tuberculosisCDC1551 (NC_002755)
and H37Rv (NC_000962); and Neisseria meningitidis to occur within any codon, thus preserving the frame of translation. The proportions of synonymous differences Z2491 (NC_003116) and MC58 (NC_003112);
Staphylo-coccus aureusMu50 (NC_002758) and N315 (NC_002745); per synonymous site (pS) and of nonsynonymous
differ-ences per nonsynonymous site (pN) were estimated
be-Streptococcus agalactiae 2603V/R (NC_004116) and
NEM316 (NC_004368);Streptococcus pyogenesMGAS315 tween each pair of orthologous coding sequences by
theNeiandGojobori(1986) method. In spacers, the
(NC_004070) and SSI-1 (NC_004606); Streptococcus
pneumoniaeR6 (NC_003098) and TIGR4 (NC_003028); uncorrected proportion (p) of nucleotide differences was calculated. Thus, for both coding and noncoding and Yersinia pestis CO92 (NC_003143) and KIM (NC_
004088). regions no statistical correction for multiple hits was applied to the observed proportions of nucleotide dif-To identify orthologous pairs of sequences, we
ap-plied the BLASTCLUST program (Altschul et al. ference.
Uncorrected proportions were used for a number of 1997) to each pair of conspecific genomes to assemble
coding regions and spacers into gene families on the reasons. First, in most cases, the sequences compared were very similar; thus, correction made little if any basis of sequence homology. Homology search for genes
was done at the amino acid level, while that for spacers practical difference. Second, in the present study, we were interested in comparing relative proportions of was done at the nucleotide level. We used the following
parameters for the homology search and assembly of sequence difference in different regions, not in estimat-ing the true number of substitutions accumulated over families: expect (E) value of 10⫺6 and 60% similarity
across at least 80% of the alignment. We used these evolutionary time. By not assuming any substitution model, we can compare proportions of difference in a robust relatively strict search criteria to maximize the
probabil-ity that orthologous rather than paralogous sequences fashion that is not model dependent. Because within each species the distributions ofpS,pN, andp deviated
would be identified. When sequence families were
iden-tified, we chose for further analysis only those families significantly from normality (P⬍0.01 by Kolmogorov-Smirnov test), we used nonparametric methods for all including a single member from each of the two
conspe-cific genomes. This was done to avoid the problem of statistical tests. In all analyses, significance levels were adjusted for multiple testing using the Bonferroni cor-identifying orthologs in cases where recent gene
dupli-cation had occurred in one or both of the genomes rection. We conducted nonhierarchicalk-means cluster-ing uscluster-ing McQueen’s algorithm (Johnson and
Wic-compared. Finally, 5⬘spacer sequences were linked by
genomic location with adjacent coding sequences. hern 1992). This is a method of creating clusters of observed multivariate data points such that variability The resulting sequence data set for each species
in-cluded the sequences of putatively orthologous gene within clusters is minimized and variability between clus-ters is maximized. All statistical analyses were conducted pairs together with their 5⬘ spacers. In every case in
which the data set included two genes in head-to-head using the Minitab statistical package, release 13 (http:// www.minitab.com/).
orientation (thus sharing a 5⬘ spacer), one of the two genes was excluded at random. Preliminary analyses showed that the results were not affected by the choice
RESULTS
of gene to exclude; similar results were obtained when
the excluded gene was used. The numbers of pairs of Patterns of nucleotide difference: Table 1 summa-rizes mean and medianpSandpNin coding regions and
orthologous genes and 5⬘spacers for each species are
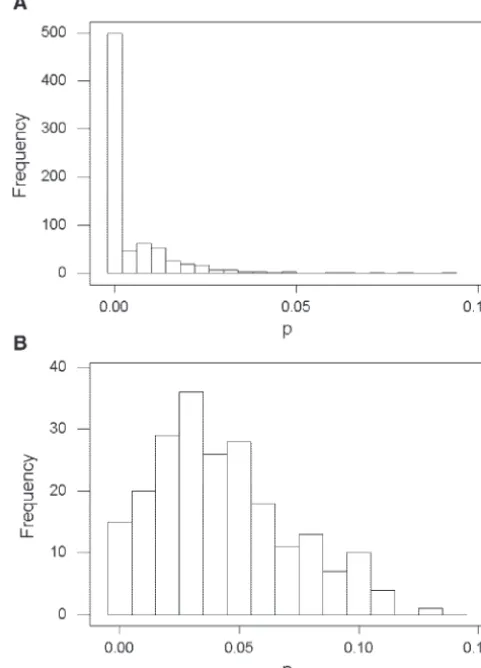
Figure 1.—Frequency distributions of the proportion of nucleotide difference (p) in spacers of (A)S. agalactiaeand (B)H. pylori.
analyzed. The distributions of all three quantities were positively skewed, in most cases extremely so; thus mean values were typically substantially higher than median values (Table 1). The distribution ofpin 5⬘spacers of
S. agalactiae provides an example (Figure 1A). In this species, a majority of 5⬘spacers compared between the two genomes showed no nucleotide differences, while a small number showed substantially higher p values, with a maximum value of 0.093 (Figure 1A). Similar distributions were seen forpS,pN, andpin most species
(Table 1). The least-skewed distributions were those of
pSandpinH. pylori(Table 1 and Figure 1B). The two
genomes ofH. pyloriwere much more divergent overall than were those of any other species analyzed, as indi-cated by the relatively high medianpSandpinH. pylori
(Table 1).
In 6 of the 10 species analyzed, it was possible to reject the hypothesis that the median pairwise difference be-tweenpSandpNwas equal to zero (Table 1). The pattern
ofpS⬎pNseen in these 6 species is indicative of purifying
selection acting to a greater extent on nonsynonymous mutations than on synonymous mutations and is typical of most protein-coding genes (Kimura 1977;Hughes
TABLE 2
Mean and median percentage of G⫹⫹C at GC3 and in GC5ⴕ
GC3 GC5⬘
Species Mean⫾SE Median Mean⫾SE Median
C. pneumoniae 34.5⫾0.2 34.8 32.2⫾0.3 32.4a
E. coli 54.5⫾0.2 55.4 42.5⫾0.2 42.3a
H. pylori 43.0⫾0.3 43.2 27.9⫾0.3 27.3a
M. tuberculosis 79.2⫾0.2 79.8 62.1⫾0.2 62.6a
N. meningitides 61.7⫾0.5 63.9 44.6⫾0.3 45.1a
S. aureus 22.7⫾0.1 22.2 27.1⫾0.1 26.5a
S. agalactiae 25.0⫾0.1 24.8 28.1⫾0.2 27.6a
S. pneumoniae 35.2⫾0.3 35.8 31.4⫾0.3 31.1a
S. pyogenes 31.5⫾0.2 31.4 32.0⫾0.2 31.6 Y. pestis 48.0⫾0.2 48.8 40.5⫾0.2 40.8a
aWilcoxon signed-rank tests of the hypothesis that the
me-dian GC3 equals the meme-dian GC5⬘ (P⬍ 0.001, Bonferroni corrected).
1999). In five of these six species, median p in the 5⬘ spacer was also significantly less than medianpSin the
linked protein-coding gene (Table 1). The four species that did not show significant differences either between medianpSandpNor between medianpSandpwere the
species with the lowest meanpSandp(Table 1).
In four species, there was a significant difference be-tween medianpin the 5⬘spacer and medianpNin the
linked gene (Table 1). In three of these species, median
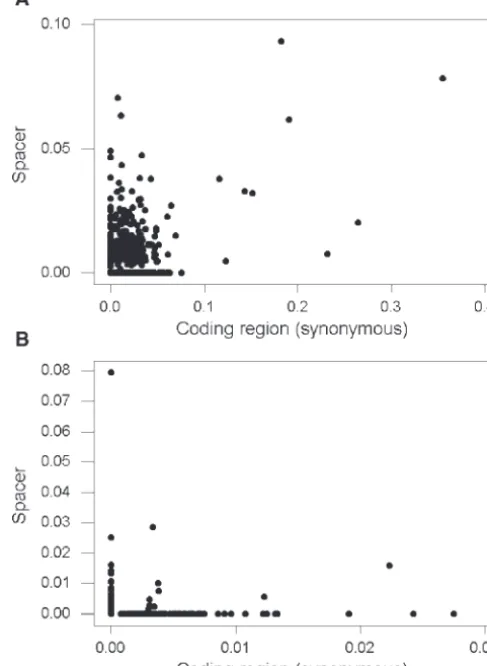
pwas greater than medianpN. This is evidence that, in Figure 2.—Plots of p in 5⬘ spacers vs. pS in the linked
these species, purifying selection on spacers was not as coding region for (A)S. agalactiae(Spearman rank correlation coefficientrS⫽0.397;P⬍0.001) and for (B)C. pneumoniae
stringent as that on nonsynonymous sites in genes. By
(rS⫽0.010; n.s.).
contrast, inM. tuberculosis, medianpin the spacers was significantly lower than medianpNin the linked genes
(Table 1).
between the two genomes (Figure 2A). As a
conse-Nucleotide content: Table 2 summarizes mean and
quence, inS. agalactiae, there was a strong positive corre-median G⫹ C content at third positions of codons in
lation betweenpandpS(Figure 2A).
genes (GC3) and in linked 5⬘spacers (GC5⬘). The
spe-C. pneumoniaeprovided an example of a very different cies analyzed showed a wide range of G ⫹C contents
pattern, in which genes with highpSgenerally had low
from very high (M. tuberculosis) to very low (S. aureus)
p in the 5⬘ spacer and vice versa (Figure 2B). In C.
(Table 2). In 9 of 10 species, there was a significant
pneumoniae, the two genomes compared were identical difference between median GC3 and median GC5⬘
(Ta-in both synonymous sites and (Ta-in the 5⬘spacer in 366 of ble 2). In 7 species, median GC3 was significantly higher
494 genes (74.1%). There were 87 genes with nonzero than GC5⬘(Table 2). However, in 2 species, S. aureus
pS and 50 genes with nonzerop in the 5⬘ spacer, but
and S. agalactiae, median GC3 was significantly lower
only 9 genes had both nonzeropSand nonzerop(Figure
than median GC5⬘(Table 2). These two species were
2B). As a consequence, there was not a significant corre-the two species with corre-the lowest overall G⫹C levels.
lation betweenp andpS inC. pneumoniae (Figure 2B).
Recombinational patterns:The relationship between
M. tuberculosisandS. pyogenes(data not shown) provided
pin 5⬘spacers andpSin the linked genes differed
strik-additional examples of a pattern similar to that seen in ingly among species. InS. agalactiae, there were
numer-C. pneumoniae(Figure 2B). ous genes at which the two genomes showed few
nucleo-These different patterns can be interpreted as re-tide differences either at synonymous sites or in the 5⬘
sulting from different patterns of past recombination. spacer. In fact, in 297 of 746 genes (39.8%), the two
If a certain sequence region shows substantially greater genomes were identical in both synonymous sites and
divergence between two conspecific genomes than do in the 5⬘spacer. On the other hand, there were a
num-most other regions, this pattern might be explained by ber of other cases inS. agalactiaein which both a gene
TABLE 3
Fourth-order rank partial correlation coefficients between the proportion of nucleotide difference (p)
in 5ⴕspacers and five variables describing the spacer and the adjacent protein-coding gene
(simultaneously controlling for other variables)
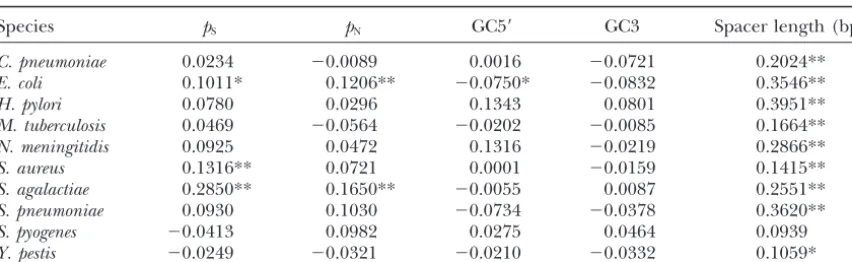
Species pS pN GC5⬘ GC3 Spacer length (bp)
C. pneumoniae 0.0234 ⫺0.0089 0.0016 ⫺0.0721 0.2024**
E. coli 0.1011* 0.1206** ⫺0.0750* ⫺0.0832 0.3546**
H. pylori 0.0780 0.0296 0.1343 0.0801 0.3951**
M. tuberculosis 0.0469 ⫺0.0564 ⫺0.0202 ⫺0.0085 0.1664**
N. meningitidis 0.0925 0.0472 0.1316 ⫺0.0219 0.2866**
S. aureus 0.1316** 0.0721 0.0001 ⫺0.0159 0.1415**
S. agalactiae 0.2850** 0.1650** ⫺0.0055 0.0087 0.2551**
S. pneumoniae 0.0930 0.1030 ⫺0.0734 ⫺0.0378 0.3620**
S. pyogenes ⫺0.0413 0.0982 0.0275 0.0464 0.0939
Y. pestis ⫺0.0249 ⫺0.0321 ⫺0.0210 ⫺0.0332 0.1059*
*P⬍0.01; **P⬍0.0001 (Bonferroni corrected).
obtained the divergent region from a distantly related tween p in 5⬘ spacers and pS in genes in S. agalactiae
and two other species persists even when other variables donor genome (Hugheset al. 2002). The pattern seen
inS. agalactiae (Figure 2A) suggests that in a number are controlled for statistically. Thus, they are consistent with the hypothesis that recombination events involving of cases both genes and their 5⬘spacers have been
de-rived by recombination with divergent genomes. InC. both a gene and its 5⬘ spacer have occurred in the evolutionary history of the S. agalactiaegenomes
com-pneumoniae, by contrast, certain genes and certain
spac-ers appear to be derived from divergent genotypes, but pared here.
Cluster analysis:In addition to patterns of
recombina-the plot ofp vs. pS(Figure 2B) suggests that there were
few if any cases in which a divergent gene and 5⬘spacer tion, chance variation in the pattern of nucleotide sub-stitution can potentially cause different levels of se-were acquired as a unit.
Numerous factors, in addition to recombination, can quence divergence to occur in different regions of two related genomes. However, it is expected that sequence potentially influence the pattern of sequence
diver-gence in genomic regions. These include the relative differences due to chance variation will be relatively small.Hughes et al.(2002) tested the hypothesis that strength of purifying selection and bias in nucleotide
composition. Because these factors are likely to interact certain values of pS observed between two genomes of
M. tuberculosis were too high to be accounted for by in complex ways, we computed rank partial correlation
coefficient between p in 5⬘ spacers and a set of other chance, assuming that nucleotide differences follow a binomial distribution. Here we take a different ap-variables, simultaneously controlling for other variables
in the set (Table 3). In these analyses, a significant positive proach, which does not make any assumptions about the underlying model of sequence evolution.
partial correlation betweenpin 5⬘spacers andpSin genes
was observed in three species: E. coli, S. aureus, and S. Individual genes were clustered using ak-means clus-tering algorithm (withk⫽3) on the basis ofp in the
agalactiae(Table 3). InE. coliandS. agalactiae, a significant
positive partial correlation was also observed betweenpin 5⬘spacer andpSin the coding region. Then the equality
of medianpandpSvalues across clusters was tested by
5⬘spacers andpNin genes (Table 3).
The G⫹C content in 5⬘spacers (GC5⬘) and at third Kruskal-Wallis test.
Recombination that does not break up the linkage positions of codons in coding regions (GC3) was not
significantly correlated with p in all cases except that between genes and 5⬘ spacers is expected to yield the presence of one or more clusters of genes in which both there was a negative partial correlation betweenpand
GC5⬘inE. coli (Table 3). In all but one species, there pandpSvalues are relatively high. This pattern was seen
in S. agalactiae (Table 4), as expected on the basis of was a significant positive partial correlation betweenp
in the spacer and length of the spacer (Table 3). When the plot of p vs. pS (Figure 2A). In S. agalactiae, there
were nine genes in a cluster with relatively high values a similar partial correlation analysis was used to examine
the relationship betweenpS and GC3 (simultaneously of bothpandpS(Table 5). A second, larger cluster (232
genes) had intermediate values ofp andpS, while the
controlling forp,pN, GC5⬘, and spacer length), no
sig-nificant relationships were found except for a highly largest cluster (505 genes) had median values of zero for both p and pS (Table 4). Median p and pS were
significant positive correlation between pS and GC3
be-TABLE 4
Median p in the 5ⴕ spacer and pSin the coding region for
clusters of genes identified byk-means clustering
Species Cluster no. N p pS
C. pneumoniae 1 3 0.0286 0.0000
2 458 0.0000 0.0000
3 33 0.0000 0.0070
E. coli 1 78 0.0091 0.1396
2 525 0.0065 0.0647
3 850 0.0041 0.0245
S. agalactiae 1 9 0.0328 0.1820
2 232 0.0063 0.0256 Figure3.—Plot of the proportion of nucleotide difference 3 505 0.0000 0.0000 (p) between two genomes ofS. agalactiaein a sliding window of 100 nucleotides across the genomic region including the purgenes. Nucleotide position of the starting point of each
S. pyogenes 1 1 0.0844 0.0000
window on thex-axis is numbered as in the 2603V/R genome
2 679 0.0000 0.0000
(NC_004116; positions 35756–61023).
3 3 0.0000 0.0133
Y. pestis 1 7 0.0208 0.0000
Recombination regions inS. agalactiae:To examine
2 1298 0.0000 0.0000
further the recombinational history ofS. agalactiae, we
3 3 0.0000 0.0387
examined the chromosomal locations of the nine genes
Kruskal-Wallis tests of the equality of medians across
clus-from the cluster (Table 4) most divergent between the
ters:P⬍0.01 in all cases (Bonferroni corrected).
two genomes in the 5⬘spacers and at synonymous sites in the coding regions (Table 5). Three of these genes (encoding phosphoribosylformylglycanimide synthase, clusters with significantly different medians for bothp
andpS (Table 5). As inS. agalactiae, the clusters in E. phosophoribosylamine-glycine ligase, and the
phospho-ribosylaminoimidazole carboxylase catalytic subunit)
coliwere characterized by increasing numbers of genes
and decreasing median values ofp vs. pS (Table 5). are involved in purine metabolism (Table 5). Homologs
of these and other genes involved in purine synthesis We predicted that recombination breaking up the
linkage between genes and 5⬘spacers would lead to the are linked and regulated as an operon (thepuroperon) in certain bacteria (Ebbole and Zalkin 1987). In S.
presence of a cluster with relatively high p but lowpS
and another cluster with relatively low p but high pS. agalactiae, the corresponding genes are scattered over
a region that occupiesⵑ25 kb and includes about 23 This pattern was seen in C. pneumoniae (Table 4), as
expected on the basis of the plot ofp vs. pS(Figure 2B). genes, apparently not all of them involved in purine
synthesis. We refer to this region as the pur region, A similar pattern was seen in S. pyogenes and Y. pestis
(Table 4). In these species, although the numbers of recognizing that it is probably not regulated as an op-eron in S. agalactiae, given the presence of genes not genes with unusually highpandpSwere relatively few,
the clusters were nonetheless significantly different with involved in purine synthesis.
Figure 3 shows a sliding window plot ofpacross the respect to medianpandpSvalues (Table 4).
TABLE 5
Genes ofS. agalactiaewith highpSin coding region and highpin adjacent 5ⴕspacer
Protein function 5⬘spacera p Coding regiona p
S pN
Phosphoribosylformylglycinamidine synthase 36461–36582 0.0328 36583–40408 0.1433 0.0155 Phosphoribosylamine-glycine ligase 57110–57990 0.0320 57991–59256 0.1520 0.0073 Phosphoribosylaminoimidazole carboxylase 59257–59536 0.0618 59537–60025 0.1909 0.0219
Integrase 232951–233014 0.0781 231796–232950 0.3554 0.0257
Unknown 240364–240869 0.0378 240076–240363 0.1163 0.0133
Acetyl transferase 262238–262336 0.0202 262337–262915 0.2649 0.0408
Unknown 901703–902089 0.0078 902090–906202 0.2320 0.0743
dTDP-glucose-4,6-dehydratase 12058814–1206019 0.0049 1204767–1205813 0.1230 0.0143 Hypothetical transcriptional regulator 1340567–1340839 0.0933 1340126–1340566 0.1823 0.0203
purregion in comparison with theS. agalactiaegenomes. in genes were also the species with the lowest overall There were two portions of the pur region, approxi- sequence divergence (in both spacers and genes) be-mately positions 35929–43467 and 53145–61023, in tween the two genomes compared (Table 1). Because which the two genomes showed substantial sequence of this low level of sequence divergence, it may not be divergence (Figure 3). By contrast, in the center portion possible to detect differences between spacers and genes of thepurregion, the two genomes were virtually identi- in these species even though purifying selection is pres-cal (Figure 3). The first divergent region (35929–43467) ent on the former.
spanned six predicted protein-coding genes, including A major factor responsible for purifying selection on one of the genes in our data set with highpin 5⬘spacers spacers is presumably the presence of regulatory ele-and high pS in coding regions (Table 5). The second ments. Consistent with this hypothesis, in 9 of 10 species
divergent region (53145–61023) included eight pre- a significant positive partial correlation was observed dicted genes, including two of the genes in our data set betweenpin spacers and the length of the spacer (Table with highpin 5⬘spacers and highpSin coding regions 3). This correlation may be explained by the fact that the
(Table 5). Because these two regions showed higher proportion of sites that constitute conserved promoter sequence divergence than is typical for these two ge- sequences is expected to be lower in longer spacers. nomes (Tables 1 and 4), it seems likely that these two Additional evidence for functional constraint on spac-portions of thepurregion have been involved in recom- ers was provided by data on nucleotide content. In a bination events that introduced divergent sequences majority of the species examined, the median propor-into one of the two genomes. Because there are two tion G ⫹ C in 5⬘ spacers was significantly lower than distinct divergent regions, it seems plausible that there that at synonymous sites in genes (Table 2). It is well were at least two such recombination events, although known that bacterial promoters include certain con-there may have been more than two. served AT-rich regulatory elements, including not only When a similar sliding window analysis was applied the⫺10 and ⫺35 hexamers but also the UP elements to the entire genome ofS. agalactiae, it likewise showed (Gourseet al. 2000). The reduction of G⫹C content regions of sequence identity interspersed with divergent in spacers relative to synonymous sites in genes may at regions (not shown). Overall, regions of sequence iden- least reflect in part the conservation of such regulatory tity predominated; in 1,392,801 of 1,955,174 (71.2%) elements and surrounding A- and T-rich sequences. In genomic windows, the two genomes were identical. On
two species (S. aureus and S. agalactiae) with very low the other hand, there were interspersed regions of
overall G⫹ C content, the median proportion G⫹C greater divergence, in which the genes with high values
in 5⬘spacers was actually significantly greater than that of bothpin the 5⬘spacer andpSin the coding region at synonymous sites in genes (Table 2). In these cases,
(Table 5) were found.
the conservation of regulatory elements may require a G⫹ C content greater than that of synonymous sites
DISCUSSION in genes, since these elements include G and C at certain positions (Gourseet al. 2000).
We compared the patterns of nucleotide difference
Certain genes showed unusually high pS, unusually
in genes and in the spacer regions located 5⬘to genes
highpin the 5⬘spacer, or both, in comparison to other between 10 pairs of conspecific bacterial genomes to
genes in the same pair of conspecific genomes. The obtain evidence regarding the comparative evolutionary
most plausible explanation for such cases is recombina-dynamics of genes and spacers. In five of the species
tion with divergent genomes (Hugheset al.2002). One analyzed, the median proportion of nucleotide
differ-limitation of using the nonuniformity of nucleotide dif-ence (p) in the 5⬘ spacer was significantly lower than
ferences as evidence for past recombination is that such the median proportion of synonymous difference (pS)
evidence will not be available if recombination has in-in the codin-ing region (Table 1). These were the five
volved very similar genomes; but of course this is true species for which the genome pairs showed the greatest
of all kinds of evidence of recombination, including overall sequence divergence (Table 1), suggesting that
that obtained from classical genetics, which requires a certain level of sequence divergence is required for the
differentiation of markers. Nonetheless, the presence difference between genes and spacers to be detected.
of certain unusually high values ofpSandpin the
com-Evidence for a reduced level of nucleotide divergence
parison of two otherwise closely related genomes (such in spacers compared to synonymous sites in genes
sug-as the two genomes ofC. pneumoniaecompared here) gests that intergenic spacers in general are subject to
is suggestive of divergent origins for these divergent purifying selection. Furthermore, the selection on
spac-genes. Alternative hypotheses to explain such a pattern ers at least in these five species is stronger than any
include (1) chance variation among genes with respect purifying selection (due, for example, to selection on
to the number of nucleotide differences and (2) the codon usage) that may act on synonymous sites in genes.
effects of changes in natural selection. However, there The five species in which there was no significant
hypothe-ses is likely to explain the majority of cahypothe-ses observed in were substantially more divergent than the 5⬘ spacer, but there were no cases in which both gene and spacer the present data set.
Assuming a probability model, it is possible to com- were unusually divergent (Table 4). By contrast, in S. agalactiae andE. coli, there were a number of cases in pute the probability of a given degree of sequence
diver-gence. For example, Hughes et al. (2002) assumed a which both spacer and gene were unusually divergent (Table 4). Partial correlation analyses indicated that binomial model and showed that, under this model, the
pSvalues obtained for certain genes in the comparison factors such as nucleotide content could not account for
this pattern (Table 3). Therefore, the most reasonable of the two available complete genomes ofM. tuberculosis
were extremely unlikely to occur as a result of random interpretation seems to be that, inC. pneumoniae, recom-bination events have broken up the linkage between variations in the pattern of nucleotide substitution. In
the present study, we used an alternative approach based genes and 5⬘ spacers, whereas in the S. agalactiae ge-nomes a number of large-scale recombination events onk-means clustering, which has the advantage that it
does not depend on any assumptions about the underly- that included both genes and 5⬘spacers have occurred. The latter hypothesis was supported by a sliding win-ing model of sequence evolution. In the case ofS.
agalac-tiae, this approach isolated a cluster of nine genes with dow comparison of the twoS. agalactiaegenomes. The relatively high values ofpin the 5⬘spacer andpSin the portion of the genome including thepurgenes showed
coding region (Tables 4 and 5). InC. pneumoniaeand evidence of two extensive recombination regions, includ-three other species, this approach yielded both clusters ing multiple genes and spacers (Figure 3). Although these of genes with high p in the 5⬘ spacer but low pS and genes evidently do not constitute an operon inS.
agalac-clusters of genes with lowp in the 5⬘spacer and high tiae, their expression must be coordinated in some
fash-pS(Table 4). The fact that the medianpandpSvalues ion. In such cases, recombination events that include
differed significantly among these clusters is strong evi- several genes along with their 5⬘spacers may have more dence that they are not simply the result of random chance of success than the exchange of shorter regions variations in the pattern of nucleotide substitution. because genes and regulatory regions will be transferred It is uncertain how natural selection might cause an together. Furthermore, such exchanges have the poten-increase inpS, since natural selection acts primarily at tial to introduce new regulatory pathways to a genotype
the level of protein sequence and structure (Hughes and thus contribute to adaptive evolution of bacterial 1999). The only plausible such effect might be the relax- phenotypes.
ation in certain genes of constraints on codon usage As more genomes of S. agalactiaeare sequenced, it present in most genes in a genome. This seemed un- should be possible to identify the source of divergent likely to be a major factor in the present analyses for a genomic regions, thereby providing definitive evidence number of reasons. First, in 9 of 10 species there was in support of the hypothesis of recombination. not a significant partial correlation betweenpSand G⫹ This research was supported by grant GM43940 from the National
C content at third-codon positions. InE. coli, there was Institutes of Health. a significant positive partial correlation betweenpSand
G⫹C content at third-codon positions. However, since the preferred codons inE. coliare usually those ending
LITERATURE CITED
in G or C (SharpandLi1986), this positive correlation
Altschul, S. F., T. L. Madden, A. A. Scha¨ffer, J. Zhang, Z. Zhang is not consistent with a relaxation of selection. Similarly,
et al., 1997 Gapped BLAST and PSI-BLAST: a new generation
an increase inpmight be explained by a relaxation of of protein database search programs. Nucleic Acids Res.25:3389– purifying selection on a given spacer. However, the fact 3402.
Ebbole, D. J., andH. Zalkin, 1987 Cloning and characterization
that median values ofpin spacers remained substantially
of a 12-gene cluster fromBacillus subtilisencoding nine enzymes
lower than median pSin linked genes—even in the S. for de novo purine nucleotide synthesis. J. Biol. Chem. 262:
agalactiae genes in which both values were unusually 8274–8287.
Feil, E. J., M. C. EnrightandB. G. Spratt, 2000 Estimating the
high (Tables 4 and 5)—was evidence against the
hypoth-relative contributions of mutation and recombination to clonal
esis that relaxation of selection can account for most diversification: a comparison betweenNeisseria meningitidesand cases of unusually highpin spacers. Streptococcus pneumoniae.Res. Microbiol.151:465–469.
Felsenstein, J., 1985 Phylogenies and the comparative method.
The pattern of nucleotide divergence in spacers and
Am. Nat.125:1–15.
at synonymous sites in linked genes provided evidence
Fuglsang, A., 2004 Evolution of prokaryotic DNA: intragenic and
regarding the extent to which genes and 5⬘spacers are extragenic divergences observed with orthologs from three re-lated species. Mol. Biol. Evol.21:1152–1159.
transferred together by recombination events. Different
Gourse, R. L., W. RossandT. Gaal, 2000 UPs and downs in
bacte-patterns were seen in different species, indicative of
rial transcription initiation: the role of the alpha subunit of RNA
distinct recombinational histories. In C. pneumoniae,S. polymerase in promoter recognition. Mol. Microbiol.37:687– 695.
pyogenes, andY. pestisthere were genes in which the 5⬘
Hughes, A. L., 1999 Adaptive Evolution of Genes and Genomes. Oxford
spacer was substantially more divergent between the two
University Press, New York.
genomes than were synonymous sites in the linked gene, Hughes, A. L., R. FriedmanandM. Murray, 2002 Genomewide
pattern of synonymous nucleotide substitution in two complete
genomes ofMycobacterium tuberculosis.Emerg. Infect. Dis.8:1342– of cis-regulatory elements versus codifying regions. Int. J. Dev. Biol.47:665–673.
1346.
Rogozin, I. B., K. S. Makarova, D. A. Natale, A. N. Spiridonov, Johnson, R., andD. Wichern, 1992 Applied Multivariate Statistical
R. L. Tatusov et al., 2002 Congruent evolution of different
Methods, Ed 3. Prentice-Hall, Englewood Cliffs, NJ.
classes of non-coding DNA in prokaryotic genomes. Nucleic Acids
Jordan, I. K., I. B.Rogozin, Y. I.Wolfand E. V.Koonin, 2002
Mi-Res.30:4264–4271. croevolutionary genomics of bacteria. Theor. Popul. Biol. 61:
Schwartz, S., W. J. Kent, A. Smit, Z. Zhang, R. Baertschet al., 435–444.
2003 Human-mouse alignments with BLASTZ. Genome Res.
Kimura, M., 1977 Preponderance of synonymous changes as
evi-13:103–107. dence for the neutral theory of molecular evolution. Nature267:
Selander, R. K., D. A. Caugant, H. Ochman, J. M. Musser, M. N.
275–276.
Gilmouret al., 1986 Methods of multilocus enzyme
electropho-Kohn, M. H., S. FangandC.-I Wu, 2004 Inference of positive and
resis for bacterial genetics and systematics. Appl. Environ. Micro-negative selection on the 5⬘regulatory regions ofDrosophilagenes.
biol.S1:873–884. Mol. Biol. Evol.21:374–383.
Sharp, P. M., andW.-H. Li, 1986 An evolutionary perspective on
McGraw, E. A., J. Li, R. K. SelanderandT. S. Whittam, 1999
Mo-synonymous codon usage in unicellular organisms. J. Mol. Evol. lecular evolution and mosaic structure of␣,, and␥intimins of
24:28–38. pathogenicEscherichia coli.Mol. Biol. Evol.16:12–22.
Thompson, J. D., D. G. HigginsandT. Gibson, 1994 CLUSTALW:
Nei, M., andT Gojobori, 1986 Simple methods for estimating the improving the sensitivity of progressive multiple sequence align-numbers of synonymous and nonsynonymous nucleotide substi- ment through sequence weighting, position-specific gap penalties tutions. Mol. Biol. Evol.3:418–426. and weight matrix choice. Nucleic Acids Res.22:4673–4680.
Rockman, M. V., M. W. Hahn, N. Sorzano, D. B. Goldsteinand Wray, G. A., M. W. Hahn, A. Abouheif, J. P. Balhoff, M. Pizeret al.,
G. A. Wray, 2003 Positive selection on a human-specific tran- 2003 The evolution of transcriptional regulation in eukaryotes. scription factor binding site regulating IL4 expression. Curr. Biol. Mol. Biol. Evol.20:1377–1419.
13:2116–2123.