Volume 2011, Article ID 170927,13pages doi:10.1155/2011/170927
Research Article
Synthesis of an Optimal Wavelet Based on
Auditory Perception Criterion
Abhijit Karmakar,
1Arun Kumar,
2and R. K. Patney
31Integrated Circuit Design Group, Central Electronics Engineering Research Institute/Council of Scientific and Industrial Research, Pilani 333031, India
2Centre for Applied Research in Electronics, Indian Institute of Technology Delhi, New Delhi 110016, India 3Department of Electrical Engineering, Indian Institute of Technology Delhi, New Delhi 110016, India
Correspondence should be addressed to Abhijit Karmakar,[email protected] Received 2 July 2010; Revised 3 November 2010; Accepted 4 February 2011
Academic Editor: Antonio Napolitano
Copyright © 2011 Abhijit Karmakar et al. This is an open access article distributed under the Creative Commons Attribution License, which permits unrestricted use, distribution, and reproduction in any medium, provided the original work is properly cited.
A method is proposed for synthesizing an optimal wavelet based on auditory perception criterion for dyadic filter bank implementation. The design method of this perceptually optimized wavelet is based on the critical band (CB) structure and the temporal resolution of human auditory system (HAS). The construction of this compactly supported wavelet is done by designing the corresponding optimal FIR quadrature mirror filter (QMF). At first, the wavelet packet (WP) tree is obtained that matches optimally with the CB structure of HAS. The error in passband energy of the CB channel filters is minimized with respect to the ideal QMF. The optimization problem is formulated in the lattice QMF domain and solved using bounded value global optimization technique. The corresponding wavelet is obtained using the cascade algorithm with the support being decided by the temporal resolution of HAS. The synthesized wavelet is maximally frequency selective in the critical bands with temporal resolution closely matching with that of the human ear. The design procedure is illustrated with examples, and the performance of the synthesized wavelet is analyzed.
1. Introduction
Wavelet transform is an important signal processing tool to analyze nonstationary signals with frequent transients, as in the case of speech and audio signals. It divides a signal into different frequency components, and each component can be analyzed with a resolution matched to its scale. Its major advantage over the short-time Fourier transform (STFT) is that it is possible to construct orthonormal wavelet bases that are well localized over both time and frequency.
It has also long been recognized that human auditory perception plays a crucial role in various speech and audio applications. Some of the many applications where models of auditory perception have been exploited are in speech and audio coding, speech enhancement, and audio watermarking [1–3]. Wavelet-based time-frequency transforms have also been applied in these applications, and models of auditory perception such as critical band (CB) structure and auditory masking have been incorporated [4,5]. In many
wavelet-based speech and audio processing applications such as in [4,5], the input signal is decomposed in accordance with the perceptual frequency scale of human auditory system. Thus, perceptually motivated wavelet packet (WP) transform is a popular method for dividing the signal into auditory inspired frequency components, before processing them with a resolution matched to their scale.
wavelet based on the perceptual frequency scale of human auditory system, such as in [9,10] for continuous wavelet transform. These methods do not provide the requisite filter bank structure for the dyadic multiresolution analysis.
In this paper, we have proposed a design method for synthesizing an optimal mother wavelet for auditory per-ception-based dyadic filter bank implementation. The design method optimally exploits the CB structure and temporal resolution of human auditory system. The proposed method for synthesizing this compactly supported wavelet is by de-signing the corresponding optimal wavelet-generating FIR quadrature mirror filter (QMF). The approach followed for the construction of this wavelet is to first obtain the WP tree which closely mimics the CB structure of the human auditory system. This is followed by obtaining the error in passband energy of the CB channel filter responses with respect to the case where the QMFs in the WP tree are replaced by the ideal brick-wall QMFs. These error components are suitably weighted to obtain the performance measure of optimiza-tion. The optimization problem is formulated as a single objective unconstrained optimization problem in lattice QMF domain, and the solution is obtained by bounded value global optimization technique. Then, the corresponding wavelet is derived using the cascade algorithm. The support of the wavelet is decided by the temporal resolution of the human auditory system. The synthesized optimal wavelet is found to be maximally frequency selective in the critical bands with temporal resolution matched with that of the human ear. The wavelet design procedure is elaborated with an example, and the performance is compared with respect to other important wavelets such as the Daubechies wavelet, Symlet, and Coiflet.
The rest of the paper is organized as follows.Section 2
describes the broad framework of the design of the proposed perceptually optimized wavelet. In Section 3, the design criterion is elaborated for obtaining the optimal wavelet packet tree. Section 4 deals with the details of the design procedure of the optimal wavelet. Section 5 presents the results. Finally, the paper is concluded withSection 6.
2. Synthesis Framework of the Perceptually
Optimized Wavelet
The method of designing the perceptually motivated wavelet starts with the design of the optimal WP tree that closely matches the CB structure of the human auditory system. The widely used Zwicker’s model of CB structure is used for this purpose which gives a mapping from the physical frequency scale to the critical band rate scale, as given by [11,12]
z=Ff
=13 arctan
0.76×f
103
+ 3.5 arctan ⎡ ⎣
10−3f 7.5
2⎤ ⎦,
(1)
Bf=25 + 751 + 1.4×10⁻⁶f20.69. (2)
Here, z is the critical band rate scale in Bark, f is the frequency in Hz, andB(f) is the critical bandwidth in Hz at frequency f. The criterion for obtaining the optimal wavelet packet tree based on Zwicker’s model can be found in [13]. The perceptual criterion minimizes the cost function and allocates an optimal set of terminating nodes at each decomposition depth of the WP tree so that the error in quantizing B(f) in (2) is minimal in the Bark domain.
In the present paper, using the optimal WP tree obtained from [13], we construct a wavelet which produces maximally frequency selective filter response in each of the CB channels for the corresponding filter bank implementation. Further, the support length of the wavelet is determined by the temporal resolution of the human auditory system.
From the optimal WP tree, the nontree filter structure is obtained which represents the equivalent filtering followed by the combined decimator for each of the CB channels. Using the equivalent nontree filter structure, the error in energy of each of the CB filter impulse responses with respect to the ideal brickwall QMF is obtained. These error components in each channel are minimized with respect to the constraints of QMF. The multiple-objective constrained global optimization problem is converted into a single-objective constrained global optimization problem by taking a suitably weighted average of the energy error terms, denoted as the performance measure of optimization.
The optimization problem is reformulated into an unconstrained optimization problem by converting the QMF constraints in lattice QMF domain [14, 15]. In lattice QMF domain, the performance measure is expressed in terms of Givens rotations [14,15] which absorb the QMF constraints of the optimization problem. Using the 2π -periodicity of Givens rotations, the problem is converted into a bounded value optimization problem [16]. The solution of the global optimization problem is obtained using multilevel coordinate search (MCS) [17]. Using the cascade algorithm (also known as the successive approximation algorithm) [18], the desired wavelet is synthesized. The support of the wavelet is selected in accordance with the temporal resolution of the human ear [19]. This is done by choosing the support of the wavelet so that its time duration is less than the temporal resolution of human auditory system.
Thus, the wavelet synthesized as above is optimal with respect to the critical band structure and temporal resolution of the human auditory system. The design process of the wavelet is elaborated for the case of sampling frequency of
fs=16 kHz.
3. The Optimal
WP
Tree Based on CB Structure
3.1. Wavelet Packet Transform. In discrete wavelet transform (DWT) a signal, s(t) in L2(R), limited to a scale J can be represented as
s(t)= ∞
k=−∞
c0[k]φ0,k(t) +
∞
k=−∞
J−1
j=0
dj[k]ψj,k(t), (3)
whereφj,k(t) andψj,k(t) are the two-dimensional families of
functions generated from the scaling functionφ(t) and the waveletψ(t) as
φj,k(t)=2j/2φ
2jt−k,
ψj,k(t)=2j/2ψ
2jt−k.
(4)
Herejdenotes the scale, andkdenotes the integer translates of the scaling function and wavelet as defined below. Also,
cj[k] anddj[k] are the approximation and detail coefficients of the DWT at scale j.
The scaling function and the wavelet are recursively defined as:
φ(t)=√2 ∞
k=−∞
h[k]φ(2t−k), (5)
ψ(t)=√2 ∞
k=−∞
g[k]φ(2t−k), (6)
where, h[k] is the lowpass scaling filter and g[k] is the highpass wavelet filter [18]. The functions φj,k(t), ψj,k(t),
form an orthonormal basis in L2(R). The DWT can be implemented by the pyramid algorithm [6] where the approximation coefficientscj[k] and the detail coefficients
dj[k] in (3) can be obtained by passing through the approximation coefficients of the next higher scale,cj+1[k], to the filtersh[k] andg[k] and downsampled by a factor of two for j =0, 1, 2,. . .,J−1. The filtersh[k] andg[k] form a quadrature mirror filter (QMF) pair [18]. In the Fourier transform domain they are related by
Hejω2+Gejω2=2, (7)
and filtersh[k] andg[k] are related by [18]
g[k]=(−1)kh[1−k]. (8)
For a finite even length filter of orderK, (8) can be written as [18]
g[k]= ±(−1)kh[K−k]. (9)
After the signal is processed by the tree-structured analysis filter bank, the inverse process of interpolation and filtering can be used to reconstruct the signal. The perfect reconstruction of a signal can be achieved using a realizable orthogonal filter bank [14,20]. The perfect reconstruction lowpass and highpass synthesis QMF pair,h1[k] andg1[k], is related to the analysis filters by [20]
h1[k]=h[K−k],
g1[k]=g[K−k].
(10)
The wavelet packet transform (WPT) is an extension of DWT, where both the approximation and detail coefficients are decomposed. A sequence of functions,{νn(t)}∞n=0, can be defined as
ν2n(t)= √
2 ∞
k=−∞
h[k]νn(2t−k),
ν2n+1(t)= √
2 ∞
k=−∞
g[k]νn(2t−k),
(11)
whereν0(t)=φ(t), that is, the scaling function, andν1(t)= ψ(t), that is, the wavelet [21]. The collection of functions
νn(t−k), as defined in (11), forms an orthonormal basis of L2(R). The library of wavelet packet bases is the collection of orthonormal basis functions composed of functions of the form [21]
νn,j,k(t)=2j/2νn
2jt−k. (12)
Denoting the space formed by the basisνn,j,k(t) byWn,j, the
signals(t) limited to a scaleJ, that is,s(t) ∈ W0,J, can be
decomposed in a manner similar to (3), as follows:
s(t)= ∞
k=−∞
J−1
j=0
n⊆Ij
dn,j[k]νn,j,k(t), (13)
whereIj = {0, 1, 2,. . ., 2J−j−1}[22]. Here,dn
,j[k] are the
WPT coefficients. Further, j denotes the scale, andngives their position in the wavelet packet tree. The WPT can be implemented using an extension of the pyramid algorithm where both the approximation and detail coefficients are decomposed in a tree-structured QMF bank.
3.2. Criterion for Obtaining Optimal WP Tree Based on Bark Scale. The criterion minimizes a cost function and allocates an optimal set of number of terminating nodes at each level of decomposition so that the error in quantizing B(f) is minimal in the Bark domain. Here, we seek to identify the segments of B(f), which correspond to dyadically related critical bandwidths, and the number of nodes in each segment so that the error in Bark domain as defined below is minimum.
Let us assume that a signal is limited to a scaleJandjis the variable of scale as given in (13). We define the variable
p as the depth of decomposition given by p = J −j. The input signal sampled at Nyquist rate is taken as the scaling coefficients at the Jth scale. As the signal is decomposed through all the levels, the depth of decomposition varies from
p = 0 to J. The bandwidth available at decomposition depthpis given by
ΔfWP
p= fs
2p+1, (14)
where fs is the sampling frequency of the input signal. For a dyadic WP tree with maximum depth of decom-position L, minimum depth of decomposition M, and
103
103 102
102 104
Center frequency (Hz)
C
ritical
band
w
idth
(Hz)
ΔfWP(M)
B(f)
ΔfWP(L−2)
ΔfWP(L−1)
ΔfWP(L)
nL−1bands
nLbands
nM
bands
fl(L)
fh(L)=
fl(L−1)
fh(L−1)=
f1(L−2) fl(M)=
fh(M−1)fh(M)
· · ·
· · · · · ·
Figure1: Illustration of WP bandwidths and number of terminat-ing nodes at various decomposition depths with respect toB(f).
M≤ p≤L, the termsL,M,np,andΔfWP(p) are related by L
p=MnpΔfWP(p)= fs/2 which can alternatively be written as
L
p=M np
2p =1. (15)
The critical bandwidth in (2) is a monotonically increasing function of the frequency. So the lower frequency bands are progressively decomposed to a deeper depth compared to the higher frequency bands. The frequency range covered by the
pth depth of decomposition is fl(p) ≤ f ≤ fh(p), where
fh(p) = L
m=pnmΔfWP(m), fl(p) = L+1
m=p+1nmΔfWP(m), nL+1 = 0, and M ≤ p ≤ L. Here, fl(p), and fh(p) are respectively, the lower and higher limits of the frequency range covered by the pth depth of decomposition of the WP tree. In Figure 1, the termsL,M,np, fl(p), fh(p) and ΔfWP(p) are illustrated with respect toB(f), for the complete auditory range of 20 Hz–20 kHz.
To obtain the perceptual cost function in the Bark domain, we defineB(z) as an expression relating the critical bandwidth in Hz as a function of center frequency in Bark, that is,
B(z)=BFf=BF−1(z)=Bf. (16)
At the pth decomposition depth, the integral squared error in critical bandwidth in the Bark domain can be obtained as
qep= zh(p)
zl(p)
B(z)−npΔfWP
p2dz, (17)
wherezh(p)=F(fh(p)) andzl(p)=F(fl(p)). The total error
QE, in quantizingB(z), for the complete frequency range 0≤ f ≤ f s/2, can be given byQE=L
p=Mqe(p). Substituting the
expression ofqe(p) and replacingzbyF(f) in the expression ofQE,we obtain
QE= L
p=M fh(p)
fl(p)
Bf−np
fs
2p+1
2
Ffdf, (18)
whereF(f) is obtained by differentiating (1). The perceptual criterion for obtaining the optimal WP tree is to minimize the cost functionQE, that is,
Lopt,Mopt,noptM ,n opt
M+1,. . .,nLopt
=arg min
(L,M,nM,nM+1,...,nL)
{QE}, (19)
subject to the constraint given in (15). One can exhaustively search the possible candidate trees using (15) and obtain the optimum value ofL,M,and the number of terminal nodes at different decomposition depths, that is,nM,nM+1,. . .,nL by evaluating (18).
3.3. Optimal WP Tree for fs = 16kHz and Auditory Band Indexed WP Bases. The above design is explained for the case where the input signal is sampled at fs = 16kHz.
The solution of (19) gives the optimum values L = 6,
M = 3,n3 = 4,n4 = 3, n5 = 6, andn6 = 8. Thus, the minimum depth of decomposition isM =3, the maximum depth of decomposition isL = 6, and the total number of decomposition depths isL−M+ 1=4.Figure 2compares the WP tree with Zwicker’s critical band structure. For this case, the signal can be decomposed as in (13) as follows:
|s(t)|2
dt
=
k
n=0,1,3,2,6,7,5,4
dn,0[k]2+
k
n=6,7,5,4,12,13
dn,1[k]2
+
k
n=7,5,4
dn,2[k]2+
k
n=6,7,5,4
dn,3[k]2.
(20)
In (20), n denotes the position of the WPT coefficients in the WP tree and assumes the appropriate values at the various scales such that the frequency bands are ordered in an ascending manner for the WPT. It is noticed thatnis not in ascending order with respect to the band-ordered WPT coefficients at the various scales. This is because of the fact that, in a dyadic filter bank implementation, when a highpass region is decomposed by a QMF bank, the highpass and lowpass frequency regions swap with each other [22].
4. Design Procedure of the Perceptually
Motivated Optimal Wavelet
4.1. Auditory Band Indexed Optimal WP Tree and Its Filter Bank Implementation. The solution as obtained from the previous section is restated in terms of the CB-indexed WP tree where the indexing is done with increasing center frequencies of the CBs. As given in the previous section, let the optimal WP tree be obtained with maximum depth of decompositionL, minimum depth of decompositionM, and number of branchesnpinpth depth of decomposition. The CBs numberingi=1 toNspanL−M+ 1 sets wherei=1 tonL, form=1;i =nL+ 1 tonL+nL−1form=2;· · ·; i=
102
102 103
103 104
Center frequency (Hz)
C
ritical
band
w
idth
(Hz)
Zwicker’s model Optimal WP tree
(a)
102 103 104
Center frequency (Hz) 0
5 10 15 20 25
C
ritical
band
ra
te
(
z
)
Zwicker’s model Optimal WP tree
(b)
Figure 2: Comparison of optimal WP tree (fs = 16 kHz) with
Zwicker’s critical band structure: (a) critical bandwidth as a function of center frequency, (b) critical band rate as a function of center frequency.
the index of sets having same bandwidth,m=1 toL−M+ 1, andN is the total number of CBs. For the example case of
fs=16 kHz, the first set of critical bands, that is,m=1, are numbered fromi =1 to 8, the second set (m = 2) from 9 to 14, the third set (m=3) from 15 to 17 and the fourth set (m=4) fromi=18 to 21, andN=21.
The filter bank implementation for this case is shown in
Figure 3. These sets of critical bands and the corresponding CB-indexing can be observed from this figure. Note that, each set of critical band is associated with its time resolution and frequency bandwidth. This CB-indexing will be used for obtaining the CB filter impulse responses for the different channels.
Now, the binary tree structure of the optimal WP tree is converted into an equivalent nontree filter structure
using the noble identity for a downsampler as shown in
Figure 4[14]. As can be seen from the figure, a filterA(z) following a decimator M is equivalent toA(zM) preceding
the same decimator. Using the noble identity, the nontree filter structure is obtained for the optimal WP tree. As an illustration, the nontree filter structure corresponding to
Figure 3is shown inFigure 5. In this figure,Hi(z) represents the equivalent filtering at the ith critical band, and the combined decimators follow them. Note that i in Hi(z) denotes the critical band numbers in ascending order of center frequencies of the respective bands.
The lower and upper passband edges of Hi(ejω) are
denoted asωli andωhi, respectively, and can be expressed as
ωli=2π fs
fl(L+1−m)+ fh(L+ 1−m)−fl(L+ 1−m)
nL+1−m i
(21)
ωhi=2π fs
fh(L+1−m) + fh(L+ 1−m)−fl(L+ 1−m)
nL+1−m i
,
(22)
whereiis the index of critical bands in ascending order as explained previously. In (21) and (22),fl(L+1−m) andfh(L+ 1−m) are defined as in between (15) and (16). Further, fs
denotes the sampling frequency. For the ideal brickwall QMF pair [14],HIdeal(ejω) andGIdeal(ejω), the magnitude squared
frequency response of the individual channels is shown in
Figure 6, whereHiIdeal(ejω) is the frequency response of the
equivalent nontree filter structure of the ith critical band in the nontree filter structure. This figure also shows the passband edges of the CB filters for the particular example being considered.
4.2. CB Channel Filter Errors and the Optimization Problem.
The integral squared error in passband energy of the individual CB channel filters with respect to the ideal case can be expressed as
Ei=2 ωhi
ωli
HiIdealeiω2−Hieiω2
dω
2π, i=1,...,N,
(23)
whereωliandωhiare the low and high band edges of the
ith critical band and are given by (21) and (22), respectively. Note that, the term in the integral is always a nonnegative quantity, as
2 ωhi
ωli
HiIdealeiω2dω
2π =1,
2 ωhi
ωli
Hieiω2dω
2π ≤1.
h h h h h h h h h h h h h h h h h h h h CB 1 CB 2 CB 3 CB 4 CB 5 CB 6 CB 7 CB 8 CB 10 CB 9 CB 11 CB 12 CB 13 CB 14 CB 15 CB 16 CB 17 CB 18 CB 19 CB 20 CB 21 g g g g g g g g g g g g g g g g g g g g Input signal
(fs=16 kHz)
↓2 ↓2 ↓2 ↓2 ↓2 ↓2 ↓2 ↓2 ↓2 ↓2 ↓2 ↓2 ↓2 ↓2 ↓2 ↓2 ↓2 ↓2 ↓2 ↓2 ↓2
↓2 ↓2 ↓2 ↓2 ↓2 ↓2 ↓2 ↓2 ↓2 ↓2 ↓2 ↓2 ↓2 ↓2 ↓2 ↓2 ↓2 ↓2 ↓2
Figure3: The filter bank implementation of the WP tree for fs =
16 kHz.
A(z)
↓M A(zM) ↓M
Figure4: The noble identity for downsampler.
Hence,Eican alternatively be expressed as
Ei=1−2 ωhi
ωli
Hieiω2dω
2π. (25)
Also,Ei ≥ 0. The optimal lowpass QMF is defined as the solution of the following multi-objective function:
hopt[n]=arg min
{h[n]}{E1,E2,E3,...,EN}, (26)
whereh[n] represents all possible wavelet-defining, lowpass QMFs.
This multi-objective optimization problem can be sim-plified however, if we convert it into a conventional single-objective optimization problem using the average of suitably weighted objective functions as the performance measure of optimization. We have used the weighting function of the outer and middle ear (OME) for this purpose. The OME function weights the CB energy errors in the passband such that it is smaller in the mid-frequency regions compared to the low and high frequency regions. Thus, the expression of the single objective performance measure (28), as obtained
below, gives more importance to the perceptually significant mid-frequency region due to OME weighting. A well-known model of the OME transfer functionWdB(f) is given by
WdB
f= −0.6×3.6410−3f−0.8+ 6.5
×exp−0.6×10⁻³f −3.32−10−310−3f4,
(27)
where WdB(f) is the weighting in dB scale as a function of frequency f in Hz [23]. The OME weighting function
WdB(f) is shown as a function of the frequencyf inFigure 7. Now, the single objective performance measure is obtained as
P= 1 N
N
i=1
Eiw(i), (28)
where
w(i)=10WdB(fi) (29)
with fi as the center frequency of the ith critical band. Substituting (25) to (28), the performance measure P can alternately be written as
P= 1 N
N
i=1
1−2 ωhi
ωli
Hieiω2dω
2π
w(i), (30)
and the optimization problem can be restated as
hopt[n]=arg min
h[n]{P}. (31)
Here, P is the performance measure of optimization, and
hopt[n] is the perceptually optimized wavelet-defining QMF. This is a global optimization problem in which h[n] is constrained to satisfy the QMF condition given in (7).
4.3. Lattice QMF Representation and the Unconstrained Optimization Problem. By utilizing the lattice representation of QMF bank [14,15], the constrained optimization problem (31) is converted into an unconstrained one. The use of lattice QMF representation for converting the constrained optimization problem to an unconstrained one can be found in [24], where the authors have used this technique for designing a minimum duration orthonormal wavelet.
It is well known that any FIR two-channel paraunitary QMF bank can be represented by the so-called paraunitary QMF lattice as shown inFigure 8, where the filter pairH(z) andG(z) is written in a matrix form as [14]
⎡ ⎣H(z)
G(z) ⎤
⎦=RJΛz2RJ
−1Λz2· · ·Λz2R0
⎡ ⎣ 1
CB 1
CB 2
CB 3
CB 4
CB 5
CB 6
CB 7
CB 8
CB 10 CB 9
CB 11
CB 12
CB 13
CB 14
CB 15
CB 16
CB 17
CB 18
CB 19
CB 20
CB 21
H1(z)=H(z)H(z2)H(z4)H(z8)H(z16)H(z32)
H2(z)=H(z)H(z2)H(z4)H(z8)H(z16)G(z32)
H3(z)=H(z)H(z2)H(z4)H(z8)G(z16)G(z32)
H4(z)=H(z)H(z2)H(z4)H(z8)G(z16)H(z32)
H5(z)=H(z)H(z2)H(z4)G(z8)G(z16)H(z32)
H6(z)=H(z)H(z2)H(z4)G(z8)G(z16)G(z32)
H7(z)=H(z)H(z2)H(z4)G(z8)H(z16)G(z32)
H8(z)=H(z)H(z2)H(z4)G(z8)H(z16)H(z32)
H9(z)=H(z)H(z2)G(z4)G(z8)H(z16)
H10(z)=H(z)H(z2)G(z4)G(z8)G(z16)
H11(z)=H(z)H(z2)G(z4)H(z8)G(z16)
H12(z)=H(z)H(z2)G(z4)H(z8)H(z16)
H13(z)=H(z)G(z2)G(z4)H(z8)H(z16)
H14(z)=H(z)G(z2)G(z4)H(z8)G(z16)
H15(z)=H(z)G(z2)G(z4)G(z8)
H16(z)=H(z)G(z2)H(z4)G(z8)
H17(z)=H(z)G(z2)H(z4)H(z8)
H18(z)=G(z)G(z2)H(z4)
H19(z)=G(z)G(z2)G(z4)
H20(z)=G(z)H(z2)G(z4)
H21(z)=G(z)H(z2)H(z4)
↓8
↓8
↓8
↓8 ↓16
↓16
↓16 ↓32
↓32
↓32
↓32
↓32
↓32 ↓64
↓64
↓64
↓64
↓64
↓64
↓64
↓64
Input signal
(fs=16 kHz)
Figure5: Equivalent nontree filter structure ofFigure 3.
In (32),Jrelates to the QMF lengthM viaM =2J+ 2 and
Rm, 0≤m≤J, is a 2×2 unitary matrix (i.e.,RT
mRm=I) and
is expressed as
Rm= ⎡
⎣ cosθm sinθm
−sinθm cosθm
⎤
⎦. (33)
The matrixRm is known as Givens rotation withθm as the angle. InFigure 9, the details of the unitary matrixRm are shown. Also, in (32),Λ(z2) is given by
Λz2= ⎡ ⎣1 0
0 z−2 ⎤
⎦. (34)
The filter pair H(z) and G(z) must also satisfy the additional constraint that H(z) is lowpass or, equivalently,
G(z) is highpass
H(1)=1. (35)
The constraint of (35) onh[n] can be transformed to Givens rotations by evaluating (32) forz = 1, that is,ω = 0, and obtained as
θJ+θJ−1+· · ·+θ0= −π
4. (36)
· · · · |HIdeal
1 (ejω)|2
|HIdeal 8 (ejω)|2
|HIdeal 9 (ejω)|2
|HIdeal 14 (ejω)|2
|HIdeal 15 (ejω)|2
|HIdeal 17 (ejω)|2
|HIdeal
18 (ejω)|2 |H21Ideal(ejω)|2
|
H
Id
ea
l
i
(
e
jω)
|
2
25
26
24
23
ω
π/26 7π/268π/265π/259π/255π/246π/247π/24 4π/23 5π/23 7π/23 π
Figure6: Magnitude squared frequency response and passband edges of the CB channel filters for the ideal case.
102 103 104
−20
−15
−10
−5 0 5
Frequency (Hz)
W
eig
hting
(dB)
Figure7: Outer and middle ear transfer functionWdB(f).
· · ·
· · ·
RJ
R0 R1
1 1
−1
z−1 z−2 z−2
H(z)
G(z)
Figure8: The QMF lattice structure ofH(z) andG(z).
can now be expressed as a function of θ0 to θJ−1, and the optimization problem can be posed as an unconstrained global optimization problem as
θ0opt,θ1opt,. . .,θJ−1opt
=arg min
θ0,θ1,...,θJ−1 P
⎛
⎝θ0,θ1,. . .,θJ−1,−π
4 −
J−1
m=0 θm
⎞ ⎠.
(37)
This optimization problem can be solved by using standard unconstrained global optimization program.
cosθm
cosθm
−sinθm
sinθm
Figure9: Details of the unitary matrixRm.
4.4. Bound Constrained Global Optimization. We give a simple approach to solve the optimization problem (37). The search space for the optimal values ofθm,m=0,. . .,J−1, is reduced by exploiting the periodic property of Rm. It is observed from (33) that Givens rotations are periodic functions in 2π, that is,
Rm(θm)=Rm(θm+ 2π). (38)
Thus, instead of searching for a globally optimized solution, the optimal solution of (37) can be obtained by using a bounded value global optimization program where the bounds onθmare 0≤θm≤2π, 0≤m≤J−1.
The solution of the above optimization problem as in (37) is achieved by using multilevel coordinate search (MCS), a “bound constrained global optimization” program [16,
17]. Bound constrained global optimization problem can be formalized as
min f(x)
s.t. x∈[u,v] (39)
Table1: Filter coefficients of the optimal decomposition and reconstruction QMF pair for lengthM=6 andM=8.
n
QMF of length=6 QMF of length=8
Decomposition Reconstruction Decomposition Reconstruction
h[n] g[n] h1[n] g1[n] h[n] g[n] h1[n] g1[n]
0 0.49985 0.11923 0.11923 −0.49985 0.4083 −0.0501 −0.0501 −0.4083
1 0.73350 0.17497 −0.17497 0.73350 0.7608 −0.0934 0.0934 0.7608
2 0.38225 −0.14563 −0.14563 −0.38225 0.4296 0.0631 0.0631 −0.4296
3 −0.14563 −0.38225 0.38225 −0.14563 −0.0668 0.2241 −0.2241 −0.0668
4 −0.17497 0.73350 0.73350 0.17497 −0.2241 −0.0668 −0.0668 0.2241
5 0.11923 −0.49985 0.49985 0.11923 0.0631 −0.4296 0.4296 0.0631
6 0.0934 0.7608 0.7608 −0.0934
7 −0.0501 −0.4083 0.4083 −0.0501
Multiple Coordinate Search (MCS) algorithm as proposed in [16,17]. The MCS method combines both global search and local search into one unified framework via multilevel coordinate search. It is guaranteed to converge if the function is continuous.
The multilevel coordinate search balances between global and local search. The local search is done via sequential quadratic programming. The search in MCS is not exhaus-tive, and thus, the global minimum may be missed. However, in comparison with other global optimization algorithms, MCS shows excellent performance in many cases, especially for smaller dimensions [16].
4.5. Construction of the Optimal Wavelet. After obtaining the optimal solution of (37), the corresponding lowpass QMF is derived from (32). Subsequently, the optimal highpass component of the QMF pair g[n] is obtained from (9). The cascade algorithm is used to solve the basic recursion equation of (5), known as the two-scale equation for the scaling function. This is an iterative algorithm that generates successive approximations toφ(t). The iterations are defined by
φk+1(t)= M−1
n=0
h[n]√2φk(2t−n), (40)
where M is the support of the scaling function, k is the iteration number, andφk+1(t) denotes thekth iteration of the scaling function withφ0(t) being the initial value of iteration. From the scaling function, the waveletψ(t) is obtained by using the two-scale equation for the wavelet as given in (6).
The order of the FIR filter and in turn, the support of the wavelet, is taken into consideration from the temporal resolution of the human auditory system. The time duration of a waveletψ(t) is defined by [25]
Δt= ∞
−∞(t−t0)2ψ(t)2dt ∞
−∞ψ(t)2dt
, (41)
where
t0= ∞
−∞tψ(t)2dt ∞
−∞ψ(t)2dt
. (42)
Here,t0is the first moment of the wavelet and provides the measure of whereψ(t) is centered along the time axis. The time duration of wavelet Δt (41) is the root mean square (RMS) measure of duration and gives the spread of wavelet in time. This definition of time-duration gives a measure of time localization of the wavelet [25].
Now, the above definition of time duration is used for selecting the support of the wavelet. The support of the optimal wavelet is chosen depending on the temporal resolution of human ear. Temporal resolution of the ear refers to its ability to detect changes in stimuli over time [19]. It is usually characterized by the ability to detect a brief gap between two stimuli or to detect the amplitude modulation of a sound [19]. Temporal resolution measured for the detection of gaps in broadband noise is typically 2-3 ms. Further, temporal resolution measured by the discrimination of stimuli with identical magnitude spectra is in the range of 2–6 ms [19]. For our wavelet construction algorithm, we have taken temporal resolution of the human auditory system to be less than 4 ms.
We choose the support of the wavelet so that its time-duration (41) is less than the temporal resolution of the ear, that is, 4 ms. Thus, the proposed wavelet can detect the short duration acoustic stimuli that the ear can perceive. The higher support length of the wavelet will give better frequency selectivity at the critical band channels. The enhanced support length is also associated with increased time-duration of the wavelet.
5. Results
The perceptually optimized wavelet has been obtained using the bound-constrained global optimization program known as multilevel coordinate search (MCS) [16]. The algorithm for construction of the optimal wavelet is implemented in MATLAB. The MATLAB code for MCS algorithm is available at [17]. After obtaining theθmvalues, 0≤θm≤2π, 0≤m≤ J−1,J = (M−2)/2 for the desired support length ofM,
the coefficients of the QMF pair are obtained using (32). The perfect reconstruction QMF pair is obtained from (10). The filter coefficients of decomposition and synthesis QMF bank are shown inTable 1for filter lengthsM=6 and 8. In Figures
0 0.2 0.4 0.6 0.8 0
0.4 0.8 1.2 1.6 2
Normalized frequency (×πrad/sample)
M
ag
nitude
squar
ed
fr
equency
re
sponse
(a)
0 0.2 0.4 0.6 0.8
0 0.4 0.8 1.2 1.6 2
Normalized frequency (×πrad/sample)
M
ag
nitude
squar
ed
fr
equency
re
sponse
(b)
Figure10: Magnitude squared frequency response of the perceptually optimized QMF and Daubechies QMF of lengthM = 8; (a) the perceptually optimized lowpass QMF, (b) Daubechies lowpass QMF.
0 1 2 3 4 5 6 7
−1.5 −1 −0.5 0 0.5 1 1.5
Time wavelet
Perceptually optimized
ψ
(
t
)
(a)
Time Daubechies wavelet
−1 −0.5 0 0.5 1 1.5
ψ
(
t
)
0 1 2 3 4 5 6 7
(b)
Figure11: The perceptually optimized wavelet and Daubechies wavelet of length M = 8; (a) the perceptually optimized wavelet, (b) Daubechies wavelet.
of the optimal lowpass QMF and the corresponding mother wavelet are shown for the case ofM = 8. In Figures10(b)
and11(b), the magnitude squared frequency responses of the Daubechies QMF and the corresponding wavelet are shown for the same value ofMfor comparison.
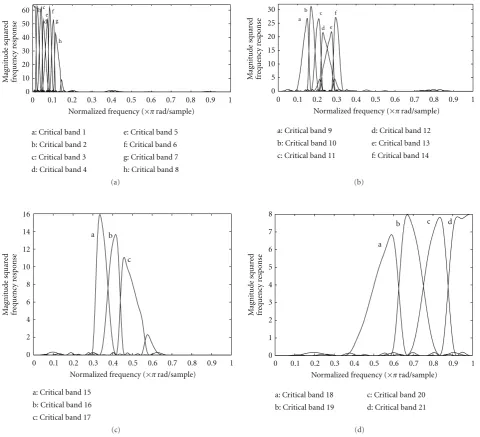
The magnitude squared frequency responses|Hi(eiω)|2
of the CB channel filters are shown in Figure 12 for the
optimal QMF withlength, M = 8. The responses are
grouped in Figures12(a) to 12(d) according to the depth of decomposition of the CB channel filters. The RMS time-duration of this optimal wavelet is found to be 2.8 ms.
0 0.1 0.2 0.3 0.4 0.5 0.6 0.7 0.8 0.9 1 0
10 20 30 40 50 60
Normalized frequency (×πrad/sample)
M
ag
n
itude
squar
ed
fr
equency
response
a: Critical band 1
b: Critical band 2
c: Critical band 3
d: Critical band 4
e: Critical band 5
f: Critical band 6
g: Critical band 7
h: Critical band 8 a
bc
d e f
g
h
(a)
0 0.1 0.2 0.3 0.4 0.5 0.6 0.7 0.8 0.9 1
Normalized frequency (×πrad/sample)
0 5 10 15 20 25 30
a: Critical band 9
b: Critical band 10 c: Critical band 11
d: Critical band 12
e: Critical band 13 f: Critical band 14
M
ag
n
itude
squar
ed
fr
equency
response
f a
b c
d e
(b)
0 2 4 6 8 10 12 14 16
a: Critical band 15 b: Critical band 16
c: Critical band 17
0 0.1 0.2 0.3 0.4 0.5 0.6 0.7 0.8 0.9 1
Normalized frequency (×πrad/sample)
M
ag
n
itude
squar
ed
fr
equency
response
a b
c
(c)
M
ag
n
itude
squar
ed
fr
equency
response
0 0.1 0.2 0.3 0.4 0.5 0.6 0.7 0.8 0.9 1
Normalized frequency (×πrad/sample)
0 1 2 3 4 5 6 7 8
a: Critical band 18
b: Critical band 19
c: Critical band 20
d: Critical band 21 a
b c d
(d)
Figure12: Magnitude squared frequency response of the CB channel filters with perceptually optimized QMF of lengthM=8; (a) critical bands 1 to 8, (b) critical bands 9 to 14, (c) critical bands 15 to 17, (d) critical bands 18 to 21.
from (25) by using Daubechies QMF, Symlet QMF, Coiflet QMF, and the perceptually motivated QMF of lengthM=6.
Figure 14 shows the energy errorEi for Daubechies QMF, Symlet and the perceptually motivated QMF forM=8. The advantage of the perceptually optimized wavelet is clearly visible from the Figures13and14in terms of the reduction in energy error in the CB channel filter impulse responses in comparison to the other wavelets.
Further, it is noticed from Figures 13 and14 that the energy errors in the CB channel filters forM = 8 are less than those forM=6. This is because of the better frequency selectivity of the CB filters for the case with higher support length of the wavelet. The higher support length of the optimal wavelet is also associated with higher time-duration of the wavelet.
6. Conclusions
We have presented a design method for synthesizing a perceptually optimized wavelet that is optimally frequency selective at the critical bands with temporal resolution closely matching with that of human auditory system. The performance measure of the optimization criterion takes into account the critical band structure, the frequency-dependent weighting due to outer and middle ear, and the temporal resolution of human auditory system. The design method is elaborated with an example case of sampling frequency of 16 kHz. The energy error of the CB filter impulse responses,
1 2 3 5 4 6 7 8 9 10121113 14 15171618 19 20 21 0
0.05 0.1 0.15 0.2 0.25 0.3 0.35 0.4 0.45 0.5 0.55 0.6
Critical bands a b c
a: Optimal wavelet based on auditory perception
b: Daubechies wavelet and Symlet c: Coiflet
Er
ro
r
in
passband
energ
y
o
f
the
i
th
CB
filt
er
,
Ei
Figure13: Comparison of CB channel filter passband energy error,
Ei, in the critical bands with the perceptually optimized wavelet,
Daubechies wavelet, Symlet and Coiflet of support lengthM = 6.
0 0.05 0.1 0.15 0.2 0.25 0.3 0.35 0.4 0.45 0.5
a: Optimal wavelet based on auditory perception
b: Daubechies wavelet and Symlet a b
1 2 3 5 4 6 7 8 9 10121113 14 15171618 19 20 21
Critical bands
Er
ro
r
in
p
assband
energ
y
of
the
i
th
CB
filt
er
,
Ei
Figure 14: Comparison of CB channel filter passband energy error, Ei, in the critical bands with the perceptually optimized
wavelet, Daubechies wavelet and Symlet of support lengthM = 8.
Acknowledgments
The authors wish to thank the anonymous reviewers for their constructive comments and suggestions that have improved the paper. The authors would also like to thank the Director, Central Electronics Engineering Research Institute (CEERI)/CSIR, for providing the requisite support for conducting this research work.
References
[1] N. Jayant, J. Johnston, and R. Safranek, “Signal compression based on models of human perception,”Proceedings of the IEEE, vol. 81, no. 10, pp. 1385–1422, 1993.
[2] N. Virag, “Single channel speech enhancement based on masking properties of the human auditory system,” IEEE Transactions on Speech and Audio Processing, vol. 7, no. 2, pp. 126–137, 1999.
[3] M. D. Swanson, B. Zhu, A. H. Tewfik, and L. Boney, “Robust audio watermarking using perceptual masking,”Signal Pro-cessing, vol. 66, no. 3, pp. 337–355, 1998.
[4] D. Sinha and A. H. Tewfik, “Low bit rate transparent audio compression using adapted wavelets,” IEEE Transactions on Signal Processing, vol. 41, no. 12, pp. 3463–3479, 1993. [5] B. Carnero and A. Drygajlo, “Perceptual speech coding and
enhancement using frame-synchronized fast wavelet packet transform algorithms,”IEEE Transactions on Signal Processing, vol. 47, no. 6, pp. 1622–1635, 1999.
[6] S. G. Mallat, “A theory for multiresolution signal decomposi-tion: the wavelet representation,”IEEE Transactions on Pattern Analysis and Machine Intelligence, vol. 11, no. 7, pp. 674–693, 1989.
[7] I. Daubechies, “Orthonormal bases of compactly supported wavelets,”Communications on Pure and Applied Mathematics, vol. 41, no. 7, pp. 909–996, 1988.
[8] O. Rioul and M. Vetterli, “Wavelets and signal processing,” IEEE Signal Processing Magazine, vol. 8, no. 4, pp. 14–38, 1991. [9] I. Pinter, “Perceptual wavelet-representation of speech signals and its application to speech enhancement,”Computer Speech and Language, vol. 10, no. 1, pp. 1–22, 1996.
[10] J. Yao and Y. T. Zhang, “Bionic wavelet transform: a new time-frequency method based on an auditory model,”IEEE Transactions on Biomedical Engineering, vol. 48, no. 8, pp. 856– 863, 2001.
[11] E. Zwicker and H. Fastl, Psychoacoustics: Facts and Models, Springer, New York, NY, USA, 2nd edition, 1999.
[12] E. Zwicker and E. Terhardt, “Analytical expression for critical-band rate and critical critical-bandwidth as a function of frequency,” Journal of the Acoustical Society of America, vol. 68, no. 5, pp. 1523–1525, 1980.
[13] A. Karmakar, A. Kumar, and R. K. Patney, “Design of optimal wavelet packet trees based on auditory perception criterion,” IEEE Signal Processing Letters, vol. 14, no. 4, pp. 240–243, 2007. [14] P. P. Vaidyanathan, Multirate Systems and Filter Banks,
Prentice-Hall, Englewood Cliffs, NJ, USA, 1993.
[15] P. P. Vaidyanathan and P. Q. Hoang, “Lattice structures for optimal design and robust implementation of two-channel perfect reconstruction QMF banks,” IEEE Transactions on Acoustics, Speech, and Signal Processing, vol. 36, no. 1, pp. 81– 94, 1988.
[16] W. Huyer and A. Neumaier, “Global optimization by multi-level coordinate search,”Journal of Global Optimization, vol. 14, no. 4, pp. 331–355, 1999.
[17] “MCS: Global optimization by multilevel coordinate search,” http://www.mat.univie.ac.at/∼neum/software/mcs/.
[18] C. S. Burrus, R. A. Gopinath, and H. Guo,Introduction to Wavelets and Wavelet Transforms, Prentice-Hall, Englewood Cliffs, NJ, USA, 1995.
[19] B. C. J. Moore,An Introduction to the Psychology of Hearing, Academic Press, 4th edition, 1997.
[21] R. R. Coifman and M. V. Wickerhauser, “Entropy-based algorithms for best basis selection,” IEEE Transactions on Information Theory, vol. 38, no. 2, pp. 713–718, 1992. [22] D. B. Percival and A. T. Walden,Wavelet Methods for Time
Series Analysis, Cambridge University Press, Cambridge, UK, 2000.
[23] ITU-R Recommendation BS.1387, “Method for objective measurements of perceived audio quality,” 1998.
[24] J. M. Morris and V. Akunuri, “Minimum duration orthonor-mal wavelets,”Optical Engineering, vol. 35, no. 7, pp. 2079– 2087, 1996.