Estimating Driving Performance Based on
EEG Spectrum Analysis
Chin-Teng Lin
Brain Research Center, University System of Taiwan, Taipei 112, Taiwan
Department of Electrical and Control Engineering, National Chiao-Tung University, Hsinchu 300, Taiwan Email:[email protected]
Ruei-Cheng Wu
Brain Research Center, University System of Taiwan, Taipei 112, Taiwan
Department of Electrical and Control Engineering, National Chiao-Tung University, Hsinchu 300, Taiwan Email:[email protected]
Tzyy-Ping Jung
Institute for Neural Computation, University of California, San Diego, La Jolla, CA 92093-0523, USA Email:[email protected]
Sheng-Fu Liang
Brain Research Center, University System of Taiwan, Taipei 112, Taiwan
Department of Biological Science and Technology, National Chiao-Tung University, Hsinchu 300, Taiwan Email:[email protected]
Teng-Yi Huang
Brain Research Center, University System of Taiwan, Taipei 112, Taiwan
Department of Electrical and Control Engineering, National Chiao-Tung University, Hsinchu 300, Taiwan Email:[email protected]
Received 12 February 2004; Revised 14 March 2005
The growing number of traffic accidents in recent years has become a serious concern to society. Accidents caused by driver’s
drowsiness behind the steering wheel have a high fatality rate because of the marked decline in the driver’s abilities of perception, recognition, and vehicle control abilities while sleepy. Preventing such accidents caused by drowsiness is highly desirable but
re-quires techniques for continuously detecting, estimating, and predicting the level of alertness of drivers and delivering effective
feedbacks to maintain their maximum performance. This paper proposes an EEG-based drowsiness estimation system that com-bines electroencephalogram (EEG) log subband power spectrum, correlation analysis, principal component analysis, and linear regression models to indirectly estimate driver’s drowsiness level in a virtual-reality-based driving simulator. Our results demon-strated that it is feasible to accurately estimate quantitatively driving performance, expressed as deviation between the center of the vehicle and the center of the cruising lane, in a realistic driving simulator.
Keywords and phrases:drowsiness, EEG, power spectrum, correlation analysis, linear regression model.
1. INTRODUCTION
Driving safety has received increasing attention due to the growing number of traffic accidents in recent years. Driver’s fatigue has been implicated as a causal factor in many acci-dents. The National Transportation Safety Board found that 58 percent of 107 single-vehicle roadway departure crashes were fatigue-related in 1995, where the truck driver survived
to drowsiness or fatigue, such as long working hours, lack of sleep, or the use of medication. Besides, another impor-tant factor of drowsiness is the nature of the task, such as monotonous driving on highways. The continued construc-tion of highway and improvement of vehicle equipments have made it effortless for drivers to maneuver and operate their vehicles on the road for hours. An examination of the situations when drowsiness occurred shows that most of the accidents were on highways [4].
A number of methods have been proposed to detect vig-ilance changes in the past. These methods can be categorized into two main approaches. The first approach focuses on physical changes during fatigue, such as the inclination of the driver’s head, sagging posture, and decline in gripping force on steering wheel [7,8,9,10,11,12]. These methods can be further classified as being either contact or else noncontact types in terms of the ways physical changes are measured. The contact type involves the detection of driver’s movement by direct sensor contacts, such as using a cap or eyeglasses or attaching sensors to the driver’s body. The noncontact type makes use of optical sensors or video cameras to detect vig-ilance changes. These methods monitor driving behavior or vehicle operation to detect driver fatigue. Driving behavior includes the steering wheel, accelerator, and brake pedal or transmission shift level, and the operation of vehicle includes the vehicle speed, lateral acceleration, and yaw rate or lateral displacement. Since these parameters vary in different vehicle types and driving conditions, it would be necessary to devise different detection logic for different types of vehicles.
The second approach focuses on measuring physiologi-cal changes of drivers, such as eye activity measures, heart beat rate, skin electric potential, and particularly, electroen-cephalographic (EEG) activities as a means of detecting the cognitive states [13,14,15, 16, 17, 18,19,20,21, 22, 23, 24, 25]. Stern et al. [22, 23] reported that the eye blink duration and blink rate typically increase while blink am-plitude decreases as function of the cumulative time on tasks. Other electrooculographic (EOG) studies have found that saccade frequencies and velocities decline as time on the task increases [24,25]. Recently, Van Orden et al. [14]. further compared the eye-activity-based methods to EEG-based methods for alertness estimates in a compensatory visual tracking task. However, although these eye-activity variables are well correlated with the subject performance, those eye-activity-based methods require a relatively long moving-averaged window aiming to track slow changes in vigilance, whereas the EEG-based method can use a shorter moving-averaged window to track second-to-second fluctu-ations in the subject performance in a visual compensatory task [14,15,16,17,18].
While approaches based on EEG signals have the ad-vantages for making accurate and quantitative judgments of alertness levels, most recent psychophysiological studies have focused on using the same estimator for all subjects [21, 26,27]. These methods did not account for large in-dividual variability in EEG dynamics accompanying loss of alertness, and thus could not accurately estimate or predict individual changes in alertness and performance. In contrast,
Makeig and Inlow used individualized multiple linear regres-sion models to estimate operators’ changing levels of alert-ness [18]. Jung et al. further use the neural network model, applied to EEG power spectrum, in an auditory monitoring task and showed that a continuous, accurate, noninvasive, and near real-time estimation of an operator’s global level of alertness is feasible [15,16].
The scope of the current study is to examine neural ac-tivity correlates of fatigue/drowsiness in a realistic working environment. Our research investigates the feasibility of us-ing multichannel EEG data to estimate and predict nonin-vasively the continuous fluctuations in human global-level alertness indirectly by measuring the driver’s driving perfor-mance expressed as deviation between the center of the ve-hicle and the center of the cruising lane, in a very realistic driving task. To investigate the relationship of minute-scale fluctuations in performance to concurrent changes in the EEG spectrum, we first computed the correlations between changes in EEG power spectrum and the fluctuations in driv-ing performance. We then build an individualized linear re-gression model for each subject applied to principal compo-nents of EEG spectra to assess the EEG dynamics accompa-nying loss of alertness for each operator. This approach can be used to construct and test a portable embedded system for a real-time alertness-monitoring system.
This paper is organized as follows. Section 2 describes the detailed descriptions of the EEG-based drowsiness ex-perimental setup including the virtual-reality-based highway scene, subject instructions, physiological data collection, and alertness measurement. Detailed signal analysis of the col-lected data is given in Section 3. In Section 4, we explore the relationship between the alertness level, expressed as the driving performance, and the EEG power spectrum. Behav-ioral data are used to evaluate estimation performance of our alertness-monitoring model. Finally, we conclude our find-ings inSection 5.
2. EXPERIMENTAL SETUP
2.1. Virtual-reality-based highway
driving simulator
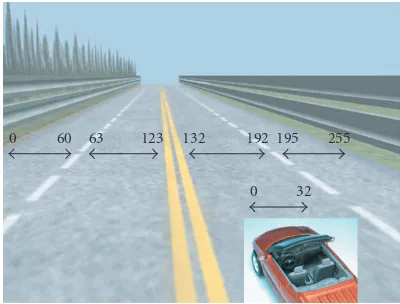
0 60 63 123 132 192 195 255
0 32
Figure1: VR-based highway scene used in our experiments. The distance from the left side to the right side of the road is evenly divided into 256 parts (digitized into values 0–255). The width of each lane is 60 units. The width of the car is 32 units. The refresh rate of highway scene was set properly to emulate a car driving at 100 km/h fixed speed on the highway.
changes interactively as the driver/subject is driving the car at a fixed velocity of 100 km/hr on the highway. The car is constantly and randomly drifted away from the center of the cruising lane, mimicking the consequences of a non-ideal road surface. The highway scene was connected to a 36-channel physiological measuring system, where the EEG, EOG, ECG, and subject’s performance, deviations between the center of the vehicle and the center of the cruising (third) lane, were continuously and simultaneously measured and recorded.
2.2. Subjects
Statistical reports [4] showed that the drowsiest time occurs from late night to early morning, and during the early af-ternoon hours. During these periods, drowsiness often oc-curs within one hour of continuous driving, indicating that drowsiness is not necessarily caused by long driving hours. Thus, the best time for doing the highway-drowsiness simu-lation is the early afternoon hours after lunch because drivers usually get drowsy within an hour of continuous driving. A total of ten subjects (ages from 20 to 40 years) participated in the VR-based highway driving experiments. Each subject completed simulated driving sessions on two separated days. On the first day, these participants were told of the general features of the driving task, completed necessary informed consent material, and then started with a 15 ∼ 45 minute practice to keep the car at the center of the cruising lane by maneuvering the car with the steering wheel. Subjects re-ported this amount of practice to be sufficient to train par-ticipants to asymptote on the task. After practicing, partic-ipants were then prepared with 33 EEG (including 2 EOG) electrodes referenced to the right earlobe based on a modi-fied international 10–20 system, and 2 ECG electrodes placed on the chest. After a brief calibration procedure, subjects be-gan a ∼ 45 minute lane-keeping driving task and his/her EEG signals and driving performance defined as deviations
of the center of the car from the center of the third lane of the road were measured and recorded simultaneously. Par-ticipants returned on a different day to complete the other ∼ 45 min driving session. Participants who demonstrated waves of drowsiness involving two or more microsleeps in both sessions were selected for further analysis. Based on these criteria, five participants (10 sessions) were selected for further modeling and cross-session testing.
2.3. Data collection
During each driving session, 33 EEG/EOG channels (us-ing sintered Ag/AgCl electrodes), 2 ECG channels (bipolar connection), and the deviation between the center of the vehicle and the center of the cruising lane are simultane-ously recorded by the Scan NuAmps Express system (Com-pumedics Ltd., VIC, Australia). Before data acquisition, the contact impedance between EEG electrodes and cortex was calibrated to be less than 5 kΩ. The EEG data were recorded with 16-bit quantization level at a sampling rate of 500 Hz and then resampled down to 250 Hz for the simplicity of data processing.
2.4. Alertness measurement
To find the relationship between the measured EEG signals and the subject’s cognitive state, and to quantify the level of the subject’s alertness, we defined a subject’s driving perfor-mance index as the deviation between the center of the ve-hicle and the center of the cruising lane. When the subject is drowsy (checked from video recordings), the value of driving performance index increases, and vice versa. The recorded driving performance time series were then smoothed using a causal 90-second square moving-averaged filter advancing at 2-second steps to eliminate variance at cycle lengths shorter than 1–2 minutes since the fluctuates of drowsiness level with cycle lengths were in general longer than 4 minutes [15,16].
3. DATA ANALYSIS
EEG Noise removal
Moving-averaged spectral analysis
EEG log
power spectra Correlation analysis
Selected EEG channels
PCA
Selected PCA
components Linear regression
model
Subject’s driving performance
Figure 2: Flowchart for processing the EEG signals. (1) A low-pass filter was used to remove the line noise and higher-frequency
(>50 Hz) noise. (2) Moving-averaged spectral analysis was used to
calculate the EEG log power spectrum of each channel advancing at 2-second steps. (3) Two EEG channels with higher correlation coef-ficients between subject’s driving performance and EEG log power spectrum were further selected. (4) Principal component analysis was trained and used to decompose selected features and extract the representative PCA-components as the input vectors for the linear regression models. (5) The linear regression models were trained in one training session and used to continuously estimate and predict the individual subject’s driving performance in the testing session.
3.1. Moving-averaged power spectral analysis
Moving-averaged spectral analysis of the EEG data as shown in Figure 3was first accomplished using a 750-point Han-ning window with 250-point overlap. Windowed 750-point epochs were further subdivided into several 125-point sub-windows using the Hanning window again with 25-point steps, each extended to 256 points by zero padding for a 256-point FFT. A moving median filter was then used to average and minimize the presence of artifacts in the EEG records of all subwindows. The moving-averaged EEG power tra were further converted into a logarithmic scale for spec-tral correlation and driving performance estimation [28,29]. Thus, the time series of EEG log power spectrum for each ses-sion consisted of 33-channel EEG power spectrum estimated across 40 frequencies (from 1 to 40 Hz) stepping at 2-second (500-point, an epoch) time intervals.
3.2. Correlation analysis
Since alertness level fluctuates with cycle lengths longer than 4 minutes [15,16], we smoothed the EEG power and driving performance time series using a causal 90-second square moving-averaged filter to eliminate variances at cy-cle lengths shorter than 1–2 minutes. To investigate the re-lationship of minute-scale fluctuations in continuous driv-ing performance with concurrent changes in the 33-channel EEG power spectrum over times and subjects, we measured correlations between changes in the EEG log power trum and driving performance as forming a correlation spec-trum by computing thePearson’scorrelation coefficients be-tween two time series at each EEG frequency expressed as Corrxy=((x−x¯)∗(y−y¯))/(x−x¯)2∗(y−y¯)2. The channels with higher correlated coefficients between the EEG log power spectrum and the subject driving performance were further selected (see Section 4.1), and the dimensions
2 s Time 750
250
125 256-pt.
FFT 25
Averaged
Figure3: Block diagram for moving-averaged spectral analysis. The EEG data was first divided using a 750-point Hanning window with 250-point overlap. The 750-point epochs were further divided into several 1point frames using Hanning windows again with 25-point step size, and each frame was applied for a 256-25-point FFT by zero padding. Then the subwindow power spectrum was further averaged and converted to a logarithmic scale to form a log power spectrum.
of selected EEG power spectrum of such channels were re-duced using principal component analysis (PCA) algorithm.
3.3. Feature extraction
selected subjects. The parameters of PCA (eigenvectors) from the training sessions were used to project features in the test-ing sessions so that all data were processed in the same way for the same subject before feeding to the estimation models.
4. RESULTS AND DISCUSSION
4.1. Relationship between the EEG spectrum
and subject alertness
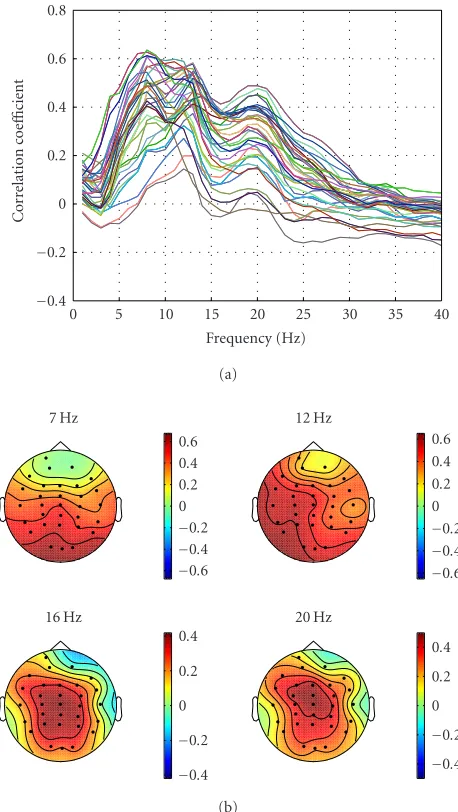
To investigate the relationship of minute-scale fluctuations in driving performance to concurrent changes in the EEG spectrum, we measured correlations between changes in the EEG power spectrum and driving performance by comput-ing the correlation coefficients between the two time series at each EEG frequency. We refer to the results as forming a correlation spectrum. For each EEG site and frequency, we then computed spectral correlations for each session sepa-rately and averaged the results across all 10 sessions from the five subjects. Figure 4a shows the results for 40 fre-quencies between 1 and 40 Hz. Note that the mean correla-tion between performance and EEG power is predominantly positive at all EEG channels below 20 Hz. We also investi-gated the spatial distributions of these positive correlations by plotting the correlations between EEG power spectrum and driving performance, computed separately at dominant frequency bins 7, 12, 16, and 20 Hz (cf. Figure 4a) on the scalp (Figure 4b). As the results inFigure 4ashow, the cor-relation coefficients plotted on the scalp maps are predom-inantly positive. The correlations are particularly strong at central and posterior channels, which are similar to the re-sults of previous studies in the driving experiments [21,26, 27]. The relatively high correlation coefficients of EEG log power spectrum with driving performance suggest that us-ing EEG log power spectrum may be suitable for drowsi-ness (microsleep) estimation, where the subject’s cognitive state might fall into stage one of the nonrapid eye move-ment (NREM) sleep. To be practical for routine use during driving or in other occupations, EEG-based cognitive assess-ment systems should use as few EEG sensors as possible to reduce the preparation time for wiring drivers and compu-tational load for estimating continuously the level of alert-ness in near real time. According to the correlations shown inFigure 4b, we believe it is adequate to use the EEG signals at sites Cz and Pz to assess the alertness level of drivers con-tinuously.
Next, we compared correlation spectra for individual ses-sions to examine the stability of this relationship over time and subjects. Figures5and6plot correlation spectra at sites Fz, Cz, Pz, and Oz of two separate driving sessions for ex-treme cases from Subjects A (best) and B (worst), respec-tively. The relationship between EEG power spectrum and driving performance is stable within the subjects, especially below 20 Hz. However, the relationship is variable from sub-ject to subsub-ject (compare Figures5and6). The time intervals between the training and testing sessions of the lane-keeping experiments ranged from one day to one week long for the selected five subjects.
40 35 30 25 20 15 10 5 0
Frequency (Hz)
−0.4
−0.2 0 0.2 0.4 0.6 0.8
Cor
re
la
ti
o
n
co
e
ffi
cient
(a)
−0.6
−0.4
−0.2 0 0.2 0.4 0.6
−0.6
−0.4
−0.2 0 0.2 0.4 0.6
−0.4
−0.2 0 0.2 0.4
−0.4
−0.2 0 0.2 0.4
7 Hz 12 Hz
16 Hz 20 Hz
(b)
Figure 4: Correlation spectra. Correlations between EEG power and driving performance, computed separately for 40 EEG frequen-cies between 1 and 40 Hz. (a) Grand mean correlation spectra for 10 sessions on 5 subjects. (b) Scalp topographies of the correlations at dominant frequencies at 7, 12, 16, and 20 Hz.
40 30
20 10
0
Frequency (Hz)
−0.5 0 0.5 1
Cor
re
la
ti
o
n
co
e
ffi
cient
Run 1 Run 2
(a)
40 30
20 10
0
Frequency (Hz)
−0.5 0 0.5 1
Cor
re
la
ti
o
n
co
e
ffi
cient
Run 1 Run 2
(b)
40 30
20 10
0
Frequency (Hz)
−0.5 0 0.5 1
Cor
re
la
ti
o
n
co
e
ffi
cient
Run 1 Run 2
(c)
40 30
20 10
0
Frequency (Hz)
−1
−0.5 0 0.5 1
Cor
re
la
ti
o
n
co
e
ffi
cient
Run 1 Run 2
(d)
Figure5: Correlation spectra between the EEG power spectrum and the driving performance at (a) Fz, (b) Cz, (c) Pz, and (d) Oz channels in two separate driving sessions for Subject A (best case). Note that the relationship between the EEG power spectrum and the driving performance is stable within this subject.
4.2. EEG-based driving performance
estimation/prediction
In order to estimate/predict the subject’s driving perfor-mance based on the information available in the EEG power spectrum at sites Cz and Pz, a 50-order linear regression model y = N=50
i=1 aixi +a0 with a least-square-error cost function is used, whereyis the desired output,xis the input feature,Nis the order (N =50 in this case),ai’s are the pa-rameters, anda0=1 is the constant. We used only two EEG channels (Cz and Pz) that showed the highest correlation be-tween the EEG power spectrum and the driving performance because using all 33 channels may introduce more unex-pected noise.Figure 7plots the estimated and actual driving
40 30
20 10
0
Frequency (Hz)
−0.6
−0.4
−0.2 0 0.2 0.4 0.6 0.8
Cor
re
la
ti
o
n
co
e
ffi
cient
Run 1 Run 2
(a)
40 30
20 10
0
Frequency (Hz)
−0.5 0 0.5 1
Cor
re
la
ti
o
n
co
e
ffi
cient
Run 1 Run 2
(b)
40 30
20 10
0
Frequency (Hz)
−0.5 0 0.5 1
Cor
re
la
ti
o
n
co
e
ffi
cient
Run 1 Run 2
(c)
40 30
20 10
0
Frequency (Hz)
−1
−0.5 0 0.5 1
Cor
re
la
ti
o
n
co
e
ffi
cient
Run 1 Run 2
(d)
Figure6: Correlation spectra between the EEG power spectrum and the driving performance at (a) Fz, (b) Cz, (c) Pz, and (d) Oz channels in two separate driving sessions for Subject B (worst case). Note that the relationship between the EEG power spectrum and the driving performance is stable within this subject, especially below 20 Hz. However, the relationship is variable from subject to subject (compare
Figures5and6).
performance estimation using a small number of data channels is feasible, and can give accurate information about minute-to-minute changes in operator alertness.
5. CONCLUSIONS
In this study, we demonstrated a close relationship be-tween minute-scale changes in driving performance and the EEG power spectrum. This relationship appears sta-ble within individuals across sessions, but is somewhat variable between subjects. We also combined EEG power
2500 2000 1500 1000 500
0
Time (s) 0
10 20 30 40 50 60 70 80 90 100
Dr
iv
ing
er
ro
r
Actual deviation Estimated deviation
Figure7: Driving performance estimates for a session of Subject A, based on a linear regression (dashed line) of PCA-reduced EEG log spectra at two scalp sites, overplotted against actual driving perfor-mance time series for the session (solid line). The correlation
coef-ficient between the two time series isr=0.88.
2500 2000
1500 1000
500 0
Time (s) 0
20 40 60 80 100 120
Dr
iv
ing
er
ro
r
Actual deviation Estimated deviation
Figure8: Driving performance estimates for a test session, based on a linear regression (dashed line) of PCA-reduced EEG log spectra from a separate training session of the same subject, overplotted against actual driving performance time series of the test session
(solid line). The correlation coefficient between the two time series
isr=0.7. Note that the training and testing data in this study were
completely disjoined.
channels of EEG data. Once an estimator has been developed for each driver, based on limited pilot testing, the method uses only spontaneous EEG signals from the individual, and does not require further collection or analysis of operator performance. The proposed methods thus might be used to construct and test a portable embedded system for a real-time alertness-monitoring system.
ACKNOWLEDGMENTS
The authors would like to thank Mrs. Jeng-Ren Duann, Chun-Fei Hsu, Wen-Hung Chao, Yu-Chieh Chen, Kuan-Chih Huang, Shih-Cheng Guo, and Yu-Jie Chen for their great help in developing and operating the experiments. This work was supported in part by the Ministry of Education, Taiwan, under Grant EX-91-E-FAOE-4-4 and Ministry of Economic Affairs, Taiwan, under Grant 93-17-A-02-S1-032 to C. T. Lin and associates and a Grant from Swartz Founda-tion to T. P. Jung.
REFERENCES
[1] J. French, “A model to predict fatigue degraded performance,” inProc. IEEE 7th Conference on Human Factors and Power Plants, vol. 4, pp. 6–9, Scottsdate, Ariz, USA, September 2002. [2] W. W. Wierwille, S. S. Wreggit, and R. R. Knipling, “Develop-ment of improved algorithms for on-line detection of driver
drowsiness,” inProc. Convergence ’94, International Congress
on Transportation Electronics, SAE (Society of Automotive En-gineers), pp. 331–340, Detroit, Mich, USA, October 1994. [3] A. Amditis, A. Polychronopoulos, E. Bekiaris, and P. C.
An-tonello, “System architecture of a driver’s monitoring and
hy-povigilance warning system,” inProc. IEEE Intelligent Vehicle
Symposium (IV ’02), vol. 2, pp. 527–532, Versailles, France, June 2002.
[4] H. Ueno, M. Kaneda, and M. Tsukino, “Development of
drowsiness detection system,” inProc. Vehicle Navigation and
Information Systems Conference (VNIS ’94), pp. 15–20, Yoko-hama, Japan, August–September 1994.
[5] R. Grace, V. E. Byrne, D. M. Bierman, et al., “A drowsy driver
detection system for heavy vehicles,” inProc. AIAA/IEEE/SAE
17th Conference on Digital Avionics Systems (DASC ’98), vol. 2, pp. I36/1–I36/8, Bellevue, Wash, USA, October–November 1998.
[6] T. Pilutti and A. G. Ulsoy, “Identification of driver state for
lane-keeping tasks,”IEEE Trans. Syst., Man, Cybern. A, vol. 29,
no. 5, pp. 486–502, 1999.
[7] P. Smith, M. Shah, and N. da Vitoria Lobo, “Monitor-ing head/eye motion for driver alertness with one camera,” inProc.15th International Conference on Pattern Recognition (ICPR ’00), vol. 4, pp. 636–642, Barcelona, Spain, September 2000.
[8] C. M. Frederick-Recascino and M. Hilscher, “Monitoring
au-tomated displays: effects of and solutions for boredom,” in
Proc. 20th Conference of Digital Avionics Systems (DASC ’01), vol. 1, pp. 5D3/1–5D3/5, Daytona Beach, Fla, USA, October 2001.
[9] G. Kaefer, G. Prochart, and R. Weiss, “Wearable alertness
monitoring for industrial applications,” inProc. 7th IEEE
In-ternational Symposium on Wearable Computers (ISWC ’03), pp. 254–255, White Plains, NY, USA, October 2003.
[10] K. B. Khalifa, M. H. Bedoui, R. Raytchev, and M. Dogui, “A
portable device for alertness detection,” inProc. 1st Annual
In-ternational IEEE-EMBS Special Topic Conference on Microtech-nologies in Medicine & Biology, pp. 584–586, Lyon, France, Oc-tober 2000.
[11] C. A. Perez, A. Palma, C. A. Holzmann, and C. Pena, “Face and eye tracking algorithm based on digital image processing,” in
Proc. IEEE International Conference on Systems, Man, and Cy-bernetics (SMC ’01), vol. 2, pp. 1178–1183, Tucson, Ariz, USA, October 2001.
[12] J. C. Popieul, P. Simon, and P. Loslever, “Using driver’s head
International Intelligent Vehicles Symposium (IV ’03), pp. 616– 621, Columbus, Ohio, USA, June 2003.
[13] T. L. Morris and J. C. Miller, “Electrooculographic and
perfor-mance indices of fatigue during simulated flight,”Biological
Psychology, vol. 42, no. 3, pp. 343–360, 1996.
[14] K. Van Orden, W. Limbert, S. Makeig, and T.-P. Jung, “Eye activity correlates of workload during a visualspatial memory
task,”Human Factors, vol. 43, no. 1, pp. 111–121, 2001.
[15] T.-P. Jung, S. Makeig, M. Stensmo, and T. J. Sejnowski,
“Esti-mating alertness from the EEG power spectrum,”IEEE Trans.
Biomed. Eng., vol. 44, no. 1, pp. 60–69, 1997.
[16] S. Makeig and T.-P. Jung, “Changes in alertness are a principal
component of variance in the EEG spectrum,”Neuroreport,
vol. 7, no. 1, pp. 213–216, 1995.
[17] M. Matousek and I. Peters´en, “A method for assessing
alert-ness fluctuations from EEG spectra,”Electroencephalography
and Clinical Neurophysiology, vol. 55, no. 1, pp. 108–113, 1983.
[18] S. Makeig and M. Inlow, “Lapses in alertness: coherence of
fluctuations in performance and EEG spectrum,”
Electroen-cephalography and Clinical Neurophysiology, vol. 86, no. 1, pp. 23–35, 1993.
[19] J. Qiang, Z. Zhiwei, and P. Lan, “Real-time nonintrusive
mon-itoring and prediction of driver fatigue,” IEEE Trans. Veh.
Technol., vol. 53, no. 4, pp. 1052–1068, 2004.
[20] S. Makeig and T.-P. Jung, “Tonic, phasic, and transient EEG
correlates of auditory awareness in drowsiness,” Cognitive
Brain Research, vol. 4, no. 1, pp. 15–25, 1996.
[21] S. Roberts, I. Rezek, R. Everson, H. Stone, S. Wilson, and C. Alford, “Automated assessment of vigilance using
com-mittees of radial basis function analysers,”IEE Proceedings–
ScienceMeasurement & Technology, vol. 147, no. 6, pp. 333– 338, 2000.
[22] J. A. Stern, D. Boyer, and D. Schroeder, “Blink rate: a possible
measure of fatigue,”Human Factors, vol. 36, no. 2, pp. 285–
297, 1994.
[23] J. A. Stern, L. C. Walrath, and R. Goldstein, “The endogenous
eyeblink,”Psychophysiology, vol. 21, no. 1, pp. 22–33, 1984.
[24] D. Schmidt, L. A. Abel, L. F. Dell’Osso, and R. B. Daroff,
“Sac-cadic velocity characteristics: intrinsic variability and fatigue,”
Aviation, Space and Environmental Medicine, vol. 50, no. 4, pp. 393–395, 1979.
[25] D. K. McGregor and J. A. Stern, “Time on task and blink
ef-fects on saccade duration,”Ergonomics, vol. 39, no. 4, pp. 649–
660, 1996.
[26] B. J. Wilson and T. D. Bracewell, “Alertness monitor using
neural networks for EEG analysis,” inProc. IEEE Signal
Pro-cessing Society Workshop on Neural Networks for Signal Process-ing X, vol. 2, pp. 814–820, Sydney, NSW, Australia, December 2000.
[27] P. Parikh and E. Micheli-Tzanakou, “Detecting drowsiness
while driving using wavelet transform,” inProc. IEEE 30th
Annual Northeast on Bioengineering Conference, pp. 79–80, Boston, Mass, USA, April 2004.
[28] M. Steriade, “Central core modulation of spontaneous oscil-lations and sensory transmission in thalamocortical systems,”
Current Opinion in Neurobiology, vol. 3, no. 4, pp. 619–625, 1993.
[29] M. Treisman, “Temporal rhythms and cerebral rhythms,” in
Timing and Time Perception, J. Gibbon and L. Allen, Eds., vol. 423, pp. 542–565, New York Academy of Sciences, New York, NY, USA, 1984.
[30] S. Chatterjee and A. S. Hadi, “Influential observations, high
leverage points, and outliers in linear regression,”Statistical
Science, vol. 1, no. 3, pp. 379–416, 1986.
[31] C. M. Bishop,Neural Networks for Pattern Recognition, Oxford
University Press, Oxford, UK, 1995.
Chin-Teng Lin received the B.S. degree from the National Chiao-Tung University (NCTU), Taiwan, in 1986, and the Ph.D. degree in electrical engineering from Pur-due University, USA, in 1992. He is cur-rently the Chair Professor and Associate Dean of the College of Electrical Engineer-ing and Computer Science, and Director of the Brain Research Center at NCTU. He is
the author ofNeural Fuzzy Systems
(Pren-tice Hall). He has published about 90 journal papers includ-ing over 65 IEEE journal papers. He is an IEEE Fellow for his contributions to biologically inspired information systems. He serves on Board of Governors at the IEEE CAS and SMC Soci-eties now. He has been the President of Asia Pacific Neural Net-work Assembly since 2004. He has received the Outstanding Re-search Award granted by the National Science Council, Taiwan, since 1997 to present, received the Outstanding Engineering Pro-fessor Award granted by the Chinese Institute of Engineering (CIE) in 2000, and the 2002 Taiwan Outstanding Information-Technology Expert Award. He was also elected to be one of the 38th Ten Outstanding Rising Stars in Taiwan (2000). He currently serves as an Associate Editor of the IEEE Transactions on Cir-cuits and Systems, Part I & Part II, IEEE Transactions on Systems, Man, Cybernetics, IEEE Transactions on Fuzzy Systems, and so forth.
Ruei-Cheng Wu received the B.S. degree in nuclear engineering from the National Tsing-Hua University, Taiwan, in 1995, and the M.S. degree in control engineering from the National Chiao-Tung University, Tai-wan, in 1997. He is currently pursuing the Ph.D. degree in electrical and control en-gineering at the National Chiao-Tung Uni-versity, Taiwan. His current research inter-ests are biomedical signal processing,
mul-timedia signal processing, fuzzy neural networks, and linear con-trol.
Tzyy-Ping Jungreceived the B.S. degree in electronics engineering from the National Chiao Tung University, Taiwan, in 1984, and the M.S. and Ph.D. degrees in electrical en-gineering from The Ohio State University in 1989 and 1993, respectively. He was a Re-search Associate at the National ReRe-search Council of the National Academy of Sci-ences and at the Computational Neurobi-ology Laboratory, The Salk Institute, San
Sheng-Fu Liangwas born in Tainan, Tai-wan, in 1971. He received the B.S. and M.S. degrees in control engineering from the Na-tional Chiao-Tung University (NCTU), Tai-wan, in 1994 and 1996, respectively. He re-ceived the Ph.D. degree in electrical and control engineering from NCTU in 2000. From 2001 to 2005, he was a Research Assis-tant Professor in electrical and control engi-neering, NCTU. In 2005, he joined the
De-partment of Biological Science and Technology, NCTU, where he serves as an Assistant Professor. He has also served as the Chief Executive of the Brain Research Center, NCTU Branch, University System of Taiwan, since September 2003. His current research in-terests are biomedical engineering, biomedical signal/image pro-cessing, machine learning, fuzzy neural networks (FNN), the devel-opment of brain-computer interface (BCI), and multimedia signal processing.