• No results found

The Astrophysics of Strongly Interacting Systems

N/A
N/A
Protected

Academic year: 2020

Share "The Astrophysics of Strongly Interacting Systems"

Copied!
232
0
0

Loading.... (view fulltext now)

Full text

Figure

Figure 1.1: Cosmological probes and their length scales [1]: This figure shows the amplitude of the densityfluctuations in the Universe vs length scale, along with the cosmological probes that provided the information.The blue line is the prediction of ΛCDM.1
Figure 2.1:Sterile neutrino DM parameter space: shaded regions are consistent with the X-ray signal at1, 2, and 3 σ
Figure 3.2: Asymmetry potential V L per unit unscaled mu lepton asymmetry. Solid line shows the effect ofredistribution using a combination of perturbative QCD, lattice calculations and the HRG approximation.Dashed line shows the result using Stefan-Boltzma
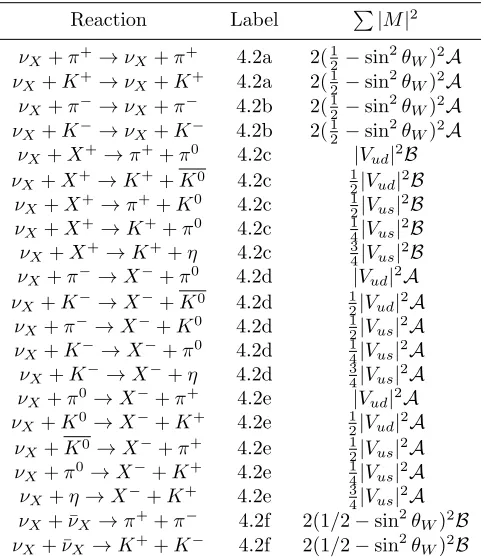
Table 4.1:Matrix elements of reactions involving a neutrino νX. Listed above are the moduli squaredmultiplied with the appropriate symmetry factors and color degeneracy factors to be included in collisionintegrals, for the diagrams shown in Figure 4.1
+7

References

Related documents