Transactions, SMiRT-23
Manchester, United Kingdom - August 10-14, 2015 Division V, Paper ID 738
A Case Study on the Effect of Detailed 3D Finite Element Modelling on
Nuclear Power Plant Building Response
Todd Radford1, Stéphane Damolini1, and John O’Sullivan2
1 Senior Structural Engineer, Stevenson & Associates, USA
2 Senior Structural Consultant, Stevenson & Associates, USA
ABSTRACT
Seismic probabilistic risk assessment for nuclear power plants requires detailed fragility evaluation for components and systems in the plant. An essential element of this process is the accurate development of seismic demand based on realistic building response. Lumped mass stick models that have been previously developed for design and analysis purposes may not realistically local and high-frequency modes that could impact component fragilities. This is compounded by the fact that recently developed Uniform Hazard Response Spectra (UHRS) for nuclear power plant sites in the Central and Eastern United States (CEUS) indicate strong ground motion can occur across a broad frequency range. Of particular interest is response estimation for high-frequency motion that was not considered for original design.
In this paper, building response is evaluated for a representative PWR control building. The building, which consists of reinforced concrete outer walls and a structural steel internal structure, is modelled both as a lumped mass stick model and as a detailed 3D finite element model. The building responses for the two models are compared through an evaluation of modal response and frequency response functions. Differences in the responses are linked to the flexibility of the columns, walls, and slabs, and the realistic distribution of stiffness and mass, which are not considered in the lumped mass stick model. The potential effects of these differences on building response and fragility analysis are discussed.
INTRODUCTION
Seismic risk evaluation has become a standard tool in the evaluation of nuclear power plants. The use of PRA for risk-informed decision-making is currently encouraged by the US Nuclear Regulatory Commission [USNRC (2000)] and is a recommended path for evaluating seismic risk in the SPID [EPRI (2013)] in response to the US NRC request for information pursuant to NTTF Recommendation 2.1 [USNRC (2012)]. One of the major tasks in seismic PRA is the development of seismic fragilities for individual plant structures, systems, and components. The development of a seismic fragility for each SSC is based on a detailed assessment of the capacity of a component in relation to the imposed seismic demand.
The seismic demand for a given component is typically taken from In-Structure Response Spectra (ISRS). The ISRS are developed using building response analysis which can include soil-structure interaction effects if warranted. The building model used in the building response analysis can vary in complexity from a simple lumped-mass stick model (LMSM) to a finely-meshed 3D finite element model (FEM). The model must provide accurate response for the fragility evaluation, and the level of complexity required to ensure accurate response may depend on a combination of the nature of the site, the nature and geometry of the building structure, and the nature of the seismic input. It is important to understand how and when increased complexity, and the corresponding increased modelling and analysis effort, will improve accuracy.
considered reasonable for the original dynamic evaluation of the plant structures considering the shapes of most design-basis response spectra. However, developing detailed seismic fragilities can require more detailed seismic response than was considered in the past, and newly developed probabilistic-based ground motion response spectra can show significantly different shapes than considered in the past for design-basis. Figure 1 shows a comparison between an example GMRS [USNRC (2014)] and a RG 1.60 [USNRC (1973)] design-basis RS. It can be seen that the shape and frequency content can vary significantly.
Figure 1: Comparison of example GMRS and RG 1.60 RS.
To better understand the differences between LMSM and FEM, a case study is performed on a typical building from a US nuclear power plant. Modal results and frequency response functions are generated and compared to evaluate the accuracy of the two types of models.
BUILDING MODELS
The subject of this case study is a Control Building from a US nuclear power plant. The building has plan dimensions of 140.5’ x 84’ and an overall height of 93’ above the foundation. The foundation consists of approximately 50’ of concrete fill down to bedrock. The structure includes an external concrete shear wall and an internal steel-frame. The building has six major floor elevations above the foundation level with the Relay Room located at 24’ above the foundation and the Control Room located 51’ above the foundation. Major dimensions, elevations, and a gridline layout for the Control Building steel structure are shown in Figure 2.
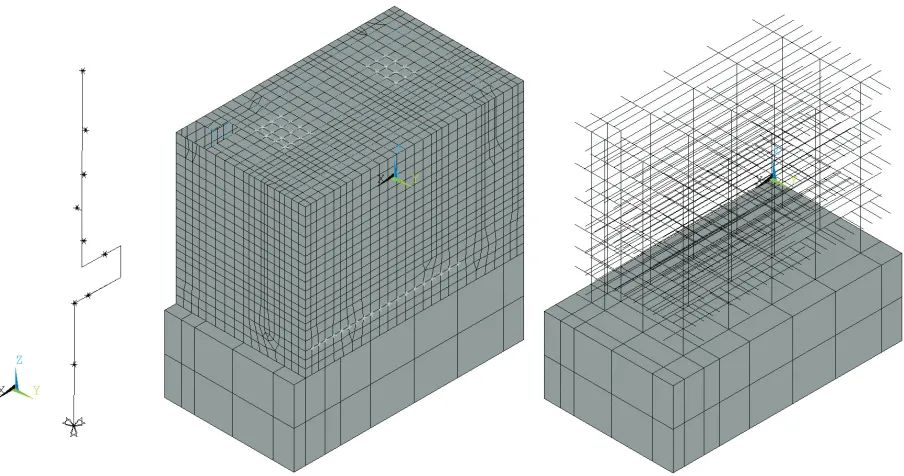
The LMSM and FEM models are shown in Figure 3. For the LMSM, lumped mass and stiffness properties were developed based on the building layout and material properties. The geometry of the model incorporates calculated centers of mass and stiffness and the bending properties of the model are adjusted to account shear lag effects. A fixed-base is considered at the base of the concrete fill foundation, which is modelled with appropriate elements and masses. Floor flexibility and slab modes are not considered in the LMSM.
23rdConference on Structural Mechanics in Reactor Technology Manchester, United Kingdom - August 10-14, 2015 Division V
Figure 2: Control Building Plan and Section.
LMSM FEM Showing External Shear Wall FEM Showing Internal Steel Frame
Division V
MODAL ANALYSIS
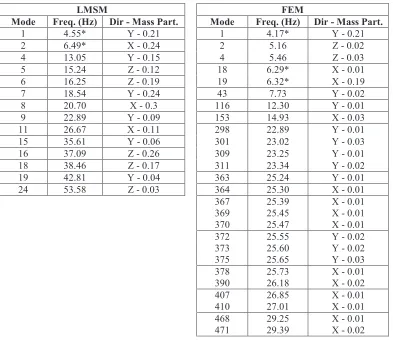
For both the LMSM and FEM models, a modal analysis is performed using Block Lanczos mode-extraction with a cut-off frequency of 60Hz. Significant modes are given in Table 1 based on a minimum mass participation fraction in one direction of 0.02 for the LMSM and 0.01 for the FEM. Modes are listed with the mode number, frequency, and primary direction of mass participation. Modes for the FEM have been grouped into similar adjacent modes based on frequency and primary direction.
Table 1: Significant Modes for LMSM and FEM Models.
LMSM FEM
Mode Freq. (Hz) Dir - Mass Part. Mode Freq. (Hz) Dir - Mass Part.
1 4.55* Y - 0.21 1 4.17* Y - 0.21
2 6.49* X - 0.24 2 5.16 Z - 0.02
4 13.05 Y - 0.15 4 5.46 Z - 0.03
5 15.24 Z - 0.12 18 6.29* X - 0.01
6 16.25 Z - 0.19 19 6.32* X - 0.19
7 18.54 Y - 0.24 43 7.73 Y - 0.02
8 20.70 X - 0.3 116 12.30 Y - 0.01
9 22.89 Y - 0.09 153 14.93 X - 0.03
11 26.67 X - 0.11 298 22.89 Y - 0.01
15 35.61 Y - 0.06 301 23.02 Y - 0.03
16 37.09 Z - 0.26 309 23.25 Y - 0.01
18 38.46 Z - 0.17 311 23.34 Y - 0.02
19 42.81 Y - 0.04 363 25.24 Y - 0.01
24 53.58 Z - 0.03 364 25.30 X - 0.01
367 25.39 X - 0.01
369 25.45 X - 0.01
370 25.47 X - 0.01
372 25.55 Y - 0.02
373 25.60 Y - 0.02
375 25.65 Y - 0.03
378 25.73 X - 0.01
390 26.18 X - 0.02
407 26.85 X - 0.01
410 27.01 X - 0.01
468 29.25 X - 0.01
471 29.39 X - 0.02
It can be seen from the results presented in Table 1 that the primary horizontal modes, indicated with *, have similar frequencies and mass participations. With the exception of the first horizontal modes, there is no obvious correlation between the modal results of the two models.
FREQUENCY RESPONSE FUNCTIONS
23rdConference on Structural Mechanics in Reactor Technology Manchester, United Kingdom - August 10-14, 2015 Division V
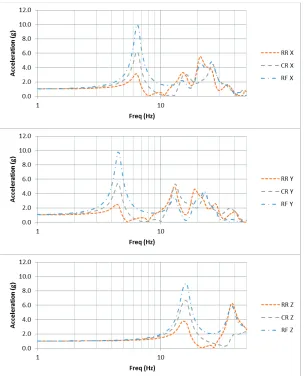
For the LMSM, acceleration frequency response functions are developed for each of the X, Y, and Z directions at the Relay Room (RR), Control Room (CR), and Roof (RF). Frequency response functions for the LMSM are plotted in Figure 4.
Figure 4: LMSM Frequency Response Functions.
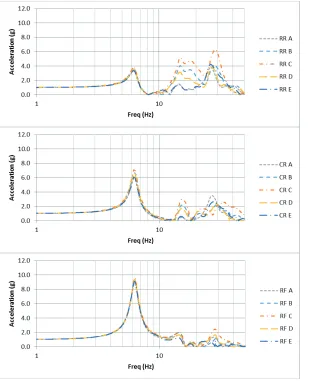
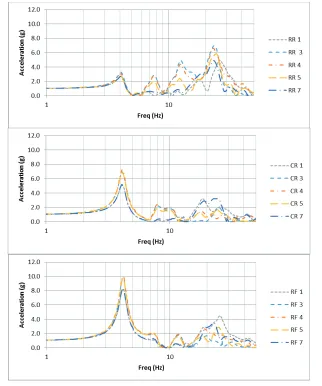
Figure 5: FEM X-Direction Frequency Response Functions.
A comparison of the direction frequency response functions for the FEM in Figure 5 to the X-direction frequency response functions in Figure 4 shows a consistent frequency and amplification for the first mode and a relatively consistent magnitude of amplification at higher frequencies. In addition, both models show that the greatest amplifications at the lower elevation of the Relay Room (RR) occur at frequencies higher than the first mode. At the same time, however, it can be clearly seen that the frequencies of all modes above the first are distinctly different between the two models.
23rdConference on Structural Mechanics in Reactor Technology Manchester, United Kingdom - August 10-14, 2015 Division V
Figure 6: FEM Y-Direction Frequency Response Functions.
A comparison of the direction frequency response functions for the FEM in Figure 6 to the Y-direction frequency response functions in Figure 4 shows very similar results to the X-Y-direction comparison, with the only major difference being the presence of high-freqency amplification at low elevation in the FEM model that is greater than that seen in the LMSM.
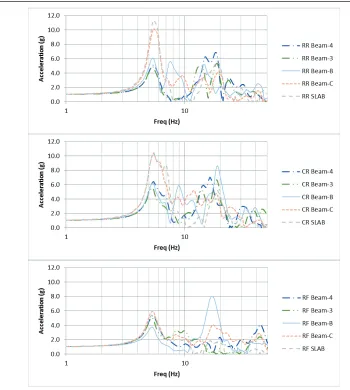
Figure 7: FEM Z-Direction Beam and Slab Frequency Response Functions.
23rdConference on Structural Mechanics in Reactor Technology Manchester, United Kingdom - August 10-14, 2015 Division V
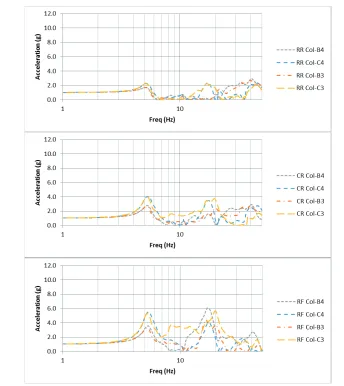
Figure 8: FEM Z-Direction Column Frequency Response Functions.
At frequencies above the first mode, the FEM frequency response functions indicate that the reponse is dominated by local modes, as there is limited corelation between elevations and nodes. It can be noted that the FEM indicates very little amplification at frequencies above 20 Hz, while the LMSM second mode occurs at around 37 Hz and includes significant amplification.
CONCLUSIONS
The results of this case study indicate a number of situations where the modelled structural response of a nuclear power plant building may vary significantly depending on whether a lumped mass stick model or a 3D finite element model is used.
For horizontal response, the LMSM provides accurate response for the first mode. However, it does not accurately model higher-frequency modes, likely due to the flexibility of the internal structure and slabs which cannot be accounted for by the LMSM. In particular, in-plane flexibility of the slab is shown to amplify the high-frequency response for the subject building. Differences in the higher frequency modes could lead to significantly different final response depending on the nature and shape of the seismic input response spectra.
Division V
be very difficult to predict and model the internal structure mode that is seen in the FEM. At the same time, while the LMSM misses the low frequency response, it also yields large high-frequency amplification that is not present in the FEM.
The results seen in this case study are specific to the selected structure, which has a stiff external shear wall and a more flexible internal steel structure. While the conclusions may not be applicable to all structures, especially stiff shear wall structures with small aspect ratios, they can be considered applicable to structures that do not have consistently high stiffness across their entire plan area.
REFERENCES
Electric Power Research Institute. (2013). Report 1025287 - Seismic Evaluation Guidance: Screening,
Prioritization and Implementation Details (SPID) for the Resolution of Fukushima Near-Term Task Force Recommendation 2.1: Seismic.
US Nuclear Regulatory Commission. (1973). Regulatory Guide 1.60 Revision 1 - Design Response
Spectra for Seismic Design of Nuclear Power Plants.
US Nuclear Regulatory Commission. (2000) Risk-Informed Regulation Implementation Plan.
US Nuclear Regulatory Commission. (2012) Letter to All Power Reactor Licensees et al., “Request for Information Pursuant to Title 10 of the Code of Federal Regulations 50.54(f) Regarding Recommendations 2.1, 2.3 and 9.3 of the Near-Term Task Force Review of Insights from the Fukushima Dai-Ichi Accident.” March 12, 2012.
US Nuclear Regulatory Commission. (2014) Memo to Public, “Support Document for Screening and