Volume 2009, Article ID 837601,16pages doi:10.1155/2009/837601
Research Article
Network Anomaly Detection Based on Wavelet Analysis
Wei Lu and Ali A. Ghorbani
Information Security Center of Excellence, The University of New Brunswick, Fredericton, NB, Canada E3B 5A3
Correspondence should be addressed to Wei Lu,[email protected]
Received 1 September 2007; Revised 3 April 2008; Accepted 2 June 2008
Recommended by Chin-Tser Huang
Signal processing techniques have been applied recently for analyzing and detecting network anomalies due to their potential to find novel or unknown intrusions. In this paper, we propose a new network signal modelling technique for detecting network anomalies, combining the wavelet approximation and system identification theory. In order to characterize network traffic behaviors, we present fifteen features and use them as the input signals in our system. We then evaluate our approach with the 1999 DARPA intrusion detection dataset and conduct a comprehensive analysis of the intrusions in the dataset. Evaluation results show that the approach achieves high-detection rates in terms of both attack instances and attack types. Furthermore, we conduct a full day’s evaluation in a real large-scale WiFi ISP network where five attack types are successfully detected from over 30 millions flows.
Copyright © 2009 W. Lu and A. A. Ghorbani. This is an open access article distributed under the Creative Commons Attribution License, which permits unrestricted use, distribution, and reproduction in any medium, provided the original work is properly cited.
1. Introduction
Intrusion detection has been extensively studied since the seminal report written by Anderson [1]. Traditionally, intru-sion detection techniques are classified into two categories: misuse detection and anomaly detection. Misuse detection is based on the assumption that most attacks leave a set of signatures in the stream of network packets or in audit trails, and thus attacks are detectable if these signatures can be identified by analyzing the audit trails or network traffic behaviors. However, misuse detection approaches are strictly limited to the latest known attacks. How to detect new attacks or variants of known attacks is one of the biggest challenges faced by misuse detection.
To address the weakness of misuse detection, the concept of anomaly detection was formalized in the seminal report of Denning [2]. Denning assumed that security violations could be detected by inspecting abnormal system usage patterns from the audit data. As a result, most anomaly detection techniques attempt to establish normal activity profiles by computing various metrics and an intrusion is detected when the actual system behavior deviates from the normal profiles. According to the characteristics of the monitored sources, anomaly detection can be classified into host-based and network-based. Typically, a host-based anomaly detection system runs on a local monitored host and uses its log files or
audit trail data as information sources. The major limitation of host-based anomaly detection is its capability to detect distributed and coordinated attacks that show patterns in the network traffic. In contrast, network-based anomaly detec-tion aims at protecting the entire networks against intrusions by monitoring the network traffic either on designed hosts or specific sensors and thus can protect simultaneously a large number of computers running different operating systems against remote attacks such as port scans, distributed denial-of-service attacks, propagation of computer worms, which stand for a major threat to current Internet infrastructure. As a result, we restrict our focus to network anomaly detection in this paper.
According to Axelsson, the early network anomaly detec-tion systems are self-learning, that is, they automatically formed an opinion of what the subject’s normal behav-ior is [3]. Such self-learning techniques include the early statistical model-based anomaly detection approaches [4–
Packets
flows Feature based featuresNetwork flow Residuals or normalIntrusion analysis
Normal daily traffic model (wavelet/ARX)
Intrusion decision
Figure1: General architecture of the detection framework.
attacks due to large number of false alerts” [11]. Considered as an alternative to the traditional network anomaly detec-tion approaches or a data preprocessing for convendetec-tional detection approaches, recently signal processing techniques have been successfully applied to the network anomaly detection due to their ability in point change detection and data transforming (e.g., using CUSUM algorithm for DDoS detection [12]).
In this paper, we propose a new network signal modelling technique for detecting anomalies on networks. Although the wavelet analysis technique has been used for intrusion detection in the recent literatures [13–27], we apply it in a different way. In particular, the general architecture of our approach, which is illustrated in Figure 1, consists of three components, namely,feature analysis, normal network traffic
modeling based on wavelet approximation and prediction by ARX(AutoRegressive with eXogenous) model, and intrusion decision. During feature analysis, we define and generate fifteen features to characterize the network traffic behaviors, in which we expect that the more the number of features is, the more accurate the traffic volume information for the entire network will be characterized. This is different to the current wavelet-based network anomaly detection approaches because most of them use a limited number of features (i.e., the number of packets over a time interval) or existing features from public intrusion detection dataset (i.e., 41 features from KDD 1999 CUP intrusion detection dataset [28]) as the input signals. Based on the proposed fifteen features, normal daily traffic is then modeled and represented by a set of wavelet approximation coefficients, which can be predicted using an ARX model. Compared to the current approaches (e.g., [13]) that attempt to extract different frequency components from existing network signals, our approach is more generic and adaptive since the ARX model used for predicting the expected value of frequency components is trained from network traffic data collected on the current deployment network. The output for the normal daily traffic model is the residual that represents the deviation of current input signal from normal/regular behavioral signals. Residuals are finally input to the intrusion decision engine in which an outlier detection algorithm is running and making intrusion decisions.
The main contribution of this work consists of: (1) choosing fifteen network flow-based features which charac-terize the network traffic volume information as completed as possible; (2) based on the proposed features, modeling the normal daily network traffic using the wavelet approx-imation and the ARX system prediction technique; during traffic modeling process, we apply four different wavelet basis functions and attempt to unveil a basic question when applying wavelet techniques for detecting network attacks, that is “do wavelet basis functions have an important impact
on reducing the false positive rate and at the same time keeping an acceptable detection rate”?; and (3) performing a completed analysis for the full 1999 DARPA network traffic dataset using our detection approach. The original 1999 DARPA intrusion detection dataset is based on the raw TCPDUMP packet data [29]. We convert all of them into flow-based dataset. To the best of our knowledge, this is the first work to convert the full TCPDUMP-based 1999 DAPRA network traffic data into flow-based dataset since the 1998 DAPRA intrusion detection dataset [30] has been converted into connection-based dataset that is now called the 1999 KDDCUP dataset [28].
The rest of the paper is organized as follows.Section 2
introduces related work, in which we briefly summarize existing works on applying wavelet analysis techniques for intrusion detection. Section 3 proposes our detection approach. In particular, we describe the fifteen flow-based features in detail and explain the reasons for selecting them, introduce the methodology for modeling the normal daily traffic and present the outlier detection algorithm for intru-sion deciintru-sion.Section 4presents the experimental evaluation of our approach and discusses the obtained results.Section 5
makes some concluding remarks and discusses future work.
2. Related Work
The wavelet analysis technique has been widely used for network intrusion detection recently due to its inherent time-frequency property that allows splitting signals into different components at several frequencies. Some examples of typical works include literatures [13–25].
To address some limitations of wavelet analysis-based anomaly detection, such as, scale sensitive during anomaly detection, high computation complexity of wavelet trans-formation. Chang et al. proposed a new network anomaly detection method based on wavelet packet transform, which can adjust the decomposition process adaptively, and thus improving the detection capability on the middle and high frequency anomalies that cannot otherwise be detected by multi-resolution analysis [14]. The evaluation results with simulated attacks show that the proposed method detects the network traffic anomaly efficiently and quickly.
Some anomaly detection system prototypes based on wavelet analysis techniques have also been developed and implemented recently, such as Waveman by Huang et al. [15] andNetViewerby Kim and Reddy [16]. The evaluation results forWavemanwith part of the 1999 DARPA intrusion detection dataset and real network traffic data show that the Coiflet and Paul wavelets perform better than other wavelets in detecting most anomalies under same benchmark environment. TheNetViewer is based on the idea that “by observing the traffic and correlating it to the previous normal states of traffic, it may be possible to see whether the current traffic is behaving in an anomalous manner” [16]. In their previous work [17], Kim et al. proposed a technique for traffic anomaly detection through analyzing correlation of destination IP addresses in outgoing traffic at an egress router. They hypothesize that the destination IP addresses will have a high correlation degree for a number of reasons and the changes in the correlation of outgoing addresses can be used to identify network traffic anomalies. Based on this, they apply discrete wavelet transform on the address and port number correlation data over several time scales. Any deviation from historical regular norms will alter the network administrator of the potential anomalies in the traffic.
Focusing on specific types of network attacks, wavelet analysis is used to detect DoS or DDoS attacks in [18–20]. In [18], Ramanarran presented an approach named WADeS (Wavelet-based Attack Detection Signatures) for detecting DDoS attacks. Wavelet transform is applied on traffic signals and the variance of corresponding wavelet coefficients is used to estimate the attack points. In [19], Li and Lee found that aggregated traffic has strong bursty across a wide range of time scales and based on this they applied wavelet analysis to capture complex temporal correlation across multiple time scales with very low computational complexity. The energy distribution based on wavelet analysis is then used to find DDoS attack traffic since the energy distribution variance changes always cause a spike when traffic behaviors affected by DDoS attacks while normal traffic exhibits a remarkably stationary energy distribution. In [20], Dainotti et al. presented an automated system to detect volume-based anomalies in network traffic caused by DoS attacks. The system combines the traditional approaches, such as adaptive threshold and cumulative sum, with a novel approach based on the continuous wavelet transform. Not only applied for detecting specific network anomalies directly, wavelet analysis was also widely used in network measurement from the perspectives of traffic performance analysis [21],
traffic anomalies diagnosing and mining [22,23], and traffic congestion detection [24].
3. The Proposed Approach
As illustrated in Figure 1, our approach consists of three components, namely, feature analysis, normal daily traffic modeling based on wavelet approximation and ARX, and intrusion decision. In this section, we discuss each compo-nent in detail.
3.1. Feature Analysis. The major goal of feature analysis is to select and extract robust network features that have the potential to discriminate anomalous behaviors from normal network activities. Since most current network intrusion detection systems use network flow data (e.g., netflow, sflow, ipfix) as their information sources, we focus on features in terms of flows.
The following five basic metrics are used to measure the entire network’s behavior:
FlowCount. A flow consists of a group of packets going from a specific source to a specific destination over a time period. There are various flow definitions so far, such as netflow, sflow, ipfix, to name a few. Basically, one network flow should at lease include a source (consisting of source IP, source port), a destination (consisting of destination IP, destination port), IP protocol, number of bytes, number of packets. Flows are often considered as sessions between users and services. Since attacking behaviors are usually different from normal user activities, they may be detected by observing flow characteristics.
AverageFlowPacketCount. The average number of packets is in a flow over a time interval. Most attacks happen with an increased packet count. For example, distributed denial-of-service (DDoS) attacks often generate a large number of packets in a short time in order to consume the available resources quickly.
AverageFlowByteCount. The average number of bytesis in a flow over a time interval. Through this metric, we can iden-tify whether the network traffic consists of large size packets or not. Some previous denial-of-service (DoS) attacks use maximum packet size to consume the computation resources or to congest data paths, such as well knownping of death
(pod) attack.
AveragePacketSize. The average number of bytes per packet is in a flow over a time interval. It describes the size of packets in more detail than the aboveAverageFlowByteCountfeature.
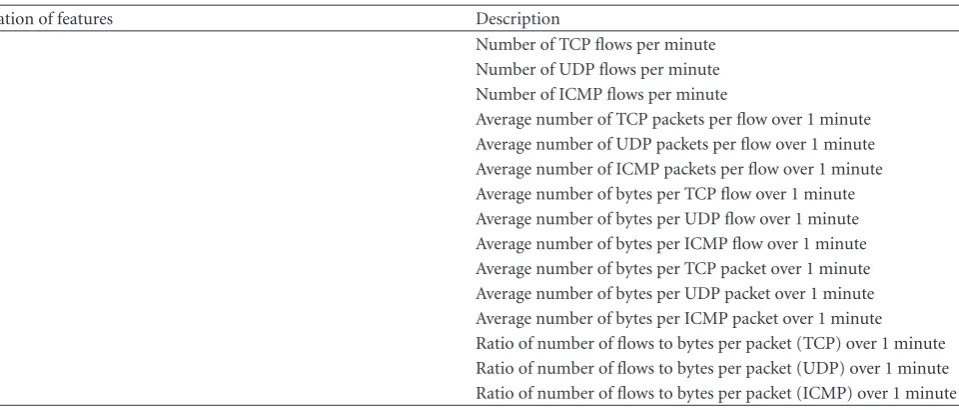
Table1: List of features.
Notation of features Description
f1 Number of TCP flows per minute
f2 Number of UDP flows per minute
f3 Number of ICMP flows per minute
f4 Average number of TCP packets per flow over 1 minute
f5 Average number of UDP packets per flow over 1 minute
f6 Average number of ICMP packets per flow over 1 minute
f7 Average number of bytes per TCP flow over 1 minute
f8 Average number of bytes per UDP flow over 1 minute
f9 Average number of bytes per ICMP flow over 1 minute
f10 Average number of bytes per TCP packet over 1 minute
f11 Average number of bytes per UDP packet over 1 minute
f12 Average number of bytes per ICMP packet over 1 minute
f13 Ratio of number of flows to bytes per packet (TCP) over 1 minute
f14 Ratio of number of flows to bytes per packet (UDP) over 1 minute
f15 Ratio of number of flows to bytes per packet (ICMP) over 1 minute
Based on the above five metrics, we define a set of features to describe the traffic Information for the entire network. LetF denote the feature space of network flows. We use a 15-dimensional feature vector f ∈F,{fi}i=1,2,...,15, given in
Table 1.
Empirical observations with the 1999 DARPA network traffic flow logs (converting packet into flow logs is discussed in Section 4) show that network traffic volumes can be characterized and discriminated through these features. An example is illustrated in Figures 2 and 3. By comparing the two graphs, we see that the feature “number of flows per minute” has the potential to identify the portsweep, ipsweep, pod, apache2, dictionary attacks [29]. For more information about the results of our empirical observation seehttp://www.ece.uvic.ca/∼wlu/wavelet.htm.
3.2. Normal Network Traffic Modeling with Wavelet and ARX.
In this section, we first briefly review the basic theoretical concepts on wavelet transform and system identification, and then present how to model the normal daily network traffic signals in our approach.
3.2.1. Overview of Wavelet Transform and System Identifi-cation Theory. The Fourier transform is well suited only to the study of stationary signals in which all frequencies are assumed to exist at all times and it is not sufficient to detect compact patterns. In order to address this issue, the short term Fourier transform (STFT) was proposed, in which Gabor localized the Fourier analysis by taking into account a sliding window [27]. The major limitation of STFT is that it can either give a good frequency resolution or a good time resolution (depending upon the window width). In order to have a coherence time proportional to the period, Morlet proposed Wavelet transform that can achieve good frequency resolution at low frequencies and good time resolution at high frequencies [31]. Further details about Fourier analysis, STFT analysis and Wavelet transform can
be found in [32]. In this paper, we use the discrete wavelet transform (DWT) since the network signals we consider have a cutofffrequency. DWT is a multistage algorithm that uses two basis functions called wavelet functionψ(t) and scaling functionφ(t) to dilate and shift signals. The two functions are then applied to transform input signals into a set of approximation coefficients and detail coefficients by which the input signalXcan be reconstructed.
System identification deals with the problem of identi-fying mathematical models of dynamical systems by using observed data from the system. In a dynamical system, its output depends both on its input as well as on its previous outputs. As we have known, ARX model is widely used for system identification. Letx(t) represent the regressor or predictor input andy(t) denote the output generated by the system we are trying to model. Then ARX [p,q,r] can be represented by the following linear difference equation:
y(t)=
p
i=1
aiy(t−i) + q
i=r
bix(t−i) +e(t), (1)
where ai andbi are the model parameters. Given an ARX
model with parametersθ, we have the following equation to predict the value of next output:
yt|θ=
p
i=1
aiy(t−i) + q
i=r
bix(t−i) (2)
and the prediction errorξ(t) is given by
14 12 10 8 6 4 2 0
×102 0 50 100 150 200 250 300 N u mb er of T C P fl o w s p er minut e
w1d1-number of TCP flows per minute
(a) 14 12 10 8 6 4 2 0
×102 0 2 4 6 8 10 12 14 16 18 20
×102
N u mber of UDP flo ws per m in ut e
w1d1-number of UDP flows per minute
(b) 14 12 10 8 6 4 2 0
×102 0 0.5 1 1.5 2 2.5 3 3.5 4 4.5 5 N u mb er of ICMP fl o w s p er minut e
w1d1-number of ICMP flows per minute
(c) Figure2: Number of flows per minute over one day with normal traffic only.
1400 1200 1000 800 600 400 200 0 0 5 10 15 20 25 30 35
×102
N u mb er of T C P fl o w s p er minut e
w5d1-number of TCP flows per minute
(a) 1400 1200 1000 800 600 400 200 0 0 2 4 6 8 10 12 14 16 18
×102
N u mber of UDP flo ws per m in ut e
w5d1-number of UDP flows per minute
(b) 1400 1200 1000 800 600 400 200 0 0 2 4 6 8 10 12 14 16
×102
N u mb er of ICMP fl o w s p er minut e
w5d1-number of ICMP flows per minute
(c) Figure3: Number of flows per minute over one day with normal and attacking traffic.
3.2.2. Normal Network Traffic Modelling. Modeling the
normal network traffic consists of two phases, namely, wavelet decomposition/reconstruction and generation of auto regressive model. Generally, the implementation of wavelet transform is based on filter bank or pyramidal algorithm [32]. In practical implementation, signals are passed through a low pass filter (H) and a high pass filter (G) at each stage. Given a signal with lengthl, we expect to obtain a filtered signal with length l. Since there are two filters in each filtering stage, the total number filtered signals are 2l. In order to remove the redundancies in signals, we can down sample the low pass and high pass filtered signals by half, without any information loss. The size of data can be reduced through down sampling since we are interested only in approximations in this case. After the low level details have been filtered out, the rest of coefficients represent a high level summary of signal behaviours and thus we can use them to establish a signal profile characterizing the expected behaviors of network traffic through the day. Although there also exists some other algorithms like`a trous
and redundant wavelet transforms that do not down sample signals after filtering [34], we use filter banks algorithm in the normal network traffic modeling. Therefore, during the wavelet decomposition/reconstruction process, the original signals are transformed into a set of wavelet approximation
coefficients that represent an approximate summary of the signal, since details have been removed during filtering.
Next, in order to estimate ARX parameters and generate ARX prediction model, we use the wavelet coefficients from one part of training data as inputs and wavelet coefficients from the other part of training data as the model fitting data. The ARX fitting process is used to estimate the optimal parameters based on least square errors. The whole procedure for modeling the normal network traffic is illustrated inFigure 4. After the prediction model for the normal network traffic is obtained, we can use it to identify anomalous signals from normal ones. When the input to the model includes only normal traffic, its output, called residuals, will be close to 0, which means the predicted value generated by the model is close to the actual input normal behaviors. Otherwise, when the input to the model includes normal traffic and anomalous traffic, the residuals will include a lot of peaks where anomalies occur. In this case, residuals are considered as a sort of mathematical transformation which tries to zeroize normal network data and amplify the anomalous data.
Collected network data
Signal approximation
coefficients generator
ARX model
training ARX modelfitting
ARX model parameters estimation
Figure4: Procedure for modeling normal network traffic.
order to identify the peaks (or outliers) of residuals, we implement an outlier detection algorithm based on Gaussian Mixture Model (GMM) and make intrusion decisions based on the results of the outlier detection algorithm.
In pattern recognition, it was established that Gaussian mixture distribution could approximate any distribution up to arbitrary accuracy, as long as a sufficient number of components are used [35], and thus the unknown probability density function can be expressed as a weighted finite sum of Gaussian with different parameters and mixing proportions [36]. Given a random variablex, its probability density function p(x) can be represented as a weighted sum of components:
p(x)=
k
i=1
αifi
x;μi,νi
, (4)
where k is the number of mixture components; αi(1 ≤
i ≤ k) stand for the mixing proportions, whose sum is always equal to 1. fi(x;μi,νi) refers to the component density
function, in which μi stands for the mean of variable x
andνi is the variance of x. The density function can be a
multivariate Gaussian or a univariate Gaussian.
Expectation-Maximization (EM) algorithm has been suggested as an effective algorithm to estimate the parameters of GMM [37]. Suppose the mixture component is the univariate Gaussian, the EM algorithm for GMM can be described as follows.
(1) Initialize the parameter setθ0= α0
i,μ0i,σi0.
(2)E-step: for each dataX∼{xn|n=1, 2,. . .,N}and for
each mixture component k, compute the posterior probability p(i | xn) by solving the following
equation:
pi|xn
= αiN
xn;μi,σi
k
i=1αiN
xn;μi,σi
. (5)
(3)M-step: reestimate the parameters based on the posterior probabilitiesp(i|xn):
αinew=
1
N
N
n=1
pi|xn
,
μinew=
N
n=1
pi|xn
N
n=1p
i|xn
xn,
σinew=
N
n=1
pi|xn
N
n=1p
i|xn
xn−μinew 2
.
(6)
(4) Go to Step 2 until the algorithm converges.
In the E-step (Expectation step) of the above EM algorithm, the posterior probability p(i | xn) is calculated
for each dataX∼{xn | n = 1, 2,. . .,N} and each mixture
componenti(1 ≤ i ≤ k). InM-step(Maximization step), the set of parameters {αi,μi,νi} are re-estimated based
on posterior probabilities p(i | xn), which maximize the
likelihood function. The EM algorithm starts with some initial random parameters and then repeatedly applies the E-step and M-E-step to generate better parameter estimates until the algorithm converges to a local maximum.
Our outlier detection algorithm is based on the terior probability generated by EM algorithm. The pos-terior probability describes the likelihood that the data pattern approximates to a specified Gaussian component. The greater the posterior probability for a data pattern belonging to a specified Gaussian component, the higher the approximation is. As a result, data are assigned to the corresponding Gaussian components according to their posterior probabilities. However, in some cases there are some data patterns whose posterior probability of belonging to any component of GMM is very low or close to zero. These data are naturally seen as the outliers or noisy data. We illustrate the detailed outlier detection algorithm in
Algorithm 1.
Thresholds th1 and th2 correspond to the termination
conditions associated with the outlier detection algorithm: th1 measures of the absolute precision required by the
algorithm and th2 is the maximum number of iterations
of our algorithm. Threshold outlierthres refers to the
min-imum mixing proportion. Once the mixing proportion corresponding to one specified Gaussian component is below outlierthres, the posterior probability of the data pattern
belonging to this Gaussian component will be set to 0. The intrusion decision strategy is based on the outcome of outlier detection:if no outlier data are detected, the network flows are normal; otherwise, the network flows represented by this outlier is reported as the intrusion.
4. Performance Evaluation
Function: GMM Outlier Detection (dataset andk)returnsoutlier data
Inputs:dataset, such as the residuals and the estimated number of componentsk Initialization:j=0; initial parameters{aij,u
j i,v
j
i}, 1≤i≤k, are randomly generated; calculate the initial log-likelihoodLj;
Repeat: If (aij≥outlierthres) thencompute posterior probabilitypj(i|xn);elsepj(i|xn)=0; j=j+ 1; re-estimate{aij,u
j i,v
j
i}by usingpj−1(i|xn); calculate the current log-likelihoodLj;
Until:|Lj−Lj−1|<th1orj >th2
If (pj−1(i|xn)=0, 1≤i≤kand 1≤n≤Nthenxnis outlier
Returnxn;
Algorithm1: The proposed outlier detection algorithm.
network packet logs into network flow-based logs since the 1998 DAPRA intrusion detection dataset has been converted into connection-based dataset in 1999 (i.e., 1999 KDDCUP intrusion detection dataset).
During the evaluation, the results are summarized and analyzed in three different categories, namely, how many attack instances are detected by each feature and all features correlation, how many attack types are detected by each feature and all features correlation and how many attack instances are detected for each attack type. We do not use the traditional Receiver Operating Characteristic (ROC) curve to evaluate our approach and analyze the tradeoff between the false positive rates and detection rates because ROC curves are often misleading and incomplete [40,41]. Compared to most, if not all, other evaluations with the 1999 DARPA dataset, our evaluation covers all types of attacks and all days’ network traffic and as a result, we consider our evaluation as a completed analysis for network traffic in the 1999 DARPA dataset. Although the 1998 and 1999 DARPA dataset are the widely used and acceptable benchmark for the intrusion detection research, they are criticized in [42,43] due to the methodology for simulating actual network environment. As a result, we conduct an evaluation with a real network traffic dataset collected on a large-scale WiFi ISP network. Next, we will briefly introduce the 1999 DAPRA/MIT Lincoln intrusion detection dataset, explain the method for converting the TCPDUMP packet logs into network flow-based logs, analyze the residuals for supporting our intrusion decision assumption inSection 3.3, and discuss the intrusion detection results we obtain.
4.1. The 1999 DAPRA/MIT Lincoln Intrusion Detection Dataset. The 1999 DARPA intrusion detection dataset is one of the first standard corpuses used for evaluating intrusion detection approaches offline [29] and it includes 5 weeks of sniffed traffic (tcpdumpfiles) from two points in a simulated network, one “inside” sniffer, between the gateway router and four “victim” machines, one “outside” sniffer between the gateway and the simulated Internet, and host-based audit data collected nightly from the four victims. We consider only the “inside” tcpdump traffic during our evaluation in this paper. The five weeks are as follows:
(i) Weeks 1 and 3: no attacks (for training anomaly detection systems). During week 1, a total of 22
hours of training data is captured on the simulation network and the network does not experience any unscheduled down time. During week 3, the network is brought down early (4:00 AM) on Day 4 (Thurs-day) for extended unscheduled maintenance. Traffic collection is stopped on midnight of Day 5 due to weekends.
(ii) Week 2: 43 attacks belonging to 18 labelled attack types are used for system development. During week 2, the simulation network is brought down early (3:00 AM) during Day 2 (Thursday) for extended unscheduled maintenance.
(iii) Weeks 4 and 5: 201 attacks belonging to 58 attack types (40 new) are used for evaluation. During week 4, the inside traffic for Day 2 (Tuesday) is missed. During week 5, the total 22 hours traffic data is available and there is no down-time of the network.
All the attacks in the 1999 DARPA intrusion detection dataset can be grouped into five major categories:
(1) denial-of-service (DoS): an unauthorized attempt to make a computer (network) resource unavailable to its intended users, for example, SYNFlood.
(2) Remote to local (R2L): unauthorized access from a remote machine, for example, guessing password. (3) User to root (U2R): unauthorized access to local
super-user (root) privileges, for example, various buffer overflow attacks.
(4) Surveillance or probing: unauthorized probing of a host or network to look for vulnerabilities, explore configurations, or map the network’s topology, for example, port scanning.
(5) Data compromise (data): unauthorized access or modification of data on local host or remote host.
10 9 8 7 6 5 4 3 2 1
×102 Index of timestamp
−15 −10 −5 0 5 10 15 20 25 30 35
×102
Va lu e o f re si d u al (a) 10 9 8 7 6 5 4 3 2 1
×102 Index of timestamp
−5 0 5 10 15 20
×102
Va lu e o f re si d u al (b) 10 9 8 7 6 5 4 3 2 1
×102 Index of timestamp
−2 0 2 4 6 8 10 12 14
×102
Va lu e o f re si d u al (c)
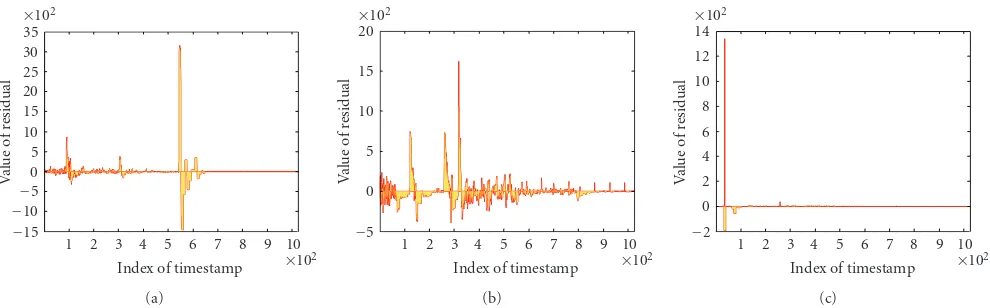
Figure5: Residuals for number of flows per minute; from left to right is Figures5(a),5(b), and5(c)representing TCP, UDP, and ICMP flows, respectively.
into flow logs over a specific time interval and then based on these flow logs we conducted a full network behavioral analysis for the dataset.
4.2. Converting 1999 DARPA ID Dataset into Flow Logs. Two existing tools (editcap, tshark) are used to convert the DARPA tcpdump files into flow logs. The raw tcpdump files we consider are the “inside”tcpdumptraffic files. First,editcap
is used to split the rawtcpdumpfile into differenttcpdump
files based on a specific time interval. In this case, we set the time interval as one minute in order to keep it the same as the time interval of flow data provided by most industrial standard. An example of usingeditcapis as follows:
editcap-A1999-04-09 09:00:00-B1999-04-09 09:01:00
inside.tcpdump1.pcap
Then, thetcpdumptraffic data over the specific time interval is converted into flow logs bytsharkthrough the following commands:
tshark-r 1.pcap-q-n-z conv,tcp,
tshark-r 1.pcap-q-n-z conv,ud p,
tshark-r 1.pcap-q-n-z ip,icmp.
Finally, the format of the generated DARPA flow logs is as follows:
{timestamp, local src IP: src port, remote dst IP: dst port, incoming number of packets (remote → local), incoming number of bytes, outgoing (local → remote) number of packets, outgoing number of bytes, total number of packets, total number of bytes, protocol}.
An example of one flow log of DARPA is described as:
920275200 135.8.60.182 : 1116
←→172.16.114.169 : 25 47 3968 77 59310 124 63278 tcp
4.3. Analysis for Residuals. The purpose for analyzing the residuals is to support our assumption inSection 3.3, that is the higher the value of residuals, the more anomalous the flow is. Based on this assumption, we propose an
outlier detection algorithm for residuals and the intrusion decision strategy is according to the outcome of outlier detection: if no outlier data are detected, the network flows are normal; otherwise, the network flows represented by this outlier is reported as the intrusion. As an example, we analyze the traffic data on Monday, Week 5 since it includes not only normal behaviors, but also a large number attacking activities. Figure 3 in Section 3.1 illustrates the original network behaviors characterized by the feature “number of flows per minute” over one day. The following
Figure 5illustrates the network behaviors characterized by residuals over same feature “number of flows per minute.” By comparing Figures3and5, we conclude that the peaks of residuals identify exactly the location where attacks happen. As illustrated in Figure 3, we know that neptune (dict) attacks happen between timestamp 500 to 600 (since the flow data is based on 1 minute time period, the timestamp 500 means the 500 minutes after the starting observing time point). From Figure 5, we see that residuals generate a peak on the exact time where the attack happens. For more information about residuals for other features see
http://www.ece.uvic.ca/∼wlu/wavelet.htm.
4.4. Experimental Settings and Intrusion Detection Results.
Table2: List of notations used in experimental evaluation.
Notation Description
WxDy The specific date, for example,x=4,y=1 and W4D1 means Monday on Week 4
Attack type Types of attacks named by DARPA/MIT Lincoln, for example, pod means ping ofdeath attack
Attacking instance Flow data collected during the period of an attack over a time interval
Total number of instances Number of sequence value of features, for example, 1 hour includes 60 instances due to 1 min time interval
Total number of attacking instances
Number of sequence value of features extracted from flow data with attacks, for example, an attack lasts 30 minutes and there are 30 attacking instances Total number of normal
instances
Number of sequence value of features extracted from pure flow data without any attack or residual of attacks
Total alarms Number of alerts generated by our approach
Correctly detected alarms Number of alerts that detect attacks correctly
Number of false alarms Number of alerts that report attacks falsely, that also means the alerts report normalinstances as attacks
Detection rate Ratio of correctly detected alarms to total number of attacking instances All features correlatioN Delete the overlap of alarms generated by all 15 features
Table3: Detection rate for each day.
Days W4D1 W4D3 W4D4 W4D5 W5D1 W5D2 W5D3 W5D4 W5D5
DR for attack types (%) 57.14 94.44 66.67 84.62 100 75.0 71.43 88.89 74.1
DR for attack instances (%) 29.23 97.12 51.19 79.37 94.67 66.1 49.52 74.33 26.7
the other hand, thresholds th5 and th6 correspond to the
termination conditions associated with the outlier detection algorithm: th5is a measure of the absolute precision required
by the algorithm and th6 is the maximum number of
iterations required by the algorithm. We set th5 and th6
as 0.0001 and 5000, respectively. The parameter outlierthres
refers to the minimum mixing proportion in the outlier detection algorithm and its selection is very important since it has an important impact on the detection results. During the evaluation, we set it as 0.00001 since the value can provide us an optimal detection results when compared to other empirical settings. The detailed discussion about the selection of threshold on our outlier detection algorithm can be found in [44].
We evaluate our approach with two weeks testing (week 4 and week 5) data from the 1999 DARPA flow logs. The evaluation results are summarized and analyzed in three different categories, namely, how many attack instances are detected by each feature and all features correlation, how many attack types are detected by each feature and all features correlation and how many attack instances are detected for each attack type.Table 2explains some notations used in our experimental evaluation.
The starting time of each attack occurs and its last time period can be referred to [29]. Table 3 illustrates the detection rate for each day in terms of attack types and attack instances. We found that the highest detection rate was obtained in the traffic data collected on Monday, Week 5, where all attack types were detected and about 95% attack instances were detected. In contrast, the lowest detection rate was obtained in the test data of Monday, Week 4, where only
about 30% attack instances were found and almost half of attack types were missed.
The detection results on Monday, Week 5 are illustrated in Tables 4,5, and6. The detail detection results on other days seehttp://www.ece.uvic.ca/∼wlu/wavelet.htm.
As we discussed before, we do not use ROC curves to evaluate our approach. Moreover, we do not calculate the traditional detection performance metric FPR (false positive rate) during the evaluation. The main reason is that the residuals of an attack behavior have an impact on the following successive normal traffic. As a result, residuals of an attack behavior will be mixed into the normal traffic and identifying this kind of behaviors is blurred. Ignoring these blurring behaviors during the evaluation will generate a large number of false alarms. A possible solution to this issue is that we may define an attack decaying period tdecay which
starts from the exact time pointtattackwhen attacks happen.
When we find an attack attattack, we consider all following
traffic behaviors over [tattack, tattack+tdecay] as intrusions.
Table4: Number of attack instances detected for each attack type for W5D1.
Attack Type W5D1
Number of attack instances for each
attack type
Detected number of attack instances for each attack type
apache2-dos 30 29
arppoison-probe 15 15
dict-r2l 17 17
dosnuke-dos 2 2
ffbconfig-u2r 10 8
guesstelnet-r2l 4 4
imap-r2l 1 1
ipsweep-probe 26 26
loadmodule-u2r 5 5
ls-probe 2 2
ncftp-r2l 2 2
neptune-dos 5 5
pod-dos 3 1
portsweep-probe 4 2
selfping-dos 2 2
smurf-dos 2 2
syslogd-dos 1 1
udpstorm-dos 16 16
warezclient-dos 2 1
crashiis-dos 1 1
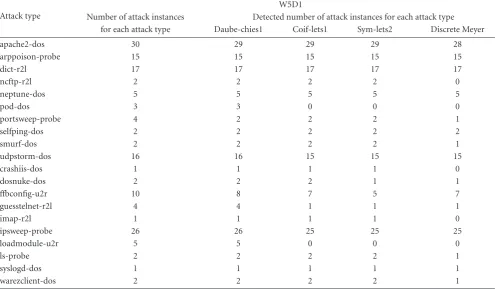
on the 1999 DARPA flow logs on Monday, Week5, in which twenty attack types occur. During the evaluation, we found that the wavelet basis function is sensitive to features. That is one basis function operating well for one feature might have bad results for the other features. For example, Coiflets1 is better than Symlets2 in terms of f1, but worse than it in
terms of f13. In order to achieve an optimal solution, we have
to use different wavelet basis functions for different features.
Table 7 illustrates the number of attack instances detected for each attack type by different wavelet basis functions. Since attacks always last couple of minutes in DARPA, we consider all traffic appeared over the attacking period are anomalous behaviors. Thus, even only one attack instance is identified during the attacking period, we still can say the approach identify this attack type successfully. According to
Table 7, all attack types are detected by Daubechies1 (Haar), 18 attack types are detected by Coiflets1 and Symlets2 over total 20 attack types on that day, and 17 attack types are detected by Discrete Meyer. Generally speaking, we conclude that Daubechies1 (Haar) basis function achieves the slightly better performance than other three wavelet families.
4.6. Evaluation with Network Flows on a WiFi ISP Network.
Our approach is also evaluated with three full days’ traffic on Fred-eZone, a free wireless fidelity (WiFi) network service provider operated by the City of Fredericton [45], consider-ing the limitations of the 1999 DARPA intrusion detection
dataset. Table 8 lists the general workload dimensions for the Fred-eZone network capacity. FromTable 8, we see, for example, that the unique number of source IP addresses appeared over one day is about 1,055 thousands and the total of packets is about 944 millions. Three full days’ network flows are collected on Fred-eZone and we use, for example, the notation “Fred-Day1” to represent the traffic for the first day. During the training phase, in order to generate the external regressor we use the Fred-Day1 traffic as input signal. Based on this we get wavelet approximation coeffi -cients, which act as the external regressor input into the ARX model. Then, we apply the Fred-Day2 traffic as test signal and use this test signal to fit the ARX model. The parameter settings of ARX model and the selection of the wavelet basis function are totally the same with the evaluation with the 1999 DARPA intrusion detection dataset. The traffic on Fred-Day1 and Fred-Day2 are normal since we delete all malicious network flows identified by the IDS deployed on Fred-eZone, while the traffic on Fred-Day3 is a mixture of normal and malicious network flows. In particular, six types of attacks are included on the Fred-Day3 traffic, namely, UDP DoS, Multihost Attack, Stealthy Scan, Potential Scan, HostScans and Remote Access Violation. Table 9 lists the number of flows, number of bytes and number of packets for each type of attack identified on that day.
During the evaluation, we use ten features as the network signals, including f1, f2, f4, f5, f7, f8, f10, f11, f13, and f14
and we do not consider the features f3, f6, f9, f12, and f15
because they are ICMP based. FromTable 9, we see that all the attacking traffic is UDP or TCP based. Similarly, Tables10
to12list the evaluation results in terms of number of attack instances detected for each attack type, number of attack types detected for each feature, number of attack instances detected for each feature and all features correlation.Table 10
illustrates that our approach successfully detect five attacks over the total six attacks and the attack Potential Scan is missed. Table 11shows that the UDP-based features f5
and f8 successfully detect the UDP DoS attack and the
TCP-based features are also sensitive to the TCP-based attacks, for example, Remote Access Violation. The number of false alarms for our approach running with the full day’s traffic is 0, showing that the normal/daily network traffic is modeled accurately and any deviation (anomaly) on the network will lead to a large peak value compared to other points, thus easily identified by the outlier detection algorithm. As an example,Figure 6illustrates the residuals for the feature “number of packets per flow.” For the residuals for other features generated by our model see
http://www.ece.uvic.ca/∼wlu/wavelet.htm.
4.7. Comparison with Existing Anomaly Detection Approaches.
Table5: Number of attack types detected for each feature for W5D1.
Feature W5D1
Detected attack types
f1 apache2-dos, guesstelnet-r2l,crashiis-dos ffbconfig-u2r, pod-dos, ipsweep-probe, neptune-dos,
f2 warezclient-dos, dosnuke-dos, arppoison-probe, pod-dos, ipsweep-probe
f3 smurf-dos, portsweep-probe, apache2-dos,ipsweep-probe, dict-r2l, udpstorm-dos ffbconfig-u2r, arppoison-prob,
f4 loadmodule-u2r, udpstorm-dos
f5 udpstorm-dos, selfping-dos, ncftp-r2l
f6
smurf-dos, , apache2-dos, guesstelnet-r2l, loadmodule-u2r,ffbconfig-u2r, arppoison-probe, ipsweep-probe, dict-r2l, syslogd-dos, neptune-dos, ls-probe, dosnuke-dos, udpstorm-dos, selfping-dos
f7 apache2-dos, arppoison-probe, dict-r2l, neptune-dos, udpstorm-dos
f8 udpstorm-dos, selfping-dos
f9
apache2-dos, arppoison-probe, crashiis-dos, dict-r2l, dosnuke-dos,ffbconfig-u2r, guesstelnet-r2l, imap-r2l, ipsweep-probe, loadmodule-u2r, ls-probe, ncftp-r2l, neptune-dos, pod-dos, portsweep-probe, selfping-dos, smurf-dos, syslogd-dos, udpstorm-dos, warezclient-dos
f10 apache2-dos, smurf-dos, arppoison-probe, pod-dos, dict-r2l
f11 apache2-dos,ffbconfig-u2r, loadmodule-u2r, udpstorm-dos
f12
apache2-dos, arppoison-probe, crashiis-dos, dict-r2l, dosnuke-dos,ffbconfig-u2r, guesstelnet-r2l, imap-r2l, ipsweep-probe, ls-probe, neptune-dos, pod-dos, portsweep-probe, selfping-dos, smurf-dos, syslogd-dos, udpstorm-dos
f13 apache2-dos, crashiis-dos, dict-r2l, dosnuke-dos,ls-probe, neptune-dos ffbconfig-u2r, guesstelnet-r2l,
f14 warezclient-dos, arppoison-probe, pod-dos, ipsweep-probe, udpstorm-dos
f15 apache2-dos, ,ffbconfig-u2r
Table6: Number of attack instances detected for each feature and all features correlation for W5D1.
W5D1
Features Total Attacking Normal Total Detected False DR (%)
instances instances instances alarms
f1 1320 150 1170 152 40 112 26.67
f2 1320 150 1170 127 15 112 10.0
f3 1320 150 1170 140 21 119 14.0
f4 1320 150 1170 57 3 54 2.0
f5 1320 150 1170 119 19 100 12.67
f6 1320 150 1170 216 48 168 32.0
f7 1320 150 1170 48 13 35 8.67
f8 1320 150 1170 117 17 100 11.33
f9 1320 150 1170 750 125 625 83.33
f10 1320 150 1170 25 8 17 5.33
f11 1320 150 1170 60 15 45 10.0
f12 1320 150 1170 479 97 382 64.67
f13 1320 150 1170 188 40 148 26.67
f14 1320 150 1170 90 10 80 10.0
f15 1320 150 1170 23 2 21 1.33
All feature
1320 150 1170 894 142 752 94.67
Table7: Number of attack instances detected for each attack type by different basis functions.
Attack type
W5D1
Number of attack instances Detected number of attack instances for each attack type for each attack type Daube-chies1 Coif-lets1 Sym-lets2 Discrete Meyer
apache2-dos 30 29 29 29 28
arppoison-probe 15 15 15 15 15
dict-r2l 17 17 17 17 17
ncftp-r2l 2 2 2 2 0
neptune-dos 5 5 5 5 5
pod-dos 3 3 0 0 0
portsweep-probe 4 2 2 2 1
selfping-dos 2 2 2 2 2
smurf-dos 2 2 2 2 1
udpstorm-dos 16 16 15 15 15
crashiis-dos 1 1 1 1 0
dosnuke-dos 2 2 2 1 1
ffbconfig-u2r 10 8 7 5 7
guesstelnet-r2l 4 4 1 1 1
imap-r2l 1 1 1 1 0
ipsweep-probe 26 26 25 25 25
loadmodule-u2r 5 5 0 0 0
ls-probe 2 2 2 2 1
syslogd-dos 1 1 1 1 1
warezclient-dos 2 2 2 2 1
Table8: Workload of Fred-eZone WiFi network over one day.
SrcIP DstIP Flows Packets Bytes
1055 K 1228 K 30783 K 994 M 500 G
collected on a simulated network over a couple of weeks. Evaluating the approaches with the common DARPA dataset is unfair because most of anomaly detection approaches han-dle the features extracted from the raw packets instead of the original raw TCPDUMP packets. The feature extraction pro-cess, however, has an important impact on the final detection result. This is confirmed by comparing two works [46,47], in which based on the same 1998 DAPRA intrusion detection dataset, the LOF approach (Density-based Local Outliers) is distinctly better than the NN approach (Nearest Neighbor) claimed by Lazarevic et al. in [46], while the LOF, however, is much worse than the NN approach in [47] since two different feature sets are used in these two approaches even those features are both based on the same 1998 DARPA intrusion detection dataset. As a result, the 1999 KDDCUP dataset is set up that is based on 41 common features extracted from the 1998 DARPA intrusion detection dataset. Although the 1999 KDDCUP provides us a common benchmark for evaluating different network anomaly detection approaches under the same conditions, it has been used arbitrarily. For example, some researchers use a part of KDDCUP training dataset for the sake of training and another part for testing, which is not true because there is a separate testing part containing new attacks which do not exist in the training set
to see how successful the detection approach is facing with new attacks. Moreover, there are two types of DoS attacks constituting over 71% of the whole KDDCUP testing dataset, which would lead a heavily biased detection result.
During our comparison experiment, we select two typical anomaly detection approaches from both machine learning techniques and signal processing techniques, namely, I-means clustering algorithm [48] and nonparametric CUmu-lative SUM (CUSUM) algorithm [12]. I-means is a hybrid-clustering algorithm that is built around the k-means algorithm, which can determine systematically the optimal number of clusters for a given dataset. The CUSUM algo-rithm is an approach to detect a change of the mean value of a stochastic process and it is based on the fact that if a change occurs, the probability distribution of the random sequence will also be changed. Detail information about I-means algorithm and CUSUM can be found in [48] and [12], respectively. To make a fair comparison, we use the same fifteen features as the input for all the three approaches.
Table 13lists the detection results on Day 2, Week 5 (W5D2) in terms of number of attack instances detected for each attack type by different approaches.
Table9: Descriptions on attacks identified on the third day in Fred-eZone.
Attack types Volume features
Number of flows Number of packets Number of bytes
UDP DoS 2 313 038 146 770 832
Multihost Attack 158 19 033 1 800 315
Stealthy Scan 2 4 872 175 392
Potential Scan 17 724 111 138
Host Scans 44 11 226 10 601 722
Remote Access Violation 4 31 441 17 286 538
Table10: Number of attack instances detected for each attack type for Fred-Day3.
Attack Type Fred-Day3
Number of attack instances for each attack type
Detected number of attack instances for each attack type
UDP DoS 1 1
Multihost attack 1 1
Stealthy scan 1 1
Potential scan 1 0
Host scans 1 1
Remote access
violation 1 1
Table11: Number of attack types detected for each feature for Fred-Day3.
Feature Fred-Day3
Detected attack types
f4 Remote access violation, stealthy scan
f5 UDP DoS
f7 Remote access violation
f8 UDP DoS
f10 Multihost attack, host scans, stealthy scan
f1f2f11f13f14 Null
The I-means detects 14 attack types, in which one attack (i.e., ncftp-r2l) is missed by our approach.Table 14list the detection rate (DR) for all three approaches in terms of attack type and attack instance.
From Tables13and14, we see that our wavelet model obtains the best detection performance compared to the other two typical machine learning and signal processing techniques.
To conduct a more comprehensive comparison, we also investigate the detection results with the DAPRA intrusion detection dataset by some existing wavelet analysis-based anomaly detection approaches [15,20,26]. In [15], Huang et al. evaluate theirWavemanframework using three denial-of-service (DoS) attacks from the 1999 DAPRA intrusion detection dataset, namely, neptune, smurf and mailbomb. They show a large deviation at the locations of the neptune attack start and end, with minimum deviations at all other locations. It is claimed that the entropy-based method and
1200 1000 800 600 400 200 0
Index of timestamp
−1
0 1 2 3 4 5 6 7 8
×103
Va
lu
e
o
f
re
si
d
u
al
(a)
1200 1000 800 600 400 200 0
Index of timestamp
−2 0 2 4 6 8 10 12 14 16
×104
Va
lu
e
o
f
re
si
d
u
al
(b)
Figure6: Residuals for average number of packets per flow over one minute; from left to right is Figures6(a)and6(b), representing TCP and UDP flows, respectively.
Table12: Number of attack instances detected for each feature and all features correlation for Fred-Day3.
Features Fred-Day3
Total instances Attacking instances Normal instances Total alarms Detected False DR (%)
f4 1440 6 1434 2 2 0 33.3
f5 1440 6 1434 1 1 0 16.7
f7 1440 6 1434 1 1 0 16.7
f8 1440 6 1434 1 1 0 16.7
f10 1440 6 1434 3 3 0 50.0
f1f2f11f13f14 1440 6 1434 0 0 0 0.0
All Feature Correlation 1440 6 1434 5 5 0 83.3
Table13: Number of attack instances detected for each attack type by different approaches.
Attack type
W5D2
Number of attack instances Detected number of attack instances for each attack type
for each attack type Wavelet/ARX CUSUM I-means
xsnoop-r2l 2 2 2 2
ftpwrite-r2l 15 7 5 15
back-dos 21 20 11 21
neptune-dos 18 15 12 18
httptunnel-r2l 6 6 3 5
eject-u2r 17 17 6 16
ppmarcro-r2l 13 13 3 9
syslogd-dos 1 1 1 1
perl-u2r 15 15 3 11
Queso-probe 1 1 1 1
ipsweep-probe 20 9 4 5
xterm1-u2r 41 23 0 0
ps-u2r 101 94 0 0
pod-dos 1 1 0 0
yaga-u2r 43 29 0 0
crashiis-dos 1 1 0 1
fdformat-u2r 61 39 0 0
dosnuke-dos 2 1 0 1
ncftp-r2l 2 0 0 1
Table14: Detection rate for all three approaches in terms of attack type and instance.
Approaches
Performance DR (%)
Attack Type Attack Instance
Wavelet/ARX 75.0 66.1
CUSUM 45.8 25.6
I-means 58.3 54.3
[50]. In [26], Rawat and Sastry test their approach on the 10% of the 1999 KDDCUP dataset, which is provided with the full set and consists of almost all the attacks present in the 1998 DARPA dataset with a total of 494 020 records. However, only the detection result for the neptune and smurf attacks are discussed in the paper and only detection results for neptune is showed. Compared to other existing
evaluation works, our evaluation is the most completed one since it takes care of the total 55 attack types and 5 full attacking categories. Moreover, during our evaluation, we do not miss any attack instances collected from the 1999 DARPA intrusion detection dataset.
5. Conclusions and Future Work
called residuals that measure the difference between normal and anomalous activities. The empirical observations show that the peaks of residuals always stand for the location where attacks occur. As a result, an outlier detection algorithm based on GMM is implemented in order to detect peaks from a set of residuals. Decisions are made based on the results of the proposed outlier detection algorithm. A complete traffic analysis for the 1999 DARPA intrusion detection dataset is conducted using our network anomaly detection approach. To the best of our knowledge, it is the first work to analyze the full 1999 DARPA traffic dataset from the network flow based perspective. The best detection rates in terms of attack types and attack instances are 100% and 94.67%, respectively. That means our approach detects all the attack types appeared on that day and almost 95% attack instances are identified accurately. The experimental comparison with two other typical existing machine learning algorithms (i.e., I-means) and signal processing techniques (nonparametric CUSUM) shows that our approach obtain the best performance.
In the near future, we will focus on applying different wavelet basis functions for modeling the network traffic signals. An interesting problem we attempt to solve is to find whether the different wavelet families have different propensities to different classes of attacks since it implies that these attack classes have core differences in their information which the different wavelet families are bringing to the surface, so that we can unveil a set of questions, for example, “why is a Coifflet better than a Daubechies wavelet for this attack class?”, “what is it about this attack class that the Coifflet sees but the Daubechies wavelet does not?”, to name a few.
References
[1] J. P. Anderson, “Computer security threat monitoring and surveillance,” Tech. Rep., James P. Anderson, Fort Washington, Pa, USA, 1999.
[2] D. E. Denning, “An intrusion detection model,”IEEE Transac-tions on Software Engineering, vol. 13, no. 2, pp. 222–232, 1987. [3] S. Axelsson, “The base-rate fallacy and the difficulty of intrusion detection,” ACM Transactions on Information and System Security, vol. 3, no. 3, pp. 186–201, 2000.
[4] J. Hochberg, K. Jackson, C. Stallings, J. F. McClary, D. DuBois, and J. Ford, “NADIR: an automated system for detecting network intrusion and misuse,”Computers & Security, vol. 12, no. 3, pp. 235–248, 1993.
[5] T. Lunt, R. Jagannathan, R. Lee, et al., “IDES: the enhanced prototype, a real-time intrusion detection system,” Tech. Rep. SRI Project 4185-010, SRI International, Computer Science Laboratory, Menlo Park, Calif, USA, October 1988.
[6] S. E. Smaha, “Haystack: an intrusion detection system,” in Proceedings of the 4th IEEE Aerospace Computer Security Appli-cations Conference, pp. 37–44, Orlando, Fla, USA, December 1988.
[7] J. Frank, “Artificial intelligence and intrusion detection: cur-rent and future directions,” inProceedings of the 17th National Computer Security Conference, pp. 11–21, Baltimore, Md, USA, October 1994.
[8] S. Forrest, S. A. Hofmeyr, A. Somayaji, and T. A. Longstaff, “A sense of self for unix processes,” in Proceedings of IEEE
Symposium on Security and Privacy, pp. 120–128, Oakland, Calif, USA, May 1996.
[9] M. Barreno, B. Nelson, R. Sears, A. D. Joseph, and J. D. Tygar, “Can machine learning be secure?” inProceedings of the ACM Symposium on Information, Computer and Communications Security (ASIACCS ’06), pp. 16–25, Taipei, Taiwan, March 2006.
[10] M. Sabhnani and G. Serpen, “Analysis of a computer security dataset: why machine learning algorithms fail on KDD dataset for misuse detection,”Intelligent Data Analysis, vol. 8, no. 4, pp. 403–415, 2004.
[11] A. Patcha and J.-M. Park, “An overview of anomaly detection techniques: existing solutions and latest technological trends,” Computer Networks, vol. 51, no. 12, pp. 3448–3470, 2007. [12] H. Wang, D. Zhang, and K. G. Shin, “Detecting SYN flooding
attacks,” in Proceedings of the 21st Annual Joint Conference of the IEEE Computer and Communications Societies (INFO-COM ’02), vol. 3, pp. 1530–1539, New York, NY, USA, June 2002.
[13] P. Barford, J. Kline, D. Plonka, and A. Ron, “A signal analysis of network traffic anomalies,” inProceedings of the 2nd ACM SIGCOMM Workshop on Internet Measurment (IMW ’02), pp. 71–82, Marseille, France, November 2002.
[14] J. Gao, G. Hu, X. Yao, and R. K. C. Chang, “Anomaly detection of network traffic based on wavelet packet,” inProceedings of the Asia-Pacific Conference on Communications (APCC ’06), pp. 1–5, Busan, Korea, August 2006.
[15] C.-T. Huang, S. Thareja, and Y.-J. Shin, “Wavelet-based real time detection of network traffic anomalies,” inProceedings of Workshop on Enterprise Network Security and the 2nd Interna-tional Conference on Security and Privacy in Communication Networks, pp. 1–7, Baltimore, Md, USA, August 2006. [16] S. S. Kim and A. L. N. Reddy, “Image-based anomaly
detec-tion technique: algorithm, implementadetec-tion and effectiveness,” IEEE Journal on Selected Areas in Communications, vol. 24, no. 10, pp. 1942–1954, 2006.
[17] S. S. Kim, A. L. N. Reddy, and M. Vannucci, “Detecting traffic anomalies through aggregate analysis of packet header data,” inProceedings of the 3rd International IFIP-TC6 Networking Conference, pp. 1047–1059, Athens, Greece, May 2004. [18] A. Ramanarran,WADES: a tool for distributed denial of service
attack detection, M.S. thesis, Texas A&M University, College Station, Tex, USA, 2002, TAMU-ECE-2002.
[19] L. Li and G. Lee, “DDoS attack detection and wavelets,” inProceedings of 12th International Conference on Computer Communications and Networks (ICCCN ’03), pp. 421–427, Dallas, Tex, USA, October 2003.
[20] A. Dainotti, A. Pescape, and G. Ventre, “Wavelet-based detection of DoS attacks,” inProceedings of the IEEE Global Telecommunications Conference (GLOBECOM ’06), pp. 1–6, San Francisco, Calif, USA, November 2006.
[21] P. Huang, A. Feldmann, and W. Willinger, “A non-intrusive, wavelet-based approach to detecting network performance problems,” inProceedings of the 1st ACM SIGCOMM Workshop on Internet Measurment (IMW ’01), pp. 213–227, San Fran-cisco, Calif, USA, November 2001.
[22] A. Lakhina, M. Crovella, and C. Diot, “Diagnosing network-wide traffic anomalies,” inProceedings of the ACM SIGCOMM Conference on Applications, Technologies, Architectures, and Protocols for Computer Communications (SIGCOMM ’04), pp. 219–230, Portland, Ore, USA, September 2004.
[24] M. S. Kim, T. Kim, Y. J. Shin, S. S. Lam, and E. J. Powers, “A wavelet-based approach to detect shared congestion,”ACM SIGCOMM Computer Communication Review, vol. 34, no. 4, pp. 293–306, 2004.
[25] B. S. Liu, Y. J. Li, Y. P. Hou, and X. S. Sui, “The identification and correction of outlier based on wavelet transform of traffic flow,” inProceedings of International Conference on Wavelet Analysis and Pattern Recognition, pp. 1498–1503, Beijing, China, November 2007.
[26] S. Rawat and C. S. Sastry, “Network intrusion detection using wavelet analysis,” inProceedings of the 7th International Conference on Information Technology (CIT ’04), vol. 3356 of Lecture Notes in Computer Science, pp. 224–232, Hyderabad, India, December 2004.
[27] D. Gabor, “Theory of communication,”Journal of IEE, vol. 93, pp. 429–441, 1946.
[28] KDDCUP, http://kdd.ics.uci.edu/databases/kddcup99/ kddcup99.html.
[29] DARPA, 1999, http://www.ll.mit.edu/IST/ideval/data/1999/ 1999 data index.html.
[30] DARPA, 1998, http://www.ll.mit.edu/IST/ideval/data/1998/ 1998 data index.html.
[31] Y. Meyer, “Orthonormal wavelets,” in Wavelets: Time-Frequency Methods and Phase Space, J. M. Combes, A. Grossman, and P. Tchamitchian, Eds., pp. 21–37, Springer, Berlin, Germany, 1989.
[32] S. Mallat,A Wavelet Tour of Signal Processing, Academic Press, Boston, Mass, USA, 2nd edition, 1999.
[33] L. Ljung,System Identification: Theory for the User, Prentice-Hall, Englewood Cliffs, NJ, USA, 2nd edition, 1999.
[34] F. Murtagh, J. L. Starck, and O. Renaud, “On neuro-wavelet modeling,”Decision Support Systems Journal, vol. 37, no. 4, pp. 475–484, 2004.
[35] B. D. Ripley,Pattern Recognition and Neural Networks, Cam-bridge University Press, CamCam-bridge, UK, 1996.
[36] D. Titterington, A. Smith, and U. Makov,Statistical Analysis of Finite Mixture Distributions, John Wiley & Sons, New York, NY, USA, 1985.
[37] A. P. Dempster, N. M. Laird, and D. B. Rubin, “Maximum likelihood from incomplete data via the EM algorithm (with discussion),”Journal of the Royal Statistical Society B, vol. 39, no. 1, pp. 1–38, 1977.
[38] Editcap, http://www.ethereal.com/docs/man-pages/editcap.1 .html.
[39] Tshark, http://www.wireshark.org/docs/man-pages/tshark .html.
[40] J. E. Gaffney Jr. and J. W. Ulvila, “Evaluation of intrusion detectors: a decision theory approach,” inProceedings of the IEEE Computer Society Symposium on Research in Security and Privacy, pp. 50–61, Oakland, Calif, USA, May 2001.
[41] S. Stolfo, W. Fan, W. Lee, A. Prodromidis, and P. K. Chan, “Cost-based modeling for fraud and intrusion detection results from the JAM project,” Tech. Rep., Columbia Univer-sity, New York, NY, USA, 2000.
[42] M. V. Mahoney and P. K. Chan, “An analysis of the 1999 DARPA/lincoln laboratory evaluation data for net-work anomaly detection,” inProceedings of the 6th Interna-tional Symposium on Recent Advances in Intrusion Detection (RAID ’03), pp. 220–237, Pittsburgh, Pa, USA, September 2003.
[43] J. McHugh, “Testing intrusion detection systems: a critique of the 1998 and 1999 DARPA intrusion detection system evalu-ations as performed by lincoln laboratory,”ACM Transactions on Information and System Security, vol. 3, no. 4, pp. 262–294, 2000.
[44] W. Lu and I. Traore, “A novel unsupervised anomaly detection framework for detecting network attacks in real-time,” in Proceedings of the 4th International Conference on Cryptology and Network Security (CANS ’05), vol. 3810 ofLecture Notes in Computer Science, pp. 96–109, Springer, Xiamen, China, December 2005.
[45] Fred-eZone WiFi ISP,http://www.fred-ezone.ca.
[46] A. Lazarevic, L. Ertoz, V. Kumar, A. Ozgur, and J. Srivastava, “A comparative study of anomaly detection schemes in network intrusion detection,” inProceedings of the 3rd SIAM International Conference on Data Mining (SDM ’03), pp. 108– 120, San Francisco, Calif, USA, May 2003.
[47] M. L. Shyu, S. C. Chen, K. Sarinnapakorn, and L. Chang, “A novel anomaly detection scheme based on principal component classifier,” inProceedings of the IEEE Foundations and New Directions of Data Mining Workshop, pp. 172–179, Melbourne, Fla, USA, November 2003.
[48] W. Lu, An unsupervised anomaly detection framework for multiple-connection based network intrusions, Ph.D. thesis, Department of Electrical and Computer Engineering, Univer-sity of Victoria, Victoria, Canada, October 2005.
[49] CERT Coordination Center, Denial-of-service tools - Advisory CA-1999-17, December 1999, http://www.cert.org/adviso-ries/CA-1999-17.html.