Volume 2007, Article ID 67870,9pages doi:10.1155/2007/67870
Research Article
Compensating Acoustic Mismatch Using Class-Based
Histogram Equalization for Robust Speech Recognition
Youngjoo Suh, Sungtak Kim, and Hoirin Kim
School of Engineering, Information and Communications University, 119 Munjiro, Daejeon 305-732, Yuseong-Gu, South Korea
Received 1 February 2006; Revised 26 November 2006; Accepted 1 February 2007
Recommended by Mark Gales
A new class-based histogram equalization method is proposed for robust speech recognition. The proposed method aims at not only compensating for an acoustic mismatch between training and test environments but also reducing the two fundamental limitations of the conventional histogram equalization method, the discrepancy between the phonetic distributions of training and test speech data, and the nonmonotonic transformation caused by the acoustic mismatch. The algorithm employs multiple class-specific reference and test cumulative distribution functions, classifies noisy test features into their corresponding classes, and equalizes the features by using their corresponding class reference and test distributions. The minimum mean-square error log-spectral amplitude (MMSE-LSA)-based speech enhancement is added just prior to the baseline feature extraction to reduce the corruption by additive noise. The experiments on the Aurora2 database proved the effectiveness of the proposed method by reducing relative errors by 62% over the mel-cepstral-based features and by 23% over the conventional histogram equalization method, respectively.
Copyright © 2007 Youngjoo Suh et al. This is an open access article distributed under the Creative Commons Attribution License, which permits unrestricted use, distribution, and reproduction in any medium, provided the original work is properly cited.
1. INTRODUCTION
The performance of automatic speech recognition (ASR) sys-tems degrades severely when they are employed in acous-tically mismatched environments compared to the training ones. The main cause of this acoustic mismatch is corrup-tion by additive noise and channel distorcorrup-tion, both of which are commonly encountered adverse sources in the real-world ASR applications. To cope with this problem, robust speech recognition has become one of the most crucial issues in the research area of speech recognition. Currently, most ro-bust speech recognition methods can be categorized into the following three areas: signal space, feature space, and model space [1]. Compared to the other two categories, the feature space approach has also been widely employed due to advantages such as easy implementation, low com-putational complexity, and effective performance improve-ments. Acoustic environments corrupted by additive noise and channel distortion act as a nonlinear transformation in the feature spaces of the cepstrum or log-spectrum [2]. Thus, classical linear feature space methods such as cepstral mean subtraction or cepstral mean and variance normal-ization have substantial limitations even though they yield
significant performance improvements under noisy environ-ments [3–5]. Currently, the major feature space approaches to reducing the nonlinear behaviors of the acoustic mismatch are based on the piecewise linear approximation, such as in-teracting multiple model (IMM) [6] and stereo-based piece-wise linear compensation for environments (SPLICE) [7]. Another effective environmental compensation method that transforms observed features is constrained maximum like-lihood linear regression (CMLLR) although it is not strictly based on the feature space. In the related literature [8], its performance was shown to be comparable to those of other linear model space transformation methods. However, like other model space transformation methods, CMLLR also re-quires at least several speech utterances for its reliable esti-mation of the transforesti-mation matrix and it is still classified as a linear transform-based approach.
[10–17]. Moreover, in contrast with most linear transform-based approaches, HEQ is computationally more efficient because its algorithm mostly consists of sorting and search (or table look-up) routines. The role of HEQ is to trans-form test features to reference ones in order to compensate for the acoustic mismatch between the training and test en-vironments by converting the probability density function (PDF) of the original test variable into its reference (or train-ing) PDF. In order to compensate for the acoustic mismatch more effectively, HEQ has two fundamental requirements. First, distributions of phonetic or acoustic classes, defined in the acoustic modeling of speech recognition systems, for both training and test data should be identical or similar to each other [18]. Second, acoustic mismatch should act as a monotonic transformation in the feature space [17]. In other words, the ordering information of phonetic or acoustic classes along each feature axis should not be al-tered by the acoustic mismatch. When these requirements are not kept, the ordering information of phonetic or acous-tic classes in features can be changed by the acousacous-tic mis-match and as a result, the transformation by HEQ can impair class separability of the features. However, in most speech recognition applications, test speech utterances tend to be too short to make their phonetic or acoustic class distribu-tions identical or similar to those of training data. Further-more, corruption by additive noise or channel distortion is considered as a random transformation in the feature space. This random behavior does not always guarantee the mono-tonic transformation. Therefore, the above-mentioned re-quirements are not generally satisfied in real-world speech recognition applications. As a result, it is difficult to take full advantage of HEQ when the conventional HEQ is used to compensate for the acoustic mismatch in noisy environ-ments.
In this paper, we propose a new class-based HEQ tech-nique to reduce these two limitations of the conventional HEQ method. Instead of utilizing global reference and test cumulative distribution functions (CDFs) as in the conven-tional HEQ, the proposed method employs multiple class-based CDFs not only to compensate for the acoustic mis-match between training and test data but also to reduce the limitations of the conventional HEQ. Based on the fact that HEQ is not able to compensate for the adverse effect caused by temporally random behavior of noise, we also in-troduce the minimum mean-square error log-spectral am-plitude (MMSE-LSA)-based speech enhancement technique [19] that is used as a front-end preprocessor to HEQ to fur-ther reduce the acoustic mismatch.
The rest of this paper is organized as follows.Section 2
provides a brief review of the MMSE-LSA-based speech en-hancement algorithm used in this work.Section 3describes the basic algorithm of the conventional HEQ. InSection 4, we present the proposed class-based HEQ technique that re-duces the two limitations of the conventional HEQ for com-pensating for the acoustic mismatch in speech recognition under noisy environments.Section 5describes experimental results of our proposed method. Finally, concluding remarks will be given inSection 6.
2. SPEECH ENHANCEMENT BASED ON MMSE-LSA
HEQ utilizes CDFs of both reference and test data to com-pensate for the acoustic mismatch. Therefore, this method does not take into account specific temporal characteristics of noise but deals with the property of how long-term dis-tributions of noisy speech representations differ from those of clean reference speech ones. Thus, it focuses more on speech than noise in the compensation of the acoustic mis-match. On the contrary, most speech enhancement meth-ods reduce noise components from noisy speech representa-tions by firstly estimating noise characteristics such as noise power or magnitude spectra. In this case, random behaviors of noise are regarded more importantly. From these diff er-ent approaches, we expect that the use of a proper speech en-hancement technique in combination with HEQ will provide additional compensation effects than that of HEQ alone. In this paper, we employ the MMSE-LSA algorithm as a front-end speech enhancement method that is used prior to the feature extraction to additionally compensate for the acous-tic mismatch. A brief review of the MMSE-LSA algorithm is given as follows [19–21].
LetSk(n)=Ak(n)ejϕk(n),Dk(n), andUk(n)=Rk(n)ejϑk(n) be the frequency components of clean speech s(t), addi-tive noise d(t), and noisy speechu(t) at frequency bin in-dexk, time frame indexn, and time sample indext, respec-tively. WhenSk(n) andDk(n) are assumed to be character-ized by separate zero-mean complex Gaussian distributions, the MMSE-LSA estimate of a clean speech spectrum,Ak (n), is obtained by the estimation criterion that minimizes the mean-square error of log-spectral amplitude for given noisy spectrumUk(n) and is given by
Ak(n)= Λk(n)
1 +Λk(n)GMMSE-LSA,k
(n)Rk(n), (1)
whereGMMSE-LSA,k(n) is derived as
GMMSE-LSA,k(n)= ξk(n) 1 +ξk(n)exp
1 2
∞
νk(n) e−τ
τ dτ
, (2)
whereνk(n)=(ξk(n)/(1+ξk(n)))γk(n),γk(n)=R2k(n)/λd,k(n), ξk(n)=ηk(n)/(1−qk(n)),ηk(n)=λs,k(n)/λd,k(n),λs,k(n)= E{|Sk(n)|2} =E{A2
k(n)}, andλd,k(n)=E{|Dk(n)|2}.ηk(n) andγk(n) are calleda priorianda posteriorisignal-to-noise ratios (SNR), respectively.qk(n) is called thea priori proba-bility of speech absence and is fixed to 0.2 for all frequency bins and time frames in this paper.λs,k(n) andλd,k(n) denote power spectral densities of speech and noise, respectively.
The likelihood ratio between speech presence and ab-sence,Λk(n), is defined by
Λk(n)=1−qk(n) qk(n)
expνk(n)
1 +ξk(n)
In our experiments,λd,k(n) is estimated by the mixed deci-sion-based decision-directed approach [22–24] given by
λd,k(n+ 1)
= ⎧ ⎪ ⎪ ⎪ ⎪ ⎪ ⎪ ⎪ ⎪ ⎪ ⎪ ⎪ ⎪ ⎨ ⎪ ⎪ ⎪ ⎪ ⎪ ⎪ ⎪ ⎪ ⎪ ⎪ ⎪ ⎪ ⎩
βλd,k(n) + (1−β)R2
k(n), ifUk(n)∈H0
βλd,k(n)
+(1−β)
ξk(n)
1 +ξk(n)λd,k(n)
+
1 1 +ξk(n)
2 R2
k(n)
, otherwise,
(4)
whereH0is the speech absence hypothesis that is usually de-termined by a voice activity detector andβis a forgetting fac-tor empirically chosen as 0.98.
When the gain function of the estimator is aggressively estimated, enhanced speech signals tend to suffer from sig-nal distortion [25]. On the other hand, in case of underesti-mation, they contain a significant amount of residual noise. Thus, the degree of aggression needs to be chosen carefully to obtain the maximum gain in the sense of speech recognition accuracy. The method to determine the degree of aggression in these experiments is similar to that used in the Aurora ad-vanced front-end noise reduction algorithm [25] except that an empirically chosen fixed value is used in this case.
3. CONVENTIONAL HISTOGRAM EQUALIZATION
Currently, there are two approaches to matching reference and test CDFs in the HEQ-based feature space transforma-tion. The first one is the use of empirical CDFs and the other is the adoption of Gaussianization [26,27]. Although the for-mer approach requires far more parameters and their adap-tation data, its main advantages are that (1) it can bypass the problems associated with choosing the size of the mix-ture models [27] and (2) it is considered as a nonparamet-ric method which does not require any specific assumptions about the probability distribution of modeling data. On the contrary, one merit of the latter approach is that Gaussian-ization of the features can enforce the modeling assump-tion in the HMM-based ASR where the output probabilities are modeled with mixtures of diagonal covariance Gaussians. Here, the main focus of our approach is on the use of mul-tiple classes in the nonlinear feature space transformation. Therefore, we only deal with HEQ utilizing empirical CDFs for CDF matching in this paper and its detailed descriptions are given as follows.
For given random reference and test variablesx and y whose corresponding PDFs are given asPX(x) andPY(y), re-spectively, a transform functionx=F(y) mappingPY(y) into PX(x) can be given as [9,17]
x=F(y)=CX−1
CY(y), (5)
where CX−1(x) is the inverse of reference CDF CX(x) and CY(y) is the test CDF of random variabley, respectively.
Of course, most current speech recognition algorithms utilize multidimensional feature vectors as their feature pa-rameters, where each feature vector consists of a number of coefficients. When the feature parameters are transformed on a multidimensional vector basis, HEQ requires the joint CDF transformation involving Jacobian operations. However, the joint CDF transformation is generally a difficult problem as in [26]. Thus, we make a simplified assumption that the fea-ture coefficients are statistically independent of each other [27]. This assumption is especially acceptable when decor-related filter-bank log-energies [28] or cepstral coefficients are used as recognition features because of their low degree of cross-correlation. Therefore, for the sake of algorithmic simplicity, we only deal with the CDF transformation on a component-by-component basis in this paper.
Another critical issue in HEQ is the reliable estimation of reference and test CDFs. In speech recognition applications, the amount of training data is usually large. Thus, reference CDFs can be estimated quite reliably by computing cumu-lative histograms using training data. However, when short utterances are used as test data, the lengths of such utter-ances may be insufficient for a reliable estimation. In these test environments, the test CDF estimation becomes much more important. When the amount of estimation samples is small, the order-statistic-based CDF estimation is preferred rather than the cumulative histogram-based method and its brief description is as follows [12,16].
Let us define a sequence consisting ofNframes of a par-ticular feature component as
Vl=yl(1),yl(2),. . .,yl(n),. . .,yl(N), (6) where yl(n) denotes thelth feature component at the nth frame.
The order statistics of (6) can be defined as
yl[1]≤ · · · ≤ylrl≤ · · · ≤yl[N], (7) where [rl] represents the original frame index of the feature componenty([rl]) at which its rank is denoted asrlwhen the elements of the sequenceVlare sorted in ascending order.
Then, given test feature component yl(n), the order-statistic-based direct estimate of test CDFs can be defined as
CY(l)
yl(n)=Rl
yl(n)−0.5
N , 1≤l≤L, (8) whereRl(yl(n)) denotes the rank ofyl(n) ranging from 1 to NandLstands for the total dimension of the feature vector.
An estimate of the reference feature component by the conventional HEQ given test feature componentyl(n) is ob-tained as
xl(n)=C−1 X(l) CY(l)
yl(n)=C−1 X(l)
Rlyl(n)−0.5 N
. (9)
4. CLASS-BASED HISTOGRAM EQUALIZATION
4.1. Basic algorithm
The proposed approach for reducing both the acoustic mis-match and the limitations of the conventional HEQ con-sists of utilizing multiple class-specific CDFs at both refer-ence and test sides. To solve these two problems, it divides global distributions defined in the conventional HEQ into sets of multiple class distributions, classifies feature compo-nents into their classes, and then transforms them using their corresponding class CDFs [18]. By this approach, the mis-match of phonetic class distributions can be effectively re-duced because of the increased similarity between the refer-ence and test distributions within the same class. In addition, the global-level nonmonotonic transformation, the second limitation of the conventional HEQ, can be restricted only to a class level only if class information is reliably assigned to each feature coefficient. However, reliably assigning class in-formation to each feature component is a prerequisite condi-tion for ensuring the validity of the proposed HEQ method. In most HEQ methods, the equalization is performed on a component-by-component basis for the sake of algorithmic simplicity as well as reliable CDF estimation. In this sense, the phonetic classification can be also performed on a fea-ture component basis. However, utilizing a feafea-ture vector in-stead of only a specific feature component is more useful in phonetic classification and thus employed in the proposed method. Nevertheless, it may be still a critical problem to accurately classify feature vectors into their corresponding phonetic classes in noisy environments. To cope with such a problem, we use a histogram equalized feature vector in the classification instead of the original noisy feature vector to reduce the adverse effects by additive noise and channel dis-tortion. A detailed description of the proposed class-based HEQ is given as follows.
Let us define a noisy feature vectorWnconsisting ofL -dimensional components at time framenas
Wn=y1(n),y2(n),. . .,yL(n)T, (10)
whereTstands for vector transpose.
Then, phonetic class indexiassigned to noisy feature vec-torWnis obtained as
i=arg min
i d Wn,zi
, 1≤i≤I, (11)
whered(·,·) denotes the Mahalanobis distance measure,zi stands for the centroid of theith class computed by thek -means algorithm,I is the number of classes, andWn is the histogram equalized version ofWnby the conventional HEQ given as follows:
Wn=x1(n),. . .,xL(n)T =C−X(1)1 CY(1)
y1(n),. . .,C−X(L)1 CY(L)
yL(n)T. (12)
4.2. Class-tying technique
According to the basic idea of the class-based HEQ, the lim-itations of the conventional HEQ can be effectively reduced by increasing the number of phonetic classes to a sufficient level, only if the phonetic classification accuracy is suffi -ciently high. However, the phonetic classification accuracy tends to be inevitably decreased in noisy environments. In such noisy conditions, increasing the number of phonetic classes further deteriorates the classification accuracy due to increased class candidates. At the same time, increasing the number of phonetic classes also decreases the amount of clas-sified sample data for each phonetic class, which deteriorates the reliability of test CDF estimation. For these reasons, the performance of the class-based HEQ increases to a certain number of phonetic classes, and then tends to decrease. As a result, we cannot increase the number of phonetic classes arbitrarily to keep the classification accuracy within an al-lowable level and, at the same time, provide more reliable test CDF estimation. To provide higher phonetic classifica-tion accuracy as well as more reliable test CDF estimaclassifica-tion, the class-tying technique is employed so that a number of small similar phonetic untied classes are tied into a larger tied class. The tying rule between small untied classes and a single larger tied class is determined such that the tied class jfor a certain small untied classiis obtained by
j=arg min j d
zi,Zj
, 1≤ j≤J, (13)
whereZj represents the centroid of the jth tied class, each of which is computed by using vector quantization, where all centroids of the small untied classes defined in (11) are used as training sample data. In addition,J (whereJ < I) is the number of tied classes.
Then, the proposed class-based HEQ formulation for given test feature componentyl(n) is defined as
xl(n)=C−1 X(j,l)
CY(j,l)
yl(n)=C−1 X(j,l)
Rj,lyl(n)−0.5
Nj
,
(14)
where, CY(j,l)(y) and Rj,l(y) denote the test CDF and the rank at the jth tied class andlth feature component, respec-tively,Njis the number of frames which are classified as the
jth tied class, andC−1
X(j,l)(x) represents the inverse of refer-ence CDFCX(j,l)(x) which is obtained by the cumulative his-togram computed from all training data of the lth feature components which are classified as the jth tied class by the vector quantization-based phonetic classification.
Noisy speech
u(t) MMSE-LSA Feature extraction
Noisy feature vector
Wn . .
. Global HEQ
Compensated feature vector
Wn . .
. Classification
i
Sequence of noisy feature componentsVl
Compute global CDFCY(l)(·) CX(l)(·) Class-tying
j
Compute class CDFsCY(j,l)(·) CX(j,l)(·) Noisy feature component
yl(n) Class-based HEQ
Compensated feature componentxl(n)
Figure1: Block diagram of the proposed acoustic mismatch compensation method based on the class-based HEQ with the MMSE-LSA-based speech enhancement.
20 19 18 17 16 15
WER
(%)
1 2 3 4 5 6 7 8 9 10
Number of classes No tying
Tying
Figure2: Recognition results of untied/tied class CHEQ compen-sation techniques with regard to various numbers of classes on the Aurora 2 task (clean-condition training).
the conventional HEQ from the fact that it uses global refer-ence and test CDFs.
5. EXPERIMENTAL RESULTS
5.1. Speech database and feature extraction
In the performance evaluation, the Aurora2 database which is converted from the TI-DIGITS database is used. Only clean speech data are used in the training of all experiments (i.e., clean-condition training). Test sets A and B, each containing four kinds of additive noises, and test set C, contaminated by two kinds of additive noises and different channel distortion (MIRS), are chosen in the test. The MMSE-LSA-based speech enhancement (SE) technique is applied at the signal space. In SE, a 25 millisecond long Hamming window is applied to noisy speech signals with an interval of 10 millisecond. FFT with 256 points is used for spectral analysis. Enhanced
speech signals reconstructed by the overlap-add method are then used for feature extraction.
The feature extraction procedure is conducted based on the ETSI Aurora formula as follows. First, speech signals are blocked into a sequence of frames, each with 25 millisecond length and 10 millisecond interval. Next, speech frames are pre-emphasized with a factor of 0.97 and then a Hamming window is applied to each speech frame. From a set of 23 scaled filter-bank log-energies, the 39-dimensional mel-frequency cepstral coefficient (MFCC)-based feature vector consisting of 12 MFCCs, the log-energy, and their first and second derivatives is extracted. Prior to the derivative com-putations, the 22-order cepstral liftering is applied to the static MFCCs. Each digit-based hidden Markov model con-sists of 16 states and each state has 3 mixtures. The number of histogram bins in reference CDFs was chosen as 64 in both conventional HEQ (HEQ) and class-based HEQ (CHEQ) be-cause its further increase did not show any meaningful per-formance improvements. The tied class parameters, I and J, are empirically set to 60 and 6, respectively, based on the experimental results shown in Figure 2. The equaliza-tion is conducted on each component of the 39-dimensional MFCCs for both training and test data on an utterance-by-utterance basis.
5.2. Speech recognition results
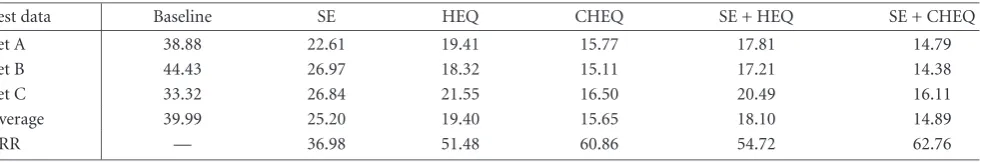
Table1: Average WERs (%) of various acoustic compensation techniques on the Aurora2 task (clean-condition training, averaged between 0–20 dB SNRs).
Test data Baseline SE HEQ CHEQ SE + HEQ SE + CHEQ
Set A 38.88 22.61 19.41 15.77 17.81 14.79
Set B 44.43 26.97 18.32 15.11 17.21 14.38
Set C 33.32 26.84 21.55 16.50 20.49 16.11
Average 39.99 25.20 19.40 15.65 18.10 14.89
ERR — 36.98 51.48 60.86 54.72 62.76
number, the performance improvement seems marginal for the untied-CHEQ case. However, further improvements are still obtained for the tied-CHEQ case. From this figure, it is well observed that CHEQ is very effective in improving recognition performance compared to HEQ and the tied class technique provides an additional gain with a maximum error-rate reduction (ERR) of 4.65%. However, as mentioned inSection 4.2, we also notice that the recognition accuracy tends to deteriorate for more phonetic classes than those pro-ducing the best performance, mainly due to the decreased phonetic classification accuracy in noisy environment.
Table 1presents the recognition results obtained by us-ing the baseline feature (i.e., MFCC) and compensation tech-niques each of which is applied alone or in combination with one of the other methods under clean-condition training. In the experiments, MMSE-LSA-based SE was applied only to test data while HEQ and CHEQ are applied to both training and test data. For all test sets, all of the three compensation methods reduce relative errors by more than 30% even in the case that each technique is used alone. It is also observed that HEQ is far more effective than SE. In addition, CHEQ offers substantial improvements over HEQ by an ERR of 19%. Ap-plying SE to HEQ and CHEQ produces slight improvements by ERRs of 6% and 4%, respectively, indicating that MMSE-LSA-based SE and histogram equalization do not act as fully additive each other when they are used together in compen-sating for the acoustic mismatch. In this case, CHEQ with SE provides less improvement than HEQ with SE. This may be due to the fact that major causes of the nonmonotonic transformation can be effectively removed as the preproces-sor SE reduces noise. The addition of SE produces substan-tial improvements for test sets A and B but offers marginal error reduction for test set C. These results comply with the fact that the MMSE-LSA-based SE is only effective in reduc-ing additive noise and has less capability of cancelreduc-ing the channel distortion. It is also noted that the performance im-provements by HEQ-based compensation methods on test set C are less than those on test sets A and B. These results mean that the compensation techniques are not as effective for acoustic environments suffering from both additive noise and channel distortion together as those containing additive noise only. Nevertheless, when we compare recognition re-sults for CHEQ with those for SE and HEQ, we still observe that the degradation on test set C by CHEQ is much less than those by SE or HEQ. More complex acoustic environments including additive noise and channel distortion together tend to have higher possibilities for the nonmonotonic
transfor-mation than those presenting only additive noise. In these acoustic environments, reduced degradation in recognition accuracy by CHEQ implies that the ability of CHEQ to re-duce the nonmonotonic transformation is its discriminative superiority compared to HEQ.
Table 2throughTable 7show detailed recognition results when the baseline MFCC feature or compensated features by various compensation techniques are used. It is observed that SE reduces errors moderately for all types of noises and different channel environments while slight degradations are found for the clean condition. However, large variations of average WERs for different noise types imply weak noise ro-bustness of SE. On the contrary, HEQ provides larger error reduction than SE for the same kinds of noises and channel environments. It even reduces errors for the clean condition. Smaller variation of average WERs for different noise types in HEQ indicates its relative robustness over various noise con-ditions and confirms its merit that HEQ does not require any assumptions on noise characteristics. Finally, CHEQ offers the largest error reduction of all three compensation meth-ods. It seems especially useful for the noise types of car, air-port, street, and station but relatively less effective in those of babble, exhibition, and restaurant. The former noises are largely related to the engine noise, while the latter contain human speech-like noises considerably. We think the less effectiveness of CHEQ on the human speech-like noises is mainly a result of the lower phonetic classification accuracy at this category of noises. However, the relatively small varia-tion of average WERs by CHEQ for different kinds of noises implies its invariant effectiveness over various noises. From
Table2: Recognition results of the baseline feature (MFCC) on the Aurora2 task under clean-condition training (WER %).
SNR Set A Set B Set C
Subway Babble Car Exhib. Avg. Rest. Street Airport Station Avg. Subway Street Avg.
Clean 1.17 1.03 1.19 0.86 1.06 1.17 1.03 1.19 0.86 1.54 0.98 1.03 1.01
20 dB 3.04 10.04 3.16 3.80 5.01 10.81 4.23 9.93 5.62 3.50 5.53 4.81 5.17
15 dB 7.09 26.57 10.47 8.15 13.07 25.61 11.73 23.11 16.38 5.00 12.37 10.31 11.34
10 dB 21.28 50.94 33.76 24.90 32.72 47.28 33.25 46.85 40.39 9.21 24.81 24.73 24.77
5 dB 46.61 72.97 66.51 56.49 60.65 70.43 61.85 69.31 70.26 20.51 47.16 51.15 49.16
0 dB 72.70 88.27 86.73 84.02 82.93 88.30 81.32 84.16 87.75 44.70 73.99 78.36 76.18
−5 dB 87.38 95.04 91.65 92.35 91.61 95.00 89.93 91.89 91.51 77.24 87.90 89.30 88.60
Avg. 30.14 49.76 40.13 35.47 38.88 48.49 38.48 46.67 44.08 44.43 32.77 33.87 33.32
Table3: Recognition results of the SE compensation technique on the Aurora 2 task under clean-condition training (WER %).
SNR Set A Set B Set C
Subway Babble Car Exhib. Avg. Rest. Street Airport Station Avg. Subway Street Avg.
Clean 1.63 1.81 1.79 1.48 1.68 1.63 1.81 1.79 1.48 98.37 1.63 1.72 1.68
20 dB 2.86 3.11 2.33 4.38 3.92 3.84 2.90 3.55 3.18 96.16 4.21 3.66 3.94
15 dB 4.97 7.19 2.98 6.11 7.07 9.21 4.93 6.95 5.37 90.79 8.14 7.04 7.59
10 dB 9.58 17.74 6.98 11.82 14.87 20.85 10.43 17.30 11.88 79.15 18.67 16.90 17.79
5 dB 25.76 43.02 22.34 27.21 29.19 45.47 29.72 41.07 33.66 54.53 41.11 35.67 38.39
0 dB 55.97 78.45 62.51 56.87 54.18 78.32 64.45 74.74 71.52 21.68 70.00 63.03 66.52
−5 dB 82.71 95.80 89.08 85.75 79.08 96.84 86.61 92.93 91.89 3.16 85.82 83.92 84.87
Avg. 19.83 29.90 19.43 21.28 22.61 31.54 22.49 28.72 25.12 26.97 28.43 25.26 26.84
Table4: Recognition results of the HEQ compensation technique on the Aurora 2 task under clean-condition training (WER %).
SNR Set A Set B Set C
Subway Babble Car Exhib. Avg. Rest. Street Airport Station Avg. Subway Street Avg.
Clean 1.14 1.00 0.92 0.96 1.01 1.14 1.00 0.92 0.96 1.01 1.07 1.09 1.08
20 dB 3.44 2.36 2.62 3.92 3.09 2.82 2.63 2.54 3.02 2.75 3.84 2.81 3.33
15 dB 6.69 4.38 4.59 7.07 5.68 4.85 4.75 4.35 5.25 4.80 6.66 5.35 6.01
10 dB 11.39 9.10 9.60 14.87 11.24 10.10 9.70 9.01 10.80 9.90 13.72 12.61 13.17
5 dB 23.24 23.22 23.23 29.19 24.72 22.54 23.00 21.92 24.44 22.98 28.86 26.63 27.75
0 dB 48.66 53.93 52.49 54.18 52.32 49.80 50.97 50.10 53.72 51.15 59.01 55.99 57.50
−5 dB 78.29 82.04 80.44 79.08 79.96 80.04 80.74 79.96 80.59 80.33 84.03 81.41 82.72
Avg. 18.68 18.60 18.51 21.85 19.41 18.02 18.21 17.58 19.45 18.32 22.42 20.68 21.55
Table5: Recognition results of the CHEQ compensation technique on the Aurora 2 task under clean-condition training (WER %).
SNR Set A Set B Set C
Subway Babble Car Exhib. Avg. Rest. Street Airport Station Avg. Subway Street Avg.
Clean 1.54 1.39 1.40 1.60 1.48 1.54 1.39 1.40 1.60 1.48 1.38 1.54 1.46
20 dB 3.56 2.75 2.45 4.07 3.21 3.50 2.78 2.65 3.05 3.00 3.19 2.57 2.88
15 dB 6.14 4.84 3.67 6.08 5.18 5.00 4.66 4.77 4.91 4.84 5.50 3.99 4.75
10 dB 9.73 9.79 7.37 11.72 9.65 9.21 8.71 6.98 8.15 8.26 10.99 9.31 10.15
5 dB 18.76 20.22 16.25 22.77 19.50 20.51 18.20 17.89 17.59 18.55 22.08 19.26 20.67
0 dB 38.99 45.83 37.52 42.92 41.32 44.70 39.03 40.05 39.80 40.90 45.29 42.78 44.04
−5 dB 71.63 76.63 70.15 70.01 72.11 77.24 70.71 70.92 71.34 72.55 75.84 74.00 74.92
Table6: Recognition results of the SE + HEQ compensation technique on the Aurora 2 task under clean-condition training (WER %).
SNR Set A Set B Set C
Subway Babble Car Exhib. Avg. Rest. Street Airport Station Avg. Subway Street Avg.
Clean 1.26 1.21 1.25 1.17 1.22 1.26 1.21 1.25 1.17 1.22 1.38 1.12 1.25
20 dB 3.25 2.57 2.39 3.61 2.96 2.58 2.72 2.30 2.78 2.60 2.98 2.57 2.78
15 dB 5.68 4.20 3.49 6.17 4.89 4.94 4.26 3.97 4.97 4.54 5.80 4.56 5.18
10 dB 10.25 8.19 8.62 12.31 9.84 9.46 8.68 8.05 9.13 8.83 12.04 10.85 11.45
5 dB 21.15 21.80 20.49 26.26 22.43 22.29 20.68 20.34 21.60 21.23 27.14 25.09 26.12
0 dB 45.96 52.48 47.57 49.77 48.95 48.63 48.22 47.93 50.60 48.85 58.70 55.17 56.94
−5 dB 77.74 83.28 82.02 79.20 80.56 80.87 79.44 81.24 81.52 80.77 83.48 80.96 82.22
Avg. 17.26 17.85 16.51 19.62 17.81 17.58 16.91 16.52 17.82 17.21 21.33 19.65 20.49
Table7: Recognition results of the SE + CHEQ compensation technique on the Aurora 2 task under clean-condition training (WER %).
SNR Set A Set B Set C
Subway Babble Car Exhib. Avg. Rest. Street Airport Station Avg. Subway Street Avg.
Clean 1.57 1.60 1.76 1.42 1.59 1.57 1.60 1.76 1.42 1.59 1.41 1.48 1.45
20 dB 3.32 2.51 2.24 3.36 2.86 2.76 2.99 2.30 2.50 2.64 2.73 2.33 2.53
15 dB 5.56 4.56 2.89 5.49 4.63 5.43 4.53 3.85 4.57 4.60 5.10 3.99 4.54
10 dB 9.46 7.80 6.32 10.49 8.52 8.54 8.10 6.74 7.56 7.74 9.86 8.98 9.42
5 dB 18.27 17.84 15.09 22.00 18.30 19.34 16.78 16.67 16.78 17.39 21.09 18.68 19.89
0 dB 37.64 43.83 35.19 42.02 39.67 43.60 38.48 37.31 38.75 39.54 46.64 41.72 44.18
−5 dB 68.77 76.51 69.82 69.58 71.17 77.40 69.89 72.00 70.60 72.47 74.61 73.88 74.25
Avg. 14.85 15.31 12.35 16.67 14.79 15.93 14.18 13.37 14.03 14.38 17.08 15.14 16.11
6. CONCLUSION
As a feature space compensation approach for robust speech recognition, the conventional HEQ technique can be eff ec-tively utilized to compensate for the acoustic mismatch be-tween training and test environments. However, the conven-tional HEQ has two fundamental limitations caused by the mismatch of phonetic class distributions between training and test data and by the nonmonotonic transformation re-sulted from the acoustic mismatch. In this paper, to deal with these two problems, a class-based HEQ method is proposed, which not only compensates for the acoustic mismatch but also reduces the limitations of the conventional HEQ by di-viding reference and test CDFs into sets of multiple class-specific distributions and then equalizing noisy features on the class basis. For higher phonetic classification accuracy as well as more reliable test CDF estimation in CHEQ, a class-tying technique is employed. In addition, to reduce the acoustic mismatch caused by additive noise, the MMSE-LSA-based speech enhancement is added prior to CHEQ. The experimental results showed the effectiveness of CHEQ by producing EERs of 60% over MFCC and 19% over the con-ventional HEQ, respectively. The addition of SE to CHEQ produces an additional improvement by an ERR of 4% over CHEQ alone. Moreover, the experimental results strongly imply that the nonmonotonic transformation caused by the acoustic mismatch acts as the major limitation of the con-ventional HEQ.
REFERENCES
[1] A. Sankar and C.-H. Lee, “A maximum-likelihood approach to stochastic matching for robust speech recognition,”IEEE Transactions on Speech and Audio Processing, vol. 4, no. 3, pp. 190–202, 1996.
[2] X. Huang, A. Acero, and H.-W. Hon,Spoken Language Process-ing: A Guide to Theory, Algorithm, and System Development, Prentice-Hall, Englewood Cliffs, NJ, USA, 2001.
[3] A. E. Rosenberg, C.-H. Lee, and F. K. Soong, “Cepstral chan-nel normalization techniques for HMM-based speaker veri-fication,” inProceedings of the 3rd International Conference on Spoken Language Processing (ICSLP ’94), pp. 1835–1838, Yoko-hama, Japan, September 1994.
[4] O. Viikki and K. Laurila, “Cepstral domain segmental fea-ture vector normalization for noise robust speech recogni-tion,”Speech Communication, vol. 25, no. 1–3, pp. 133–147, 1998.
[5] C. Kermorvant, “A comparison of noise reduction tech-niques for robust speech recognition,” IDIAP Research Report IDIAP-RR 99-10, IDIAP Research Institute, Martigny, Switzer-land, July 1999.
[6] N. S. Kim, Y. J. Kim, and H. Kim, “Feature compensation based on soft decision,”IEEE Signal Processing Letters, vol. 11, no. 3, pp. 378–381, 2004.
[8] M. J. F. Gales, “Maximum likelihood linear transformations for HMM-based speech recognition,” Computer Speech and Language, vol. 12, no. 2, pp. 75–98, 1998.
[9] R. C. Gonzalez and R. E. Woods,Digital Image Processing, Prentice-Hall, Englewood Cliffs, NJ, USA, 2002.
[10] S. Dharanipragada and M. Padmanabhan, “A nonlinear unsu-pervised adaptation technique for speech recognition,” in Pro-ceedings of the 6th International Conference on Spoken Language Processing (ICSLP ’00), vol. 4, pp. 556–559, Beijing, China, Oc-tober 2000.
[11] F. Hilger and H. Ney, “Quantile based histogram equalization for noise robust speech recognition,” inProceedings of the 7th European Conference on Speech Communication and Technol-ogy (EUROSPEECH ’01), pp. 1135–1138, Aalborg, Denmark, September 2001.
[12] G. Saon and J. M. Huerta, “Improvements to the IBM Aurora 2 multi-condition system,” inProceedings of the 7th Interna-tional Conference on Spoken Language Processing (ICSLP ’02), pp. 469–472, Denver, Colo, USA, September 2002.
[13] S. Molau, F. Hilger, D. Keysers, and H. Ney, “Enhanced his-togram normalization in the acoustic feature space,” in Pro-ceedings of the 7th International Conference on Spoken Language Processing (ICSLP ’02), pp. 1421–1424, Denver, Colo, USA, September 2002.
[14] S. Molau, F. Hilger, and H. Ney, “Feature space normalization in adverse acoustic conditions,” inProceedings of IEEE Inter-national Conference on Acoustics, Speech and Signal Processing (ICASSP ’03), vol. 1, pp. 656–659, Hong Kong, April 2003. [15] F. Hilger,Quantile based histogram equalization for noise robust
speech recognition, Ph.D. thesis, RWTH, Aachen-University of Technology, Aachen, Germany, 2004.
[16] J. C. Segura, C. Ben´ıtez, ´A. de La Torre, A. J. Rubio, and J. Ram´ırez, “Cepstral domain segmental nonlinear feature trans-formations for robust speech recognition,”IEEE Signal Pro-cessing Letters, vol. 11, no. 5, pp. 517–520, 2004.
[17] ´A. de La Torre, A. M. Peinado, J. C. Segura, J. L. P´erez-C ´ordoba, M. P´erez-C. Ben´ıtez, and A. J. Rubio, “Histogram equaliza-tion of speech representaequaliza-tion for robust speech recogniequaliza-tion,”
IEEE Transactions on Speech and Audio Processing, vol. 13, no. 3, pp. 355–366, 2005.
[18] Y. Suh and H. Kim, “Class-based histogram equalization for robust speech recognition,”ETRI Journal, vol. 28, no. 4, pp. 502–505, 2006.
[19] Y. Ephraim and D. Malah, “Speech enhancement using a min-imum mean-square error log-spectral amplitude estimator,”
IEEE Transactions on Acoustics, Speech, and Signal Processing, vol. 33, no. 2, pp. 443–445, 1985.
[20] Y. Ephraim and D. Malah, “Speech enhancement using a min-imum mean-square error short-time spectral amplitude esti-mator,”IEEE Transactions on Acoustics, Speech, and Signal Pro-cessing, vol. 32, no. 6, pp. 1109–1121, 1984.
[21] H. Kim and R. C. Rose, “Cepstrum-domain acoustic feature compensation based on decomposition of speech and noise for ASR in noisy environments,”IEEE Transactions on Speech and Audio Processing, vol. 11, no. 5, pp. 435–446, 2003. [22] Y. D. Cho, K. Al-Naimi, and A. Kondoz, “Mixed
decision-based noise adaptation for speech enhancement,”Electronics Letters, vol. 37, no. 8, pp. 540–542, 2001.
[23] N. S. Kim and J.-H. Chang, “Spectral enhancement based on global soft decision,” IEEE Signal Processing Letters, vol. 7, no. 5, pp. 108–110, 2000.
[24] I. Cohen, “Speech enhancement using a noncausal a priori SNR estimator,”IEEE Signal Processing Letters, vol. 11, no. 9, pp. 725–728, 2004.
[25] Final draft ETSI ES 202 050 V1.1.1, “Speech Processing, Trans-mission and Quality aspects (STQ); Distributed speech recog-nition; advanced front-end feature extraction algorithm; com-pression algorithms,” ETSI, June 2002.
[26] S. S. Chen and R. A. Gopinath, “Gaussianization,” in Pro-ceedings of Advances in Neural Information Processing Systems (NIPS ’00), pp. 423–429, Denver, Colo, USA, December 2000. [27] G. Saon, S. Dharanipragada, and D. Povey, “Feature space gaussianization,” inProceedings of IEEE International Confer-ence on Acoustics, Speech and Signal Processing (ICASSP ’04), vol. 1, pp. 329–332, Montreal, Que, Canada, May 2004. [28] C. Nadeu, D. Macho, and J. Hernando, “Time and frequency
filtering of filter-bank energies for robust HMM speech recog-nition,”Speech Communication, vol. 34, no. 1-2, pp. 93–114, 2001.
Youngjoo Suhwas born in Korea in 1969 and received the B.S. and M.S. degrees in electronics engineering from Kyungpook National University, Korea, in 1991 and 1993, respectively. He received the Ph.D. de-gree from the School of Engineering, Infor-mation and Communications University, Korea, in 2006. From 1993 to 1998, he was a Researcher in the Spoken Language Process-ing Lab. at the Electronics and
Telecommu-nications Research Institute (ETRI), Korea. In 1999, he served as an Invited Professor at Yeungjin College, Korea. From 2000 to 2002, he worked as a Team Manager at Corevoice Inc., Korea. Since Septem-ber 2006, he has been a Postdoctoral Researcher at Information and Communications University. His research interests include robust speech recognition and speech enhancement.
Sungtak Kim received the B.S. degree in electronics engineering from Ulsan Uni-versity and the M.S. degree in multime-dia communications and processing from Information and Communications Univer-sity, Korea, in 2000 and 2003, respectively. He is currently pursuing the Ph.D. degree in multimedia communications and process-ing at Information and Communications University. His research interests are robust speech recognition and speaker recognition.
Hoirin Kimwas born in Seoul, Korea, in 1961. He received the M.S. and Ph.D. de-grees from the Department of Electrical and Electronics Engineering, KAIST, Korea, in 1987 and 1992, respectively. From Octo-ber 1987 to DecemOcto-ber 1999, he has been a Senior Researcher in the Spoken Lan-guage Processing Lab. at the Electronics and Telecommunications Research Institute (ETRI). From June 1994 to May 1995, he