R E S E A R C H
Open Access
Automatic modulation classification of digital
modulations in presence of HF noise
Hazza Alharbi
3*, Shoaib Mobien
2, Saleh Alshebeili
1,2,3and Fahd Alturki
3Abstract
Designing an automatic modulation classifier (AMC) for high frequency (HF) band is a research challenge. This is due to the recent observation that noise distribution in HF band is changing over time. Existing AMCs are often designed for one type of noise distribution, e.g., additive white Gaussian noise. This means their performance is severely compromised in the presence of HF noise. Therefore, an AMC capable of mitigating the time-varying nature of HF noise is required. This article presents a robust AMC method for the classification of FSK, PSK, OQPSK, QAM, and amplitude-phase shift keying modulations in presence of HF noise using feature-based methods. Here, extracted features are insensitive to symbol synchronization and carrier frequency and phase offsets. The proposed AMC method is simple to implement as it uses decision-tree approach with pre-computed thresholds for signal classification. In addition, it is capable to classify type and order of modulation in both Gaussian and non-Gaussian environments.
Keywords:Automatic modulation classification, Feature-based classification, Bi-kappa noise, HF communications
Introduction
State-of-the-art digital communications and signal pro-cessing techniques have caused a major resurgence in high frequency (HF) communication systems by redu-cing equipment size, improving communication reliabil-ity, and shortening the deployment time. Therefore, these systems provide a cost effective and versatile solu-tion for long-haul communicasolu-tions which can be used in a wide variety of civilian and military scenarios, e.g., nation-wide emergency communication during natural disaster, war-zone communications, electronic surveil-lance, remote area monitoring, etc. Numerous scenario-specific standardized waveforms exist for HF radios depending on the required data rate and available transmit bandwidth [1]. An HF radio capable of com-municating using all the standardized waveforms is de-sirable as it brings interoperability, flexibility, and cost efficiency. A software-defined radio (SDR) allows an HF radio to communicate using multiple standards. An automatic modulation classifier (AMC) is an essential part of a multi-standard communication system as it
allows blind detection of the modulation schemes present in the received signal. However, designing an AMC for HF systems is not a trivial task, as the trans-mit signal is severely distorted due to ionospheric effects, multipath propagation, and non-Gaussian time-varying noise [2-4]. The non-Gaussian and time-time-varying nature of HF noise is a recent observation [3]. It has been noted in [4] that the HF noise follows Gaussian (G) or Bi-kappa (BK) distributions depending on day time. A BK distribution function is defined mathemat-ically as [3]
p xð ;kÞ ¼ 1 2pffiffiffiffiffiffiπσ 1þ
x2 kσ2
k
k>0 1
2pffiffiffiffiffiffiπσ k¼0 1
2pffiffiffiffiffiffiπσ 1 x2 kσ2
k
k<0 8
> > > > > > > < > > > > > > > :
ð1Þ
where σ and k are the shaping parameter and tuning factor, respectively. Practical values of these parameters areσ = 46,k= 1.1 andσ = 20,k=1 [3].
Till now, designing AMC algorithms in presence of non-Gaussian noise has not received sufficient attention. The reason is that Gaussianity assumption often matches the observed statistical characteristics of channel noise.
* Correspondence:[email protected] 3
Electrical Engineering Department, King Saud University, Riyadh, Saudi Arabia
Full list of author information is available at the end of the article
However, for HF channel the case is different as the noise is better described by a model fluctuating between G and BK distributions. Therefore, this new noise model must be considered during the development of an AMC for HF band. Existing AMC methods (that assume G noise only) are grouped into two categories: likelihood based (LB) and feature based (FB) methods. LB methods have two steps: calculating the likelihood function of the received signal for all candidate modulations, and then using maximum likelihood ratio test for decision-making [5]. In FB methods, features are first extracted from the received signal and then applied to a classifier in order to recognize the modulation type and possibly its order.
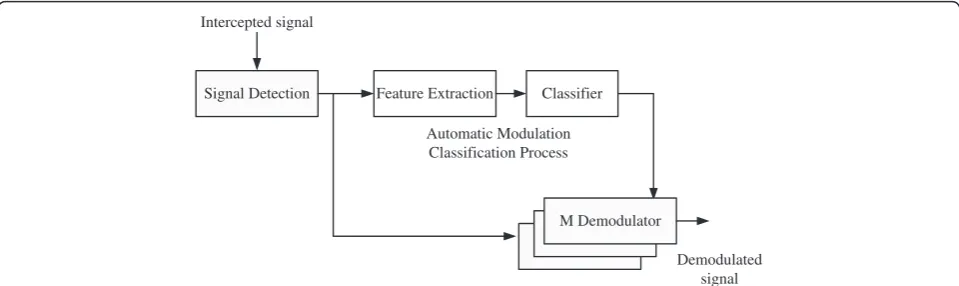
Figure 1 shows the block diagram of FB methods in an SDR. The front-end of SDR is the signal detection block which identifies a signal transmission [6]. This block is followed by an AMC which contains a feature extractor and a classifier.An overwhelming number of proposed features exist in AMC literature. Some of the most popular features include instantaneous amplitude, phase, and frequency [7-9], statistical features such as higher order moments and cumulants [10-13], wavelets [14-18], spectral peaks [19], etc. The classifier block makes use of extracted features to identify signal modulation by ap-plying a fixed threshold, or alternatively using a pattern recognition technique, such as artificial neural networks [20-22] or support vector machines [18]. If the feature set is carefully selected, FB methods are more robust and offer low processing complexity. For more details about AMC methods with a comprehensive literature re-view, the reader is referred to [5,23].
Attempts to classify signals in HF noise have been reported in the literature. In [24-26], entropic distance feature has been exploited for a classification of constant envelope digital signals, such as PSK and FSK modula-tions. In [26], this feature has been further explored for signals propagating via multiple ionospheric modes with co-channel interference and non-Gaussian noise for dif-ferent types of PSK and FSK modulations. The basic idea
of entropic distance is to compress the received signal using a compression algorithm and use the compression ratio as entropy measure of the received signal of an un-known modulation type. Therefore, normalized entropic distance can be used to classify different modulation schemes. It is also demonstrated in [24,26] that entropic distance is a useful feature in separating narrow band as well as wide band FSK modulations. Its robustness against parameters variations such as quantization reso-lution, signal length, and compression algorithm is also verified.
Motivated by the observations noted in [4], effect of BK distribution on AMC design has been investigated in [27,28]. The results in [27] show that the performance of an AMC algorithm designed for G noise model signifi-cantly deteriorates in presence of BK noise, specifically at low signal-to-noise ratio (SNR). In addition, the inves-tigation in [28] shows that it is possible to design fea-tures that are reasonably robust in presence of HF noise. The objective in this article is to develop a new deci-sion tree-based AMC algorithm well-suited for the clas-sification of most popular single carrier modulations used in HF communication systems, i.e., 2FSK, 4FSK, 8FSK, 2PSK, 4PSK, 8PSK, 16QAM, 32QAM, 64QAM, 16 amplitude-phase shift keying (APSK), and 32APSK [1]. APSK is a digital modulation scheme that can be considered as a class of QAM in which symbols are al-ways placed on equidistant concentric circles in the con-stellation diagram. This modulation scheme is known to have fewer problems with nonlinear amplifiers due to its constellation shape [29].
To achieve the above objective, the following features are considered: the maximum value of power spectral density (PSD) of normalized-centered instantaneous amplitude, the maximum value of magnitude of discrete fourier transform (DFT) of kth power of received signal (Γk), and number of points in pre-defined ranges of par-titioned signal constellation magnitude. The first feature is well known in the literature [7-9]. The second feature
Intercepted signal
Signal Detection Feature Extraction Classifier
Automatic Modulation Classification Process
M Demodulator
Demodulated signal
with k = 2, 4 has previously been proposed in [30] for blind estimation of frequency offset of PSK and QAM signals and in [31] for the classification of MPSK modu-lations. The third feature is new; it is based on counting the number of points of the magnitude of received signal constellation in a certain predefined range. This feature has a desirable property in that its value remains almost constant even when the noise model gets changed from Gaussian distribution to BK distribution. Another im-portant property of this feature is its low computational cost, as it only requires addition and comparison opera-tions. It is worth noting that all three features are in-sensitive to symbol synchronization and carrier frequency and phase offsets.
The rest of the article is organized as follows. A uni-fied mathematical model for all the modulation schemes under consideration is presented in Section 2. The pro-posed AMC and its computational complexity are detailed out in Section 3. Simulation results are pre-sented and discussed in Section 4. Finally, conclusions are drawn in Section 5.
Signal model
The general form of received signal encompassing all modulation schemes under consideration is given by [32]
r tð Þ ¼Re αej2πϕej2△ftC tð Þej2πfc tðt0Þ
n o
þn tð Þ ð2Þ
where C(t) is the complex envelope of the modulated signal, n(t) is a band-limited noise, fc is the carrier
fre-quency,αis the channel amplitude,ϕis the phase offset, Δf is the carrier frequency offset, and Re{.} denotes the real part. The complex envelope is characterized by the constellation pointsCi, signal powerP, and pulse shaping functionp(t). ForNsymbols with periodicityT, the gen-eral form of the complex envelope can be expressed as
C tð Þ ¼ΣN
i¼1Cip tð iTÞ ð3Þ
In practice,p(t) is often root-raised cosine with roll-off factor (ρ) ranging between 0.2 and 0.5 [33-36]. For FSK modulation, rectangular pulse shape is commonly used [1]. The constellation points of digital modulation of
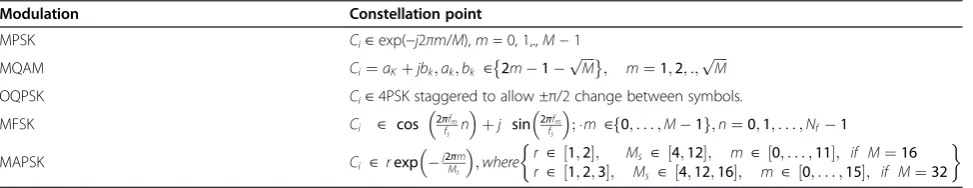
order M considered in this article are given in Table 1 (in Table 1, fs is the sampling frequency and Nf is the
number of samples within one MFSK symbol duration); see also [9].
The noise term is often constructed by passing the BK/G noise through a limiting filter [9]. The band-width of this filter is set to 3 kHz for HF channel [37]. This filter is used in practice to minimize the transmis-sion bandwidth. The SNR at the output of band-limiting filter is adjusted to the desired value by multiplying the noise term by a scaling factor,β.That is [9]
β¼
ffiffiffiffiffiffiffiffiffiffiffiffiffiffiffiffiffiffiffiffiffiffiffiffiffiffi P
N010 SNR=
=20
r
ð4Þ
whereN0is the noise power and SNR is in dB.
The proposed AMC
The proposed AMC features
The proposed features and classification mechanism are described next. The presentation in this section is sup-ported by simulation results conducted with parameters as described in Table 2, and averaged over 100 inde-pendent realizations. The frequency offset is set at 100 Hz and roll-off factor ρ = 0.35. If different, results are presented for both G and BK noise models, otherwise results of BK noise model are only displayed.
The maximum value of PSD of normalized-centered instantaneous amplitude
This feature is expressed mathematically as [9]
γmax¼
maxjDFT acnð ð Þn Þj2
Ns ð5Þ
where Ns is the number of samples,acn(n) = a(n)/ma−
1,a(n) is the absolute value of the analytic form of the received signal, and mais its sample mean. This feature classifies PSK modulations as one group, and FSK and OQPSK modulations as another group. Figure 2 shows feature values against SNR (in dB) for PSK, FSK, and OQPSK signals. The figure also shows the mean value of feature (solid line) ± its standard deviation (dotted line). This will help in determining the bounds for feature variation. Note that we only display bounds (mean ± its
Table 1 Constellation points of digital modulation schemes
Modulation Constellation point
MPSK Ci∈exp(−j2πm/M),m= 0, 1,.,M−1
MQAM Ci¼aKþjbk;ak;bk ∈ 2m1 ffiffiffiffi
M
p
; m¼1;2; :;pffiffiffiffiM
OQPSK Ci∈4PSK staggered to allow ±π/2 change between symbols.
MFSK Ci ∈ cos 2πffm
s n
þj sin 2πfm fs
;⋅m ∈f0;. . .;M1g;n¼0;1;. . .;Nf1
MAPSK Ci ∈ rexp j2Mπms
;where r ∈ ½1;2; Ms ∈ ½4;12; m ∈ ½0;. . .;11; if M¼16
standard deviation) for the modulations that are critical for determining the thresholds. For the sake of clarity, the same color has been used for both the bound and the mean that belong to a particular modulation. As Figure 2 shows, the final classification of the modula-tions is achieved using a pre-computed threshold which separates PSK from FSK and OQPSK modulations.
The maximum value of DFT magnitude of the kth power of analytic form of received signal
This feature is defined as follows [30,31].
Γk¼
maxDFT a ið Þk
2
Ns ð6Þ
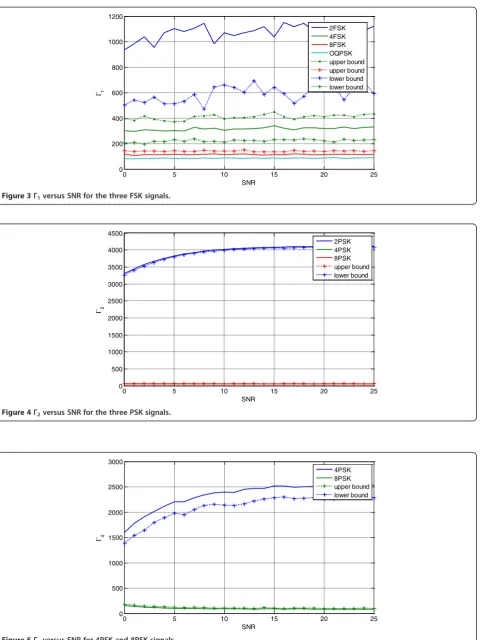
Three values of parameter k are used in this article, i.e., k = 1, 2, and 4. The three FSK modulation orders are classified using Γ1. Since the input signal power is
equally distributed among all FSK tones, therefore for a certain fixed duration of the received signal the feature value is highest for 2FSK and lowest for 8FSK and OQPSK. As a result, 2FSK, 4FSK, and group of 8FSK and OQPSK can be discriminated using two threshold values. The values of this feature against SNR are shown in Figure 3. Also, the upper and lower bounds for both thresholds are shown as dotted lines.
The feature Γk with k= 2 and 4 is utilized to classify the three individual PSK modulations in two stages. In the first stage, 2PSK is separated from 4PSK and 8PSK by using Γ2, whereas in the second stage 4PSK is
sepa-rated from 8PSK modulation by usingΓ4. BothΓ2andΓ4
are compared against two different thresholds. Figures 4 and 5 show the variation ofΓ2and Γ4 against SNR,
re-spectively. It is observed that these features have the ability to separate PSK modulations at SNR as low as 0 dB. It is also used to classify OQPSK and 8FSK modula-tions. Figure 6 shows that Γ4can classify both
modula-tions at SNR = 0 dB.
Finally, featureΓ4can be further used to separate 16/
64QAM from 16/32APSK and 32QAM modulations. The threshold for separating the two groups is set to allow classification starting from around 0 dB by care-fully taking into consideration the variance of feature values. Note that the variance ofΓ4for 64QAM is larger
than that of 32QAM as shown in Figure 7.
Number of points of partitioned magnitude of constellation diagram
QAM/APSK modulation symbols are defined in terms of phase and amplitude variations and are represented in the form of a constellation diagram. This diagram is extracted from the analytic form of the IF signal after down conversion to the baseband. Many features exist in literature that exploit different aspects of the constella-tion diagram for classificaconstella-tion of 16, 32, and 64QAM modulations [38-42]. In this article, a new feature based on partitioning magnitude of constellation diagram is proposed. This feature makes use of the observation that the noise-free normalized constellation points of PSK and FSK modulations are on the unit circle, whereas the normalized constellation points of QAM and APSK Table 2 Simulation parameters
Parameter Value
Carrier frequency fc=24 kHZ
Symbol rate rs=2400 Hz
Sampling rate fs=19.2 kHz
Number of symbols N =512
Total number of samples Ns=4096
0 5 10 15 20 25
0 5 10 15 20 25 30
SNR
ma
x
2FSK 4FSK 8FSK 2PSK 4PSK 8PSK OQPSK upper bound lower bound
0 5 10 15 20 25 0
200 400 600 800 1000 1200
SNR
1
2FSK 4FSK 8FSK OQPSK upper bound upper bound lower bound lower bound
L
Figure 3Γ1versus SNR for the three FSK signals.
0 5 10 15 20 25
0 500 1000 1500 2000 2500 3000 3500 4000 4500
SNR
2
2PSK 4PSK 8PSK upper bound lower bound
L
Figure 4Γ2versus SNR for the three PSK signals.
0 5 10 15 20 25
0 500 1000 1500 2000 2500 3000
SNR
4
4PSK 8PSK upper bound lower bound
L
modulations may lie on, inside, and/or outside the unit circle. Therefore, this feature is useful in separating near constant amplitude modulations from amplitude varying modulations, and also in determining the order of amp-litude varying modulations.
The first step of proposed feature is to partition the magnitude of normalized constellation diagram into seven regions denoted by R1, R2,. . ., R7. Note that the
samples of QAM/APSK signal are normalized by the standard deviation of the signal amplitude before feature extraction. Then, the signal is classified by comparing the number of points in one or more pre-defined regions to a pre-computed threshold. Table 3 shows the boundaries of these regions which are determined by examining the histogram of magnitude of normalized constellation dia-gram of QAM/APSK modulations. To ensure maximum separation between different modulations, their respect-ive histograms are searched for regions in which the
number of points differs by large values across different histograms.
LetNi (i = 1, 2,. . ., 7) denote the normalized number of constellation points whose magnitude falls within the range Ri. The normalization pertaining to Ni is per-formed with respect to the total number of received sig-nal samples Ns. Therefore, we can define the following
features.
K1¼N4þN5 K2¼N1þN2þN5 K3¼N6
K4¼N2þN7
ð7Þ
Figure 8 shows the variation of feature K1 extracted
from PSK, FSK, QAM, and APSK signals at different SNR values. The threshold is selected to separate QAM/ APSK from rest of the modulation schemes. It can be
0 5 10 15 20 25
0 200 400 600 800 1000 1200 1400 1600 1800
SNR
4
8FSK OQPSK upper bound lower bound
L
Figure 6Γ4versus SNR for 8FSK and OQPSK signals.
0 5 10 15 20 25
0 200 400 600 800 1000 1200 1400
SNR
4
16QAM 32QAM 64QAM 16APSK 32APSK upper bound lower bound
L
observed from Figure 8 that with this feature, successful classification can be obtained at SNR greater than 4 dB. By virtue of Figure 8, it is also observed that noise statis-tics dominate the featureK1at values of SNR less than 4
dB, which makes it impossible to distinguish at this range one modulation type from another.
Figure 9 shows the normalized histogram of magni-tude of constellation diagram of 16QAM and 64QAM signals computed in the absence of noise. Based on this figure, it is obvious that 16QAM is separable from 64QAM by making use of the feature K2. Figure 10
shows the variation of the featureK2against SNR, where
it is observed that successful classification can be Table 3 Regions of partitioned magnitude of
constellation diagram
Region Range
Starting point Ending point
R1 0 0.2
R2 0.2 0.3
R3 0.3 0.4
R4 0.4 0.6
R5 0.6 0.8
R6 1.00 1.25
R7 1.6 1.7
0 5 10 15 20 25
0 0.05 0.1 0.15 0.2 0.25 0.3 0.35
SNR K1
2FSK 4FSK 8FSK 2PSK 4PSK 8PSK 16QAM 32QAM 64QAM OQPSK 16APSK 32APSK lower bound lower bound upper bound
Figure 8K1versus SNR for the different FSK/PSK and QAM/APSK signals.
0 0.2 0.4 0.6 0.8 1 1.2 1.4 1.6 1.8 2
0 0.005 0.01 0.015 0.02 0.025
N
o
rm
al
iz
ed H
ist
ogr
am
Magnitude
16QAM 64QAM
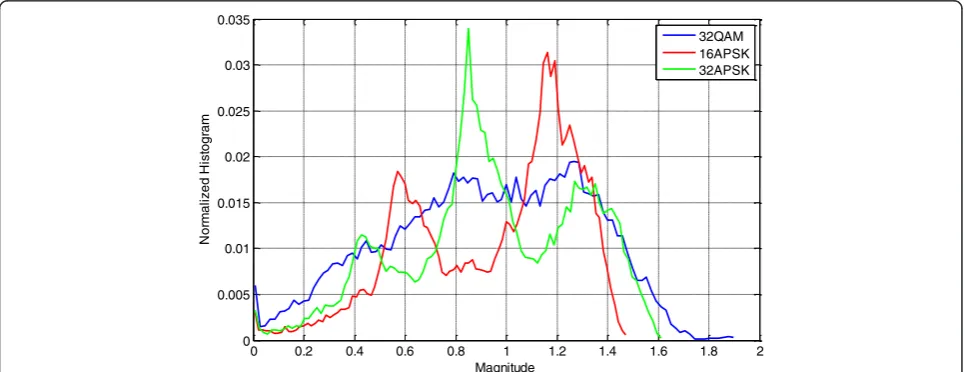
achieved at approximately 7 dB. 16APSK is separable from 32QAM/APSK using featureK3which is identified
by examining the normalized histogram of the constella-tions of respective modulaconstella-tions displayed in Figure 11. Figure 12 shows the variation of the feature K3 against
SNR, which shows good prospects of classification around 3 dB. Finally, 32APSK and 32QAM are separated using K4. Note that K4 is effective at approximately
SNR = 13 dB as shown in Figure 13.
Structure of the AMC algorithm
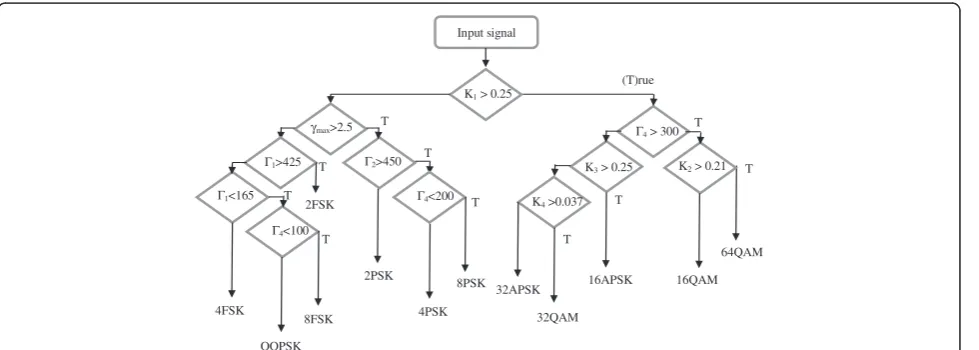
The proposed AMC follows a step-by-step approach for classification of the modulation schemes. A decision is taken at each step using one of the features which results in identification of either a type or order of an in-dividual modulation. There are a total of three main fea-tures used to classify 12 modulation schemes targeted in
this article. The structure of the decision tree is illu-strated in Figure 14. Each decision node (comparator) is labeled with the name of the feature. It can be observed that in the initial stages only modulation types are iden-tified, and orders of the individual modulation schemes are determined in later stages.
Computational complexity
The computational complexity of the proposed AMC al-gorithm determines its suitability for real-time imple-mentation in practical systems. Here, we consider the algorithm complexity in terms of number of multiplica-tions, addimultiplica-tions, and comparisons given the sequence acn(i) or a(i). Table 4 shows these counts expressed in
terms of number of samples Ns. It is of interest to note
that the proposed feature has the least computational cost as it requires no multiplication operations. By virtue
0 5 10 15 20 25
0.17 0.18 0.19 0.2 0.21 0.22 0.23
SNR K2
16QAM 64QAM upper bound lower bound
Figure 10K2versus SNR for 16QAM and 64QAM signals.
0 0.2 0.4 0.6 0.8 1 1.2 1.4 1.6 1.8 2
0 0.005 0.01 0.015 0.02 0.025 0.03 0.035
N
o
rm
al
iz
ed H
ist
ogr
am
Magnitude
32QAM 16APSK 32APSK
0 5 10 15 20 25 0.2
0.22 0.24 0.26 0.28 0.3 0.32 0.34 0.36
SNR K3
32QAM 16APSK 32APSK upper bound upper bound lower bound
Figure 12K3 versus SNR for 16APSK, 32APSK, and 32QAM signals.
0 5 10 15 20 25
0.03 0.035 0.04 0.045 0.05 0.055
SNR K4
32QAM 32APSK upper bound lower bound
Figure 13K4versus SNR for 32APSK and 32QAM signals.
64QAM
16QAM 16APSK
32APSK
32QAM
Γ4> 300
K2> 0.21 K3> 0.25
K4>0.037 Input signal
K1> 0.25
2PSK
8PSK
4PSK
Γ4<200
γmax>2.5
2>450
2FSK
4FSK
8FSK
OQPSK
Γ1>425
Γ1<165
Γ4<100
(T)rue
T
T
T
T T
T
T T
T T
Γ
of Table 4, it is not difficult to conclude that the compu-tational complexity is upper bounded by Ns/2log(Ns) +
4Ns+ 1 multiplications,Nslog(Ns) additions and 4Ns+ 1
comparisons, which is very attractive for real-time im-plementation. Note that Table 4 shows the maximum possible addition operations for the proposed featureKl. In reality, far fewer additions are needed.
Results
This section presents results that show the overall per-formance of the proposed AMC algorithm in the pres-ence of either G or BK noise for classifying the type and order of a particular modulation. Features described in Section 3 are extracted from the signal under consider-ation and utilized in the proposed AMC scheme accord-ing to Figure 14. Simulation results are presented at different values of SNR using parameters’values given in Table 2. The performance is measured in terms of
probability of correct classification (Pcc) averaged over
100 independent trials.
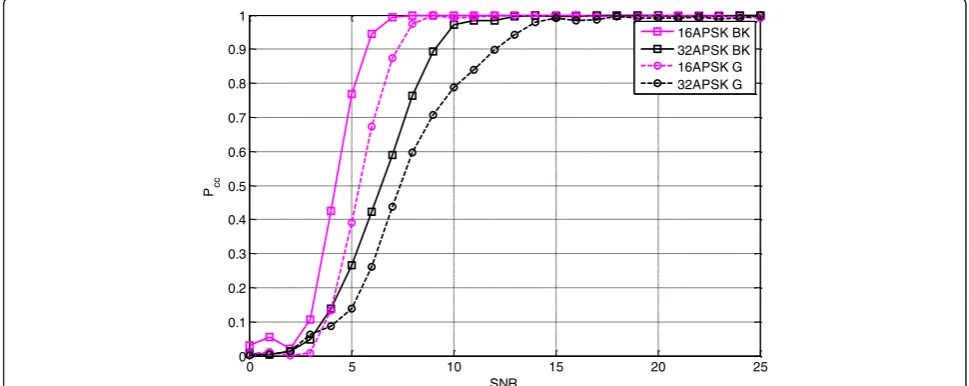
Figures 15 and 16 show the classification rate of QAM/APSK signals, where it is observed that 16QAM and 32APSK have the lowest values. Specifically, 16QAM and 32APSK havePcc> 0.9 at SNR = 12 dB and
SNR = 13 dB, respectively. On the other hand, 64QAM has shown almost constant performance with respect to SNR. This is intuitively not surprising as the steps per-taining to 64QAM classification first test the received signal against the hypothesis of being 32QAM/32APSK or 16APSK. If not true, then the signal is tested against the hypothesis of being 16QAM; otherwise it is declared 64QAM. That is, as the SNR decreases, the likelihood of correct classification is always in favor of 64QAM. Simi-lar conclusion can be drawn for 32QAM.
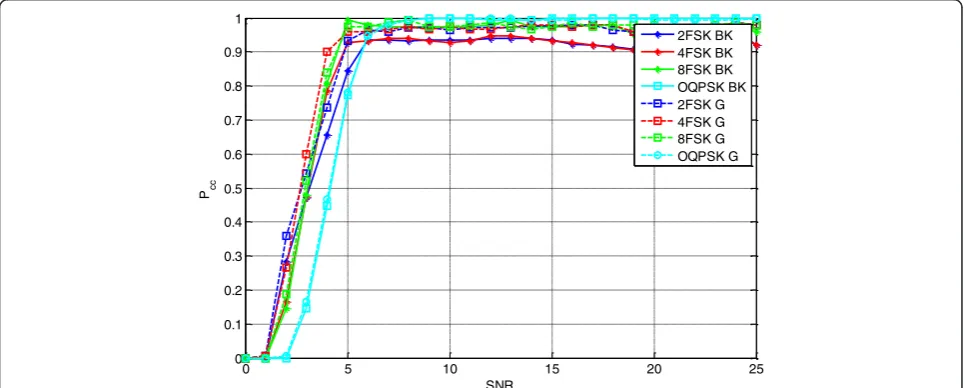
Figure 17 shows the classification rate of FSK and OQPSK modulations in the presence of G/BK noise, wherePcc > 0.9 is attained for both noise models at
ap-proximately SNR = 7 dB. Similar performance has been observed for PSK withPcc= 1 at SNR = 8 dB, as shown
in Figure 18.
The average probability of correct classification (Pca)
over all 12 modulation schemes is shown in Figures 19, 20, and 21 for different noise distributions, roll-off fac-tor, and frequency offsets, respectively. It is observed that change of noise model or frequency offset has al-most no significant effect on the classification rate. In addition, the proposed AMC method shows acceptable performance with practical values of roll-off factor.
Figure 22 shows Pca of the proposed AMC algorithm
at two different symbol rates: 1200 and 2400 Hz using the same thresholds computed at 2400 Hz. The result shows slight discrepancies between the performances Table 4 Computational complexity of the proposed
algorithm
Feature Number of operations
Complex multiplication Complex addition Comparison
K1 0 Ns–1 2Ns+ 1
K2 0 Ns–1 3Ns+ 1
K3 0 Ns–1 2Ns+ 1
K4 0 Ns–1 4Ns+ 1
Kmax Ns/2log(Ns) +Ns+ 1 Nslog(Ns) Ns Γ1 Ns/2log(Ns) +Ns+ 1 Nslog(Ns) Ns Γ2 Ns/2log(Ns) + 2Ns+ 1 Nslog(Ns) Ns Γ4 Ns/2log(Ns) + 4Ns+ 1 Nslog(Ns) Ns
0 5 10 15 20 25
0 0.1 0.2 0.3 0.4 0.5 0.6 0.7 0.8 0.9 1
SNR
Pcc
16APSK BK 32APSK BK 16APSK G 32APSK G
using the two data rates. Note that as the data rate decreases, the number of symbols involved in features’ computations also decreases for fixed values ofNsandfs.
Changing the sampling rate also affects the algorithm in a similar manner to the effect of changing the symbol rate. In fact, the main influencing factor is the number of samples per symbol. The proposed AMC algorithm makes use of a fixed window of sizeNsreceived samples.
Increasing (deceasing) the sampling rate means fewer (more) symbols are packed into theNssamples window.
Therefore, it can be inferred from Figure 22 the effect of changing the sampling rate for fixed values of Ns. By
virtue of Figure 22, it is evident that for optimum
results, thresholds need to be fine-tuned if the sampling rate gets changed.
Conclusions
In this article, a new features-based decision tree AMC algorithm is developed for the classification of most popular single carrier modulations used in HF communi-cations systems, i.e., 2FSK, 4FSK, 8FSK, 2PSK, 4PSK,
8PSK, 16QAM, 32QAM, 64QAM, 16APSK, and
32APSK. Towards this objective, three features are employed that include PSD and DFT of kth power of received signal. A new constellation-based feature for the classification of QAM and APSK signals is also proposed.
0 5 10 15 20 25
0 0.1 0.2 0.3 0.4 0.5 0.6 0.7 0.8 0.9 1
SNR Pcc
2FSK BK 4FSK BK 8FSK BK OQPSK BK 2FSK G 4FSK G 8FSK G OQPSK G
Figure 17Performance of the proposed AMC algorithm pertaining to the classification of FSK and OQPSK modulations in presence of G and BK noises.
0 5 10 15 20 25
0 0.1 0.2 0.3 0.4 0.5 0.6 0.7 0.8 0.9 1
SNR Pcc
16QAM BK 32QAM BK 64QAM BK 16QAM G 32QAM G 64QAM G
5 10 15 20 25 0
0.1 0.2 0.3 0.4 0.5 0.6 0.7 0.8 0.9 1
SNR Pca
= 0.45 = 0.35 = 0.25
Figure 20Average Pccwith values of roll-off factor 0.25, 0.35, and 0.45.
0 5 10 15 20 25
0.1 0.2 0.3 0.4 0.5 0.6 0.7 0.8 0.9 1
SNR Pca
BK G
Figure 19AveragePccin presence of G and BK noises.
0 5 10 15 20 25
0 0.1 0.2 0.3 0.4 0.5 0.6 0.7 0.8 0.9 1
SNR Pcc
2PSK BK 4PSK BK 8PSK BK 4PSK G 2PSK G 8PSK G
In practice, the received signal is often corrupted by HF noise whose statistical characteristics have PDF best described by a model that fluctuates between G and BK distributions; in addition the received signal may have frequency, phase, and symbol synchronization errors. Extensive simulations results have shown that the pro-posed features are insensitive to noise model variation or synchronization errors.
The proposed AMC method has an advantage of being simple to implement as it uses decision-tree with pre-computed thresholds for signal classification. In addition, it is capable to classify type and order of modulation in band-limited HF noise environment at relatively low SNR.
Competing interests
The authors declare that they have no competing interests.
Acknowledgments
The authors would like to thank the reviewers for their time and effort spent in carefully reviewing the manuscript, and for their valuable comments that have greatly contributed to the enhancement of article’s quality. This study was supported by Grant no. 08-ELE 263–2 from the unit of Science and Technology at King Saud University.
Author details
1KACST Technology Innovation Center in Radio Frequency and Photonics,
Riyadh, Saudi Arabia.2Prince Sultan Advanced Technologies Research Institute/STC-Chair, Riyadh, Saudi Arabia.3Electrical Engineering Department,
King Saud University, Riyadh, Saudi Arabia.
Received: 13 March 2012 Accepted: 18 October 2012 Published: 14 November 2012
References
1. R. Prosch,Technical Handbook for Radio Monitoring I(Books on Demand GmbH, Norderstedt, Germany, 2007)
2. N. Maslim,HF Communications: A Systems Approach(CRC Press, London, 1987)
0 10 20 30 40 50 60 70 80 90 100
0.4 0.5 0.6 0.7 0.8 0.9 1
Frequency Offset (Hz) Pca
SNR=5dB SNR=10dB SNR=15dB
Figure 21AveragePccfor different values of frequency offset.
3. J. Giesbrecht, R. Clarke, D. Abbott, An empirical study of the probability density function of HF noise. Fluct. Noise Lett.6(2), L117–L123 (2006) 4. J. Giesbrecht,An impirical study of HF noise near Adelaide Australia. Proc. IET
International Conference on Ionospheric Radio Systems and Techniques (IRST’09) (, Edinburgh, UK, 2009), pp. 310–314
5. J.L. Xu, W. Su, M. Zhou, Likelihood-ratio approaches to automatic modulation classification. IEEE Trans. Syst. Man Cybern. C Appl. Rev.
1, 455–469 (2011)
6. P. Jain, R.M. Buehrer, Implementation of adaptive modulation on the Sunrise software radio. Proc. 45th Midwest Symp. Circ. and Syst. (MWSCAS)
3, 405–408 (2002)
7. L. De Vito, S. Rapuano, M. Villanacci, Prototype of an automatic digital modulation classifier embedded in a real-time spectrum analyzer. IEEE Trans. Instrum. Meas.59(10), 2639–2651 (2010)
8. A.K. Nandi, E.E. Azzouz, Algorithms for automatic modulation recognition of communication signals. IEEE Trans. Commun.46, 431–436 (1998) 9. E.E. Azzouz, A.K. Nandi,Automatic Modulation Recognition of Communication
signals(Kluver Academic, 1996)
10. V.D. Orlic, M.L. Dukic, Multipath channel estimation algorithm for automatic modulation classification using sixth-order cumulants. IET Electron. Lett.
46(19), 1348–1349 (2010)
11. H.-C. Wu, M. Saquib, Y. Zhifeng, Novel automatic modulation classification using cumulant features for communications via multipath channels. IEEE Trans. Wirel. Commun.7(8), 3098–3105 (2008)
12. O.A. Dobre, A. Abdi, Y. Bar-Ness, W. Su,Selection combining for modulation
recognition in fading channels. Proc. IEEE Military Communs. Conf.
(MILCOM’05), vol. 4 (, Atlantic City, US, 2005), pp. 2499–2505
13. Z. Xin, W. Ying, Y. Bin, Signal classification method based on support vector machine and high-order cumulants. Wirel. Sensor Netw.2(1), 48–52 (2010) 14. E. Avci, D. Hanbay, A. Varol, An expert discrete wavelet adaptive network
based fuzzy inference system for digital modulation recognition. Expert Syst. Appl.33(3), 582–589 (2007)
15. E. Avci, D. Avci, The performance comparison of discrete wavelet neural network and discrete wavelet adaptive network based fuzzy inference system for digital modulation recognition. Expert Syst. Appl.
35(1–2), 90–101 (2008)
16. K. Maliatsos, S. Vassaki,Ph. Constantinou, Interclass and Intraclass modulation
recognition using the Wavelet Transformation. Proc. IEEE Personal, Indoor and
Mobile Radio Commun. (PIMRC’07) (, Athens, Greece, 2007), pp. 1–5 17. M. Ling-Ling, S. Xiu-jie,An Improved Algorithm of Modulation Classification
For Digital Communication Signals Based on Wavelet Transform. Proc. IEEE
Intl. Conf. Wavelet Analysis and Pattern Recogn. (ICWAPR’07) (Beijing, China, 2007), pp. 1226–1231. vol. 3
18. P. Cheol-Sun, C. Jun-Ho, N. Sun-Phil, J. Won, Automatic Modulation Recognition of Digital Signals using Wavelet Features and SVM, in Proc. Inl. Conf. Adv. Comm. Tech. (ICACT’08). Gangwon-Do, China1, 387–390 (2008) 19. H. Ketterer, F. Jondral, A.H. Costa,Classification of modulation modes using
time-frequency methods. Proc. Proc. IEEE Internatinal Conference on
Acoustics, Speech and Signal Processing (ICASSP’99), vol. 5 (Phoenix, Arizona, 1999), pp. 2471–2474
20. M.L.D. Wong, A.K. Nandi, Automatic digital modulation recognition using artificial neural network and genetic algorithm. Signal Process.
84(2), 351–365 (2004)
21. S. Theodoridis, K. Koutroumbas,Pattern Recognition, 4th edn. (Elsevier Inc., Canada, 2009)
22. B. Le, T. Rondeau, D. Maldonado,Modulation identification using neural networks for cognitive radios, in Proceedings of the SDR Technical Conference (SDR’05)(Phoenix, AZ, 2005)
23. O.A. Dobre, A. Abdi, Y. Bar-Ness, W. Su, Survey of automatic modulation classification techniques: classical approaches and new trends. IET Commun.
1(2), 137–156 (2007)
24. J.E. Giesbrecht, R. Clarke, D. Abbott,Modulation recognition for real HF
signals. Proc. SPIE Int. Symp. Microelectr., MEMS, and Nanotech. (2006)
(Brisbane, Australia, 2006), pp. 458–469. Vol. 60
25. J. Giesbrecht, R. Clarke, D. Abbott,Parameters for automatic modulation recognition of HF signals, in 10th IET International Conference on Ionospheric
Radio Systems and Techniques IRST 2006(2006)
26. J. Giesbrecht,Entropic distance for automatic modulation recognition of HF signals, in 11th IET International Conference on Ionospheric Radio Systems and
Techniques IRST 2009(Edinburgh, IET, UK, 2009)
27. H. Alharbi, S. Mobien, S. Alshebeili, F. Alturki,Classification of Digitally Modulated Signals in Presence of Non-Gaussian HF Noise, in Proc. 7th Intl.
Symp. Wireless Commun. Syst. (ISWCS’10)(, York, United Kingdom, 2010),
pp. 815–819
28. H. Alharbi, S. Mobien, S. Alshebeili, F. Alturki, Robustness of digitally modulated signal features against variation in HF noise model. EURASIP J. Wirel. Commun. Netw.2011, 24 (2011)
29. R. De Gaudenzi, A. Guillen, A. Martinez, Performance analysis of turbo-coded APSK modulations over nonlinear satellite channels. IEEE Trans. Wirel. Commun.5(9), 2396–2407 (2006)
30. P. Ciblat, M. Ghogho, Blind NLLS carrier frequency-offset estimation for QAM, PSK, and PAM modulations: performance at low SNR. IEEE Trans. Commun.54(10), 1725–1730 (2006)
31. F. Xie, C. Li, G. Wan,An Efficient and Simple Method of MPSK Modulation Classification, 4th International Conf. on Wireless Communications, Networking
and Mobile Computing (WiCOM '08)(Dilian, China, 2008), pp. 1–3
32. J.G. Proakis,Digital Communications(McGraw-Hill, New York, 2001) 33. P. Seungkeun, C. Heechang, N. Sangsin, Intersymbol interference due to
mismatched roll-off factors and sampling jitter over a Gaussian channel. Electron. Lett.33(24), 2016–2017 (1997)
34. S.D. Assimonis, M. Matthaiou, G.K. Karagiannidis, J.A. Nossek, Improved parametric families of intersymbol interference-free Nyquist pulses using inner and outer functions. IET Signal Process.5(2), 157–163 (2011) 35. F.M. Gardner, A BPSK/QPSK timing-error detector for sampled receivers. IEEE
Trans. Commun.34(5), 423–429 (1986)
36. M.A. Rahman, C.S. Sum, R. Funada, T. Baykas, J. Wang, S. Sasaki, H. Harada, S. Kato, Error rate analysis of band-limited BPSK with Nakagami/Nakagami ACI considering nonlinear amplifier and diversity. IEEE Trans. Veh. Technol.
59(3), 1523–1529 (2010)
37. M. Leconte, M. Testard,“A model of high frequencies (H.F) channel used to design a modem of 9600 bits/s rate in 3 kHz of bandwidth,”MILCOM 97 Proceedings.1, 351–355 (1997)
38. B. Mobaseri,Constellation shape as a robust signature for digital modulation
recognition, in Proc. IEEE Military Communs. Conf. (MILCOM’99), Volume 1,
Issue(NJ, USA, 1999), pp. 442–446
39. N. Ahmadi, B. Reza,Modulation classification of QAM and PSK from their constellation using Genetic Algorithm and hierarchical clustering, in Proc. Intl.
Conf. inf and commun. Tech.: from Theory to Appl. (ICTTA'08)(Umayyad
Palace, Damascus, Syria, 2008), pp. 1–5
40. N. Ahmadi, B. Reza, A template matching approach to classification of QAM modulation using genetic algorithm. Signal Process. Int. J.3(5), 95–109 (2009)
41. W. Kam-Tim, K. Chi-Wah,Clustering based distribution fitting algorithm for Automatic Modulation Recognition, in Proc. IEEE Symp. Comp. and Commun.
(ISCC'07)(2007), pp. 13–18
42. Y. Changyi, L. Bingbing, L. Yanling,Modulation Classification of MQAM Signals from Their Constellation Using Clustering, in Proc. Intl. Conf. Commun.
Software and Networks (ICCSN’10)(2010), pp. 303–306
doi:10.1186/1687-6180-2012-238
Cite this article as:Alharbiet al.:Automatic modulation classification of
digital modulations in presence of HF noise.EURASIP Journal on Advances
in Signal Processing20122012:238.
Submit your manuscript to a
journal and benefi t from:
7Convenient online submission
7Rigorous peer review
7Immediate publication on acceptance
7Open access: articles freely available online
7High visibility within the fi eld
7Retaining the copyright to your article