Volume 2010, Article ID 938737,20pages doi:10.1155/2010/938737
Research Article
Unconstrained Iris Acquisition and Recognition Using
COTS PTZ Camera
Shreyas Venugopalan and Marios Savvides
Carnegie Mellon University, 5000 Forbes Avenue, Pittsburgh, PA 15213, USA
Correspondence should be addressed to Shreyas Venugopalan,[email protected] Received 2 December 2009; Revised 3 May 2010; Accepted 19 July 2010
Academic Editor: Yingzi Du
Copyright © 2010 S. Venugopalan and M. Savvides. This is an open access article distributed under the Creative Commons Attribution License, which permits unrestricted use, distribution, and reproduction in any medium, provided the original work is properly cited.
Uniqueness of iris patterns among individuals has resulted in the ubiquity of iris recognition systems in virtual and physical spaces, at high security facilities around the globe. Traditional methods of acquiring iris patterns in commercial systems scan the iris when an individual is at a predetermined location in front of the scanner. Most state-of-the-art techniques for unconstrained iris acquisition in literature use expensive custom equipment and are composed of a multicamera setup, which is bulky, expensive, and requires calibration. This paper investigates a method of unconstrained iris acquisition and recognition using a single commercial off-the-shelf (COTS) pan-tilt-zoom (PTZ) camera, that is compact and that reduces the cost of the final system, compared to other proposed hierarchical multicomponent systems. We employ state-of-the-art techniques for face detection and a robust eye detection scheme using active shape models for accurate landmark localization. Additionally, our system alleviates the need for any calibration stage prior to its use. We present results using a database of iris images captured using our system, while operating in an unconstrained acquisition mode at 1.5 m standoff, yielding an iris diameter in the 150−200 pixels range.
1. Introduction
Biometrics is a fast-emerging field that is used in association with security provisions in many establishments around the globe. A good biometric is one that does not change with time (stability); it is unique for each individual (distinctive-ness); it has features that are not restricted to a certain class of people (availability); it is easily acquirable (accessible); it should not pose any inconvenience to the individual whose biometrics are being acquired (acceptability and unobtrusiveness factor). Of the various biometrics that have been studied, the iris pattern has gained a lot of popularity in recent years. The iris is actually the sphincter muscle within the sclera (the white region of the eye) that controls the contraction and dilation of the pupil depending on the amount of light that is incident on the eye. Additionally, depending on the amount of melanin content in the iris, it varies in color from person to person. The iris pattern is unique to an individual, and, as a result, this method has reported very high identification and verification accuracies
in literature [1–4]. In addition to the popular Daugman
style approaches, other methods build on the method
proposed by Wildes in [5] to develop an alternate scheme
for iris segmentation, feature extraction, and matching. Additionally, matching based on partial iris patterns has been investigated in [6,7].
In most security systems that are based on iris patterns, a major concern is the acquisition of pristine quality iris pat-terns (i.e., accessibility of the iris pattern). This often requires significant cooperation from the individual whose eye is being imaged. The usual constraints include positioning the subject at a predefined location, at a predefined distance
from the camera, providing sufficient near-IR illumination
the acceptable capture volume, the user typically remains in that position with limited motion until the system acquires a good quality image. In general, with these systems, this positioning process can seem significant for some users and may be unintuitive for relatively new users. This can result in failure to acquire (FTA) results.
Other systems have been proposed that involve less coop-eration from the users. One good example is the Iris-On-the-Move system (IOM) that was proposed and developed by SarnoffCorporation [11]. Iris patterns are captured while users walk through a portal that has near-IR illuminators within the side panels. The system has a throughput of an average of 20 persons/min at a walking rate of around 1 meter/second. The subject stand-offrequired by the system is 3 meters. The stand-offdistance is the distance between the front of the lens and the subject. This acquisition system is a fixed focus system with a reported depth of field, based on the iris match scores, of 5 cm−10 cm [11]. It should be noted here that in the context of iris acquisition and recognition, the depth of field is defined as the depth of the capture volume within which an iris image of acceptable quality may be acquired. The quality should suffice for successful operation of the iris-matching algorithm of the system. Compared to traditional desktop/wall mount systems (such as Panasonic, LG, and others), this has an advantage of an increased stand-offdistance and reduced level of cooperation effort needed by the subject. However, the issues of limited and fixed capture volume remains. Iris image acquisition fails if a user’s iris is not acquired through this small capture volume. Also, this work suggests a modular approach to increase the height of the capture volume. Multiple cameras are stacked one above the other so that the iris can be captured irrespective of the height of the user. This, however, increases the cost of the
sys-tem. Both the LG system and the IOM are shown inFigure 1.
Another category of acquisition systems involves a pan-tilt-zoom camera setup, which has a “dynamic” capture volume. A pan-tilt-zoom system can alleviate the need for a fixed capture volume in order to get pristine iris pattern images. By introducing 3 new degrees of freedom on the side of the acquirer (i.e., panning, tilting, and zooming), these systems give greater freedom of position and motion to the subject. Early attempts at such a setup are reported by Oki IrisPass-M [12], Sensar R1 [13], recent development from Wheeler et al. [14], and the Mitsubishi Corporation [15]. All of these systems are based on the use of two cameras—a scene camera having a wide angle lens to detect the eye in the scene and the second camera having a high magnification lens, specifically aimed to capture the iris pattern on each eye. The former three systems use a biocular setup for the scene camera. The set of stereo images thus obtained may be used to recover the 3D world position of the user. Using this information, the pan and tilt required is estimated. The focus of the second camera can be estimated using the depth
information. The approach used by [15] is similar except
they estimate the position of the user in 3D space using the disparity between facial features. This naturally involves a calibration stage in which one has to learn the relation between facial features and position in space.
Eagle Eye system [16]. It uses a scene camera, a face camera, and two iris cameras, which account for its large form factor. The capture volume of this setup is larger compared to the
systems described so far, yielding a 3×2 ×3 m capture
volume with increased stand-off(average of 5 m). Yoon et
al. [17] use a light stripe projection to detect the presence of users and to estimate the distance from the camera. A system
to perform recognition at a stand-offof 2 meters has been
introduced by AOptix [18]. This is designed to determine
depth information from a capture 2D image, which helps it to set the focus at the user’s position. Also, it reports a capture volume with a depth of 1 meter, enabling it to enroll and verify users whose heights are between 0.9 meters and 1.9 meters. The system uses adaptive optics that employ a multistage, real-time closed loop control system, in order to find the subject within the capture volume zone.
All of these systems involve custom-made components to capture iris patterns of required quality. Also, most of them depend on the presence of a wide angle “scene” camera
to perform the initial face detection before handing offto
an “eye” camera to perform iris acquisition. As mentioned, the scene camera is typically equipped with a wide angle lens with a small value of focal length, while the eye camera will have a telephoto lens for achieving high magnification. The system described in this paper has a twofold aim. It aims to decrease the amount of cooperation required from the individual who is being identified in an access control type scenario by using a PTZ-based system. It may be used for access to high security areas within a building. Also, we propose to do this using a single camera (i.e., the functions of the scene and the eye cameras in the previous works will now be performed by a single camera through the utilization of the in-built zoom lens and autofocusing mechanism). More
importantly, we built this system using Commercial Off
-The-Shelf (COTS) equipment, so there are no custom made components in our system, which significantly reduces the cost compared to other systems and allows for rapid building and reproduction.
The remainder of the paper has four sections.Section 2
describes our system hardware architecture and the various
components that are used to build it. Section 3 gives an
overview of the various algorithms that are used for face
detection, iris acquisition, and iris matching. Section 4
presents the results of using this system over a database of images that was acquired using the PTZ camera under varying lighting conditions and positions of the subject. We conclude this paper inSection 5.
2. System Hardware Architecture
This section details the architecture of our proposed system and the devices used therein. We discuss the specifications needed of the proposed PTZ camera setup and the additional COTS optics required.
(a) (b)
Figure1: Two commercial state of the art iris acquisition and recognition systems (a) The LG IrisAccess4000 which uses voice prompts to direct the user to the optimal position so that an in-focus iris image may be acquired. (b) is the Iris-On-the-Move system developed by SarnoffCorporation which captures iris images with an increased stand-offof 3 meters. In both (a) and (b), the reader will note that the capture volume is fixed, that is, the user is expected to be in a fixed location for iris acquisition.
(a) (b)
Figure2: The Axis 233D network dome camera used in this work. (b) shows the camera after adding the necessary lenses for our work.
Pan-Tilt-Zoom (PTZ) camera manufactured by Axis Com-munications. Details about the camera are available on the specification sheet [19]. The interesting specifications needed for our application include the following: a network
PTZ camera built around a 1/4-inch ExView HAD
progres-sive scan CCD. It is capable of 35X optical zoom with a pan capability of 360◦ and a tilt capability of 180◦. Both pan and tilt motions have adjustable speeds ranging from 0.05◦ to 450◦/second. A built-in switchable IR cutofffilter varies the light sensitivity depending on the ambient light. Typically, in low light conditions, this filter is automatically removed, increasing the sensitivity of the CCD to 0.008 lux (i.e., monochrome night mode as opposed to 0.05 lux in day light mode). We operate the camera in the night mode since we want to image the scene in the near infrared wavelengths. This is because, as the melanin content in the eye increases, the iris absorbs more and more energy in the visible spectrum. The near infra-red spectrum preserves most of the information in the iris pattern, and this is what we record using the camera for further analysis [20]. Additionally, scene reflections from the environment (typically observed by the naked eye in the visible domain) are no longer visibly present.
The camera (see Figure 2) captures up to 30 frames
a second and the frames are encoded in motion JPEG stream format. Application Programming Interfaces (APIs) for controlling the motion of the camera are freely available [21]. If the device is installed at the exterior of a building then the in-built Electronic Image Stabilizer (EIS) reduces
the vibration caused by traffic or wind, and thus yields
sharper images which are of importance for maintaining spatial frequency content for matching. The 128X Wide Dynamic Range (WDR) of the camera allows us to capture detailed images in complex lighting conditions. It is able to perform automatic backlight compensation, which adjusts the dynamic range of the camera, allowing it to capture very detailed images even when the illumination is not
sufficient. To some extent, this reduces the illumination
present for image acquisition and there is no range finding capability). As the image comes into focus, the spatial frequency content of the image increases, particularly at higher bands. Many algorithms exist to perform contrast analysis: some are frequency-based, and some are more computationally simplistic using postprocessing of adjacent pixels to compute some figure of contrast measure.
2.2. Magnification. In order to get irises that are suitable for recognition purposes, the iris images must have at least 150 pixels across their diameter [22]. We know that a typical human iris has a diameter of around 12 mm [23]. Given this data, a useful analysis would be to determine the focal length of the lens required, in order to capture iris images with this resolution and the stand-offdistance from the camera.
The Axis 233D network dome camera has a minimum focal length of 3.4 mm (wide) and a maximum focal length of 119 mm (telephoto). In this work, once the position of the eye has been detected on the user’s face, the system zooms into the frame keeping the eye at the center—the focal length of the lens is increased to 119 mm before the iris image is captured so as to get maximum magnification. The focusing mechanism ensures that the eye is in focus during image capture. With this in mind, the following analysis determines
what the maximum stand-offdistance of the subject can be
so that iris images of required resolution are obtained. The Axis 233D uses an ExView HAD sensor, which has a pixel side of 6.45μm. If an iris image has to have a resolution of at least 150 pixels, then the diameter of the iris image on the sensor is given by
v=150×6.45μm=0.9675 mm. (1)
If we consider an average person, the iris diameteru =
12 mm [23], the magnification is given by
M= image size(v)
object size(u)=
0.9675 12
=0.0806. (2)
The magnification of a lens system with effective focal length f, for an object at a distance ofDin front of the lens is given by the standard relation [24]
M= f
D−f. (3)
In our work, the iris images are captured using a lens focal length of 119 mm, that is, f =119 mm. So,
M=0.0806= 119 D−119 ,
D=1.595 m.
(4)
Hence, in the system that is setup, the maximum allowable subject stand-offdistance is approximately 1.6 metersif the required iris resolution is at least 150 pixels across the iris.
2.2.1. Close Up Lens for Magnification. From the specifica-tions of the Axis 233D camera, we see that when the lens is at
the lens is designed specifically to focus only on objects that are at a distance of more than a meter away. For any user who is at a stand-offdistance of less than this, the iris image will be out of focus. This limits the depth of the capture volume because we want the users to have an option of standing at distances of less than a meter from the camera lens. The reader can compare this effect to a person who has the vision defect hypermetropia, or longsightedness. In this case, too, the lens in the eye cannot focus on objects closer to it than a certain distance. The solution to this problem is reading glasses, which actually uses converging lens that helps to bring the object back into focus on to the retina. Using a similar approach, we overcame this limitation in our system and allowed the users to stand closer (if needed), by fixing a secondary converging lens to the front of the primary lens of the PTZ camera. This effect is illustrated in Figures3(b)and
3(c).
The design question then is the focal length of the secondary lens to be used. In photography, such secondary
lenses are called closeup lenses [24]. Commonly available
closeup lenses start from a power specification of +1 dioptre, the unit of power of a lens and is equal to the inverse of the focal length in meters. So, a 1 dioptre lens has a focal length of one meter. The greater the dioptre rating, the greater the converging power of the lens. While selecting a secondary lens for our application, we need to make sure that, apart from bringing closer objects into focus, the lens combination of primary and secondary has no adverse effect on the final magnification of the system. For combination of lenses that are attached to each other, as in our case, the effective focal length is determined from [24]
1 feff =
1 f1
+ 1
f2
, (5)
where f1 is the focal length of the primary lens (119 mm
in our case) and f2 is the focal length of the secondary
converging lens. Hence, the effect of adding the secondary
lens is that of decreasing the effective focal length. But if the effective focal length decreases, as we can see from (3), the magnification will decrease. So, we need to fit a secondary lens so that there is minimal effect on magnification, and we still get the required iris resolution during acquisition. This translates to using a lens with higher value of f2, from (5)— and, hence, a lower dioptre value. As mentioned previously, common photographic close up lenses start from 1 dioptre; thus, we choose this lens as our secondary lens. The effect on magnification can be analyzed by looking at (5) again. On adding the aforementioned secondary lens, the effective focal length is determined to be
feff= 1 119+ 1 1000 −1
=106.34 mm. (6)
Backtracking through the analysis performed in (1), (2),
and (3), we get the image size to be v = 0.8572 mm when
the object is at a stand-off distance of 1.6 meters. This
Distance of object front lens (D) Focal length (f)
Focal length (f)
Object (iris) diameter= u=12 mm Magnification
M=v
u
Iris image diameter=v
Image plane (IP)
Primary lens
Minimum focus distanceDmin
(a)
Object at a distance closer than the minimum focusing distance
of the lens
Blurred image
Back focus distance of the lens has shifted away
from image plane
Primary lens
Dmin
(b)
Object at a distance closer than the minimum focusing distance
of the primary lens
Image is brought back into focus on image plane
Primary lens
Secondary lens (c)
Figure3: The figure illustrates how a secondary converging lens, used along with the primary lens, reduces the minimum focus distance of the system. (a) Shows an object place farther away than the minimum focus distance Dmin from the primary lens. (b) Shows an object
placed closer to the primary lens. Here, the object is not in focus on the image plane IP. (c) Shows how the addition of a converging lens brings the image back into focus on the IP.
as our verification experiment shows (Section 4). Also,
since the secondary lens consists of only a single optical element, we should not expect a significant degradation of the net modulation transfer function (MTF) of the system. Next consider the camera’s lens system alone without the secondary lens attached and consider the case when the autofocus mechanism has positioned itself to focus objects at
the minimum stand-offdistance of 1 meter. The converging
Camera
0.5 m 200 pixels0.5 m 150 pixels0.9 m
100 pixels1.6 m
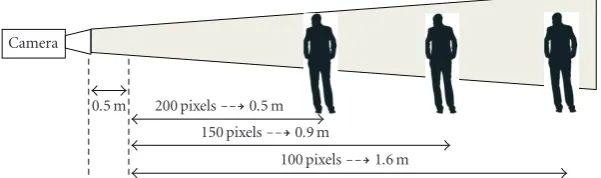
Figure4: The figure illustrates the varying depths of the capture volume based on the minimum iris resolution required. The iris resolution is indicated in terms of the number of pixels obtained across the iris in the capture eye image. The number to the right of the respective resolution indicates the depth of the capture volume in each case. 0.5 meters is the theoretical minimum focusing distance as determined in Section 2.1. We see that for minimum iris resolutions of 200, 150 and 100 pixels, the respective capture volume depths are 0.5 meters, 0.9 meters, and 1.6 meters. These results are based on analysis done using (1), (2), and (3).
is the inverse of this total power (i.e., 1/(2 dioptres) =0.5 meters). Examples of such secondary lenses can be seen in [25]. We have used the Tiffen 1 dioptre 52 mm lens shown in the same website.
2.2.2. Capture Volume. As mentioned previously, we note that the depth of field of an iris acquisition system is depth of the capture volume within which iris images of required resolution for recognition can be captured. This fact, coupled with the presence of an autofocusing mechanism in the camera, means that we practically get a depth of field limited by only the iris pixel resolution required. Other works in unconstrained iris acquisition, including commercial products, use a fixed focal length “iris camera” [10, 11,
16, 17], where the focal length of the telephoto lens used to acquire the eye images is fixed, and the only degree of freedom is in image focus parameter (i.e., they have no zoom capability). As a result, the iris capture volume is at a fixed distance from the camera and has a fixed depth of field. In our work, the presence of the combination of the autofocusing mechanism, along with the pan and tilt capability, allows us to achieve a large torus-shaped capture volume. Hence, as mentioned, the depth of capture volume is limited only by the iris resolution required (see Figure 4
below) for iris matching (i.e., the focus parameter is no longer a constraint as in traditional iris scanners).
Figure 4shows the maximum stand-offdistance achiev-able if we can work with iris pixel resolutions as low as 100 pixels and look at higher resolutions of 150 pixels and 200 pixels across the iris diameter. The distances are calculated as before using (1), (2), and (3). For instance, if we require 200 pixels across the iris for a recognition system,
then the maximum stand-offdistance of the user is 1 meter
in front of the camera and the minimum stand-offdistance is 0.5 m, which is the minimum focusing distance as explained inSection 2.1.
2.3. Illumination. If the near-infrared (NIR) content in the ambient light is not sufficient at the location where the image is captured, a desk lamp with a standard 100 W bulb may be used while acquiring the images to increase ambient illumi-nation. Specific near-IR LED-based illumination sources can
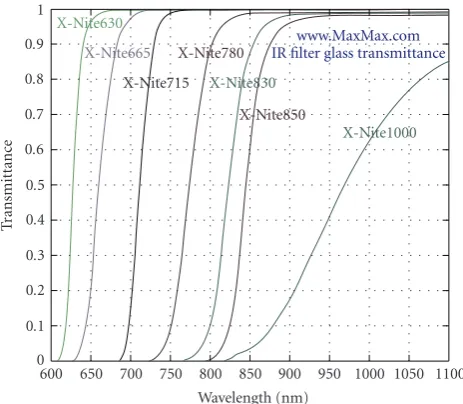
be used, but they must be certified to conform to eye-safety standards [8,9]. To ensure complete safety, we use ambient illumination or a table lamp with a standard 100 W bulb in our lab experiments. Our face and eye detection algorithms perform better if the face is not saturated with light. Hence, the lamp is directed at an angle to the user of the system (approximately 30◦with a line joining the lamp to the center of the subject’s face), to ensure there is enough illumination to acquire a good quality iris. At the same time, this off-angle illumination ensures that the face is not saturated with light. Additionally, the camera is fitted with a near-IR filter, which blocks most of the visible light and passes only the near-IR component of the incident light. It is seen that as the melanin content in the human iris increases, much of the visible light component that is incident on the iris is absorbed. However, the near-IR wavelengths are reflected, carrying the reflected iris pattern information [20]. This is what is captured on the CCD sensor of the camera when we use the IR pass filter. We experimented with various filters [26]. The filters are manufactured using custom made precision ISO2002 German glass. The graph below (Figure 5) shows the amount of visible light transmittance that is achievable using the various filters of this type.
On experimenting with various filters, we found that the use of the 715 nm and the 780 nm wavelength filters in
the proposed system achieved sufficient quality acquisition
images, exposing most of the iris pattern needed for feature extraction. The choice of the 715 nm filter performed the best, yielding the most iris-matching results in our
experiments.Figure 6compares the eye image of a user with
and without a near IR filter attached to the camera.Figure 7
illustrates the entire setup of the system.
0 0.1 0.2 0.3 0.4 0.5 0.6 0.7 0.8 0.9 1
T
ransmittanc
e
600 650 700 750 800 850 900 950 1000 1050 1100 Wavelength (nm) X-Nite630 X-Nite665 X-Nite715 X-Nite780 X-Nite830 X-Nite850 X-Nite1000 www.MaxMax.com IR filter glass transmittance
Figure 5: Transmittance of various filters. The graph shows the various IR filters available, out of which Nite715, Nite780, X-Nite830, and X-Nite1000 were tested for use with the proposed system. It was found that the acquired images were suitable for iris matching when using the X-Nite715 filter. The source of the graph iswww.maxmax.com.
frame, and our algorithm used for this task is described in
Section 3. The camera zooms into the face, so that the active shape model may be accurately fit. The position of the eye can be very accurately obtained from the Active Shape Model (ASM) fitting (seeSection 3for details), which uses multiple facial landmarks around the eye region. Furthermore, the ASM can provide a pose estimate to tell when the user is looking toward the camera. Using the Cartesian coordinates of the eye boundary from the ASM model, we calculate the coordinates of the center of the eye and direct the camera to make this point the center of the acquisition frame. The camera provides built-in functions in order to perform this action. Once this is done, the camera zooms into the frame keeping the eye center as the approximate center of the frame.
Figure 8illustrates the entire process of iris acquisition. From our experiments, we noted that once the user is still, the entire process takes an average of 5 seconds to complete on a standard desktop machine.
A key point to note is that we do not require any calibration of the camera before starting the system. Other stereo camera systems, such as those proposed in [12–14], require a calibration stage that will estimate the 3D world-coordinate system of the face to predict the pan-tilt angles necessary to center on the iris and use the estimated depth to obtain the required focus on the iris region.
In our system, the face detection and eye detection method alleviates the need for calibration. We estimate the pan-tilt angles based purely on the outputs from the face and eye detector. Additionally, the contrast-based focusing mechanism of the camera (Section 2.1) does not require any knowledge of the distance of the individual from the camera alleviating the need for 3D depth estimation.Figure 9shows
different subjects and their irises acquired automatically
using our proposed system.
3. Real-Time Iris Acquisition and Recognition
This section briefly outlines the various algorithms that are used in this system, specifically, the algorithms used for face detection, eye detection, and iris matching.
3.1. Real Time Face Detection. The detection of faces in the frame of the camera is done using the face detection method proposed by Viola and Jones [27]. This method is extremely efficient and has been shown to give good detection accuracy at high frame rates. The algorithm involves three phases— feature extraction, classification using boosting, and mul-tiscale detection. Here, we present a brief overview of the algorithm. Feature extraction for face detection uses a large set of Haar-wavelet-like rectangular features, and an image representation called integral image is used to allow for a fast way to compute the equivalent inner products of these feature sets with the image using only lookup operations. A few examples of possible features selected in the cascade are shown inFigure 10.
The intuition behind the use of these features lies in the fact that faces offer more or less similar topographical distributions of shades. These features can thus indicate the presence (or absence) of certain characteristics in the image, such as multiresolution edges (i.e., to detect the eye region or mouth region). The value of a two-rectangle shows the difference between the sums of pixels within two rectangular regions. The regions have the same size and shape and are horizontally or vertically adjacent. A three-rectangle feature computes the sum within two outside rectangles subtracted from the sum in a center rectangle. A four-rectangle feature computes the difference between diagonal pairs of rectangles. The different rectangle features are shown inFigure 10. A rich feature set allows for a more robust face detector to be learned by the Adaboost algorithm.
Each feature can be considered to be a “weak” binary classifier of a face. The final detector combines the output of each of these features and decides whether the given image has a face or not. The original supervised learning algorithm used by Viola and Jones is AdaBoost. Adaboost takes a number of these “weak” classifiers and obtains a final strong decision rule that is a weighted and signed combination of the weak ones. We can obtain a “weak” classifierh(x) from a feature by assigning it a thresholdθthat is determined during the training phase. If the value of this feature is above/below the threshold value, then it is predicted that the image is or is not a face. Adaboost takes a weighted vote of the decisions of several of these features and outputs the final decision of whether or not the image is a face. This is given as
H(x)=sign ⎧ ⎨ ⎩
i=1 αihi(x)
⎫ ⎬ ⎭,
h(x)= ⎧ ⎨ ⎩
1 if Value of Feature> θ
−1 other.
(a) (b)
Figure6: The image illustrates eyes captures with and without the X-Nite715 near infrared (IR) filter. This filter is an passes near IR wavelength with 50% transmittance at 715 nm. We see that the iris pattern details are clear when we image in the near IR spectrum.
Tilt up
Tilt down 55.8◦
41.8◦
Pan left Pan right
Capture volume
Desk lamp used for illumination
PTZ camera with secondary lens and near IR filter
Subject at a stand-off
of∼1 m Depth depends on iris
resolution required (Table I) 0.97 m
0.73 m
Figure7: This figure shows the system that we setup. It consists of the axis 233D pan-tilt-zoom camera along with a table lamp with a standard 100 W bulb for illumination. The capture volume indicated is limited in depth by the pixel iris resolution required. Because of the autofocus mechanism, even at a fixed zoom level, which is 119 mm in our work, the person can come upto 0.5 meters in front of the lens. The arrows indicate how the volume can move based on the pan-tilt motion of the camera. The field of view of the camera is 55.80×41.80, which is approximately 0.97×0.73 meters at a subject stand-offof 1 meter.
Adaboost maintains a weight distribution over all training samples. The way Adaboost combines features is by analyzing them one feature at a time and finding which feature best separates the data. The data samples correctly classified are down weighted, while the wrongly classified samples are up weighted, and the whole process is reiterated. The error at any given iteration is given by the sum of the weights of the
misclassified samples. Theαt represents how confident the
tth weak classifier is and is given by
αt= 1 2ln
1−εt εt
, (8)
where,εt is the classification error when using thetth weak classifier. IfDt(i) is the weight assigned to theith sample after
the previous iteration, thenεtis given by
εt= n
i=1
Dt(i)Iyi=/ ht(xi)
, (9)
I() is the identifier function such that,
Iyi=/ ht(xi)
= ⎧ ⎨ ⎩
1 if yi=/ht(xi)
0 otherwise, (10)
yi is the true value of the ith sample, while ht(xi)is the predicted output of this sample, by the weak classifier ht() [28].
(e) (d) (c)
Identify the eye location from ASM
model
Center the eye in the frame and zoom in to acquire eye image
with required resolution across iris
(b)
Fit ASM model on the face Zoom into
frame when face is still (a)
Real-time face detection. This helps to track the movement
of a face across the frame
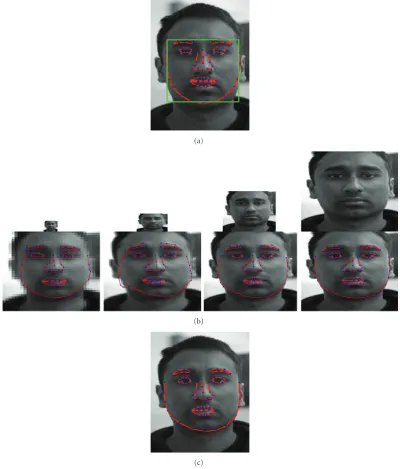
Figure8: The figure illustrates the entire process of iris acquisition using the COTS PTZ camera. (a)The camera detects any face within the frame and moves (pans/tilts) along with it, keeping the face at the center. (b) Once it is sure that the face is still (i.e., the person stops moving), it zooms into the face (c) and fits the Active Shape Model (ASM) model on the face. (d) The position of the eye of interest is read offfrom the ASM output and (e) the camera zooms into the frame keeping this eye at the center (by pan/tilt).
(a) (b)
(c) (d)
(a)
(a) (b)
(c) (d)
(b)
(a) (b) (c) (d)
(e) (f) (g) (h)
Figure10: Example rectangle features shown relative to the enclosing detection window. The sum of the pixels that lie within the white rectangles is subtracted from the sum of pixels in the grey rectangles. Two-rectangle features are shown in (a) and (b). (c) shows a three-rectangle feature, and (d) a four-three-rectangle feature. (e), (f), (g), and (h) show these features overlaid on an acquired face, during the face detection stage. The outputs of several such features are combined to make a final decision as to whether a face is present or not in the frame.
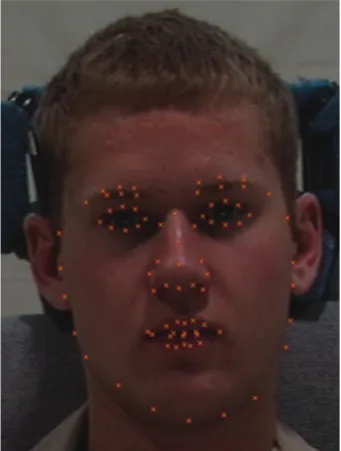
3.2. Eye Detection Using Active-Shape Models. For the pur-pose of eye detection, we rely on a method that parameterizes an input face based solely on the shape of the face. The advantage of this approach is that the eye detection is now free of any effects arising out of facial texture difference, ambient light variations, and so forth. As mentioned previ-ously, we use active-shape models (ASM), which automat-ically detect landmark points that define the shape of any statistically modeled object—in our case, the human face. Here, we briefly describe the formation of an ASM model and how an ASM model is fitted on any previously unseen image. For a more detailed treatment of this approach, the reader is directed to [30–32]. Specifically, we used the latest robust ASM developed by [30].Figure 11shows the ASM points that are fit using [30].
In order to build a statistical facial model, a training set that has images with manually annotated landmarks is used (Figure 11). The training set comprises a subset of images
from the MBGC 2008 database [33].The following are the
stages during training of the ASM
(1) The coordinates of all the keypoints are stored as a shape vectorx=[x1,y1,. . .,xN,yN], wherexiandyi are the coordinates of theith keypoint andN is the number of landmarks used.
(2) Generalized Procustes Analysis [34] is used to align the various shapes (represented byx) with each other.
(3) Following this, principal component analysis (PCA) is computed on these shapes. Eigenvectors that correspond to 97% of the variations are stored. We keep a record of the mean shape,x(i.e., the mean of
Figure11: The 79 keypoints that parameterizes the active shape model for a given face.
all thex) because this serves as the initial shape when we try to fit the ASM on a previously unseen face.
(a) (b)
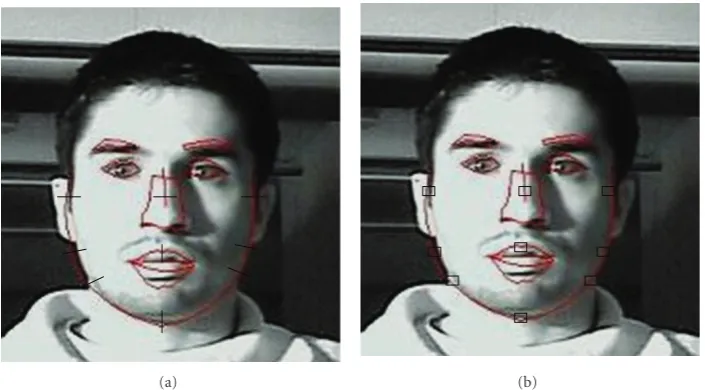
Figure12: Profile constructionduring training is shown, to avoid clutter, for a few points along the boundary of the ASM model and one point each on the nose and the lips. We do the profiling for the entire set of 79 ASM points on the face during training. (a) 1D profiles constructed using lines normal to the shape boundary at a keypoint (b) 2D profilesconstructed using square regions around each keypoint.
previously unseen face. Profiling is used to build a subspace of variations of these intensities across all keypoints, in all the training images. A 1D profile of a keypoint is constructed by sampling the grey level intensities of points that lie alonglines normal to the shape boundary at that point (each line comprises
17 pixels)—see Figure 12. The normalized gradient
of gray level intensities is stored as a vector. The mean of such vectors for each keypoint across all training images is called the mean profile vector
(g) and the covariance matrix of all such vectors
is denoted by Sg. The mean profile vector and
covariancematrix are computed for each keypoint
at four differentlevels in an image pyramid (with
each image in the pyramidhalf the size of the image at the previous level). Similarly, 2D profiles can be constructed for each keypoint by sampling the image gradient in a square region around each landmark. The pixels used for both 1D and 2D profiles are shown for a few keypoints inFigure 12.
Next, we consider what happens when we need to fit an ASM on a new face, that is, one that was not present during the training phase.
(1) The mean face x is scaled, rotated, and translated
to best fit the output of the face detection stage. As mentioned previously, this mean shape model serves as the initial shape model. It has to be deformed to obtain the final shape model associated with the input face.
(2) Profiling is performed in the same manner as during the training phase. Multilevel profiles are constructed around each keypoint from a coarse to a fine level (see
Figure 13). Large adjustments to keypoint locations are made at the coarsest level and smaller adjustments
are made at the finest level. The best location for a landmark is determined by constructing profiles of
neighboring patches around candidate points [30].
The candidate point that bears a profile most similar to the mean profile for that keypoint (the latter being calculated during the training phase, as mentioned before) will be chosen as the new location for the landmark. The similarity measure used in this case is the Mahalanobis distance (D). If the candidate profile
is given byg and the corresponding mean profile is
given bygthen,Dis given by
D=g−gTSg−1
g−g. (11)
This process is repeated until the best location for each keypoint is located. Let this new shape for the given face be represented by the vectorxL. This can be given by the relation
xL=x+Pb, (12)
where x is the mean shape estimated during the training
phase, P is the eigenvector matrix from the ASM shapes
determined during the training phase, and b is a vector
of projection coefficients that needs to be calculated. This stage is necessary to make sure that the obtained shape is
a legal shape modeled by the PCA face subspace [30]. This
is done by iteratively minimizing the mean squared error
xL−T(x+Pb)2during the testing phase.Tis a similarity
transform that minimizes the distance betweenxL and the
(a)
(b)
(c)
Figure13: The mean shape fit on the output of the face detector. (b) shows the different iterations over the face at different resolutions until convergence is achieved at the highest level. This involves profiling, as well as PCA reconstruction-based (see (12)) restriction of the shape to a legal shape [30]. (c) shows the final ASM fit on the detected face.
The process is continued until there is convergence at the highest (finest) level of the pyramid. At this stage, we get the final keypoint locations. The process is illustrated in
Figure 12.Figure 13shows the ASM shape corresponding to two users of the system.
Once the ASM model has been fit for the new face, the
eye position can be read offfrom the keypoints around the
eye (seeFigure 11). More precisely, we calculate the center of the right eye as represented by the ASM keypoints by determining the average location. The camera is instructed to keep this point as the center of the frame and then zoom
into the frame. This ensures that the eye is at the center of the frame when the magnified image is captured.
(a) (b)
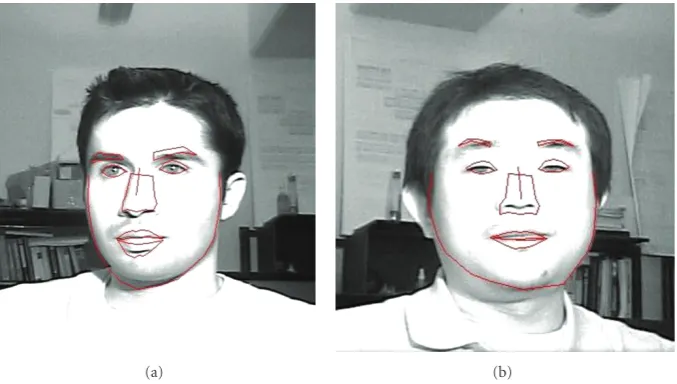
Figure14: Active shape model fitting for two users of the system. The position of the eye can be read offfrom the keypoint locations around the eye (seeFigure 13). The center of the eye is taken as the center of mass of these keypoints.
encodes an iris template (iris code), which is then matched to a set of iris code templates in a stored database. Open set identification is performed in our experiments. First, the user is associated with a class in our database to which he/she is most similar (as indicated by the similarity in iris codes); we then verify whether the person actually belongs to that class. A receiver operating characteristic (ROC) curve is plotted to visualize how robust this verification is in our proposed system (Figure 21).
3.3.1. Segmentation. Any iris identification algorithm must be preceded by a stage that segments the iris pattern from the acquired eye image. This stage consists of clearly delineating the pupillary boundary and the limbic boundary. Once these boundaries are identified, the iris pattern can be isolated by cropping out the region between these boundaries.
In order to correctly identify both these boundaries, the segmentation algorithm used in this work has the following stages as described in [36].
(1) Specular Reflection Removal. Often the main hurdle to accurate iris segmentation is the presence of specu-larities within the iris region. These specuspecu-larities are due to the reflection of the illumination source. This stage of segmentation aims to remove these specularities using pixel information from areas bordering it. A specularity is identified by a simple intensity thresholding operation, owing to its high intensity value compared to the rest of the eye image. For our system, an empirical value for threshold was fixed at 90% of the maximum intensity. Geometrical constraints are also imposed at this stage so that only high intensities closer to the center of the image are detected. This is shown inFigure 15(b). These regions are filled with pixel information from the neighboring pixels, so they look
like an iris region. Due to the off-angle alignment of the
illumination source in our system setup (Section 2.3), a valid assumption here is that the specularity is usually seen within
the iris region. The whole image is smoothed using a median filter to remove any noise. A median filter is better suited for this application, compared to an averaging filter, since the specular reflection that we have to remove now takes on a salt
and pepper appearance (Figure 15). Another advantage of
using a median filter instead of a global averaging filter is that the former preserves the gradient at the limbic and pupillary boundary better than the latter. This is used in the following subsection. Figures15(c)and15(d)depicts this process.
(2) Determination of Pupillary and Limbic Boundaries.
Because the pupil is the darkest regions in the resulting image (Figure 15(d)), it can be localized by intensity thresholding. However, thresholding alone can result in several candidate regions like eyebrows and eyelashes. To eliminate these false candidate regions we analyze the geometric properties of
the connected component as suggested in [36]. A possible
geometric property that we have explored is an approximate height and width of the pupil region. These are empirically set to constant values. Once this is done, we calculate the center of mass of the detected region, to identify the center of the pupil. (The reader should note here that this is not
the same as the center of eye determined in Section 2.4
because the latter is a rough estimate provided to the pan-tilt mechanism for it to zoom into the eye region of the frame.) The pupillary radius is simply the distance from this center to the furthest point in the detected region.
Similarly, the limbic boundary can be determined from
(a) (b)
(c) (d)
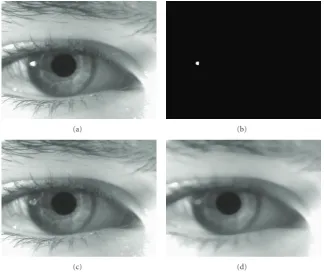
Figure15: Here, we illustrate the steps to localize the limbic and pupillary boundaries. (a) shows the input eye image to be segmented. (b) shows the localization of the specularity present in the image. Intensity thresholding as well as geometrical constraints are used for this purpose. (c) shows the specularity filled with pixel values from the neighbourhood and finally (d) is the result of applying a median filter to (c). Intensity thresholding and geometric constraints help to localize the pupil in (d) following which we identify the pupillary and limbic boundaries as described inSection 3.3.1(2).
Figure 16shows the segmentation results on a few eye images acquired using our PTZ system.
At the end of this sub-section, the reader should note that the median filtered result as depicted inFigure 15(d)is only for the segmentation stage. As mentioned before, the use of the median filter preserves most of the gradient information with regards to the pupillary and limbic boundaries versus using an averaging filter. Once we have determined the centers of the pupil and the iris, as well as the corresponding radii, this information is used to segment the iris from the original image, resulting in the final segmented iris pattern.
3.3.2. Recognition Based on Iris Pattern. Once the boundaries of the pupil and the iris pattern are determined, the next step is to use the segmented iris pattern for identification of the user. We fit a polar coordinate system to the iris region and the image obtained by unwrapping this polarcoordinate system, is referred to as the iris plane [35,37].
The feature extraction method used is described in [37]. An iris code is generated by projecting the iris plane onto a set of complex valued 2D Gabor functions. Each Gabor function Gi(x) is given by
Gi(x)=G0
Rθx,σxi,σyi,fi
. (13)
The unrotated Gabor functionG0(x) is given by
G0
x,σx,σy,f=exp
−1
2
x2 σ2 x
+ y
2
σ2 y
+j2π f0t
. (14)
σxi, σyi, fi, and θi are the parameters for the ith Gabor function andRθis a 2D rotation matrix of angleθwhich is given by
Rθ=
cosθ sinθ
−sinθ cosθ
. (15)
The rotated values of coordinatesxandymay be obtained by multiplying the vectorx=[x y] byRθ. Examples of Gabor functions with different parameters are shown inFigure 17.
The iris bit codec(x) is then generated for each iris image f, as follows:
c(x)= ⎡ ⎢ ⎢ ⎢ ⎢ ⎢ ⎢ ⎢ ⎢ ⎢ ⎢ ⎢ ⎢ ⎢ ⎢ ⎣
sgnRef ∗G1(x)
sgnImf ∗G1(x)
sgnRef ∗G2(x)
sgnImf ∗G2(x)
.. . sgnRef ∗GN(x)
sgnImf ∗GN(x)
⎤ ⎥ ⎥ ⎥ ⎥ ⎥ ⎥ ⎥ ⎥ ⎥ ⎥ ⎥ ⎥ ⎥ ⎥ ⎦
(a) (b)
(c) (d)
Figure16: Results of applying the segmentation described inSection 3.3.1on eye images acquired using our setup. The pupillary boundary is depicted by the red circle while the limbic boundary is depicted by the green circle. The iris pattern is isolated by simply cropping out the region between these two boundaries.
The bit code uses two bits per pixel of the Gabor response, one bit each for the real part of the response and the imaginary part of the response at each position. A match
score between any template iris image code ct(x) and a
query iris image codecq(x) is computed by simply counting the number of matching bits at corresponding locations. The template image is the iris pattern against which the verification is performed and the query image is that pattern which has to be verified as belonging to the class represented by the template. Hence, the match scorem(d) at a relative shiftdbetween template and query is given by
m(d)= 1 |St|
y∈St
ct
yTcq
y−d. (17)
Stis the support of the template iris code and hence|St|is the size of the template. The white pixels inFigure 18(b)indicate the number of pixels that were considered a match when the
iris plane in Figure 18(a)was matched with a subject from
the same class.
A problem to be considered during iris matching of query irises from the same test subject is that the iris plane may undergo local nonlinear deformations due to the contraction and dilation of the pupil during acquisition, as a result of varying lighting conditions. Even though we normalize the radius of the iris to a fixed length, this linear normalization does not fix the nonlinear deformations as the iris sphincter muscles move angularly as well as radially. This nonlinear deformation is represented as a coarse vector field as in [35].
The template iris code is divided into K regions. When
a query image from the same class is compared to this
template image, it is assumed that each of theseK regions
within the template will be closely matched to a neighboring region in the query image. In order to determine the possible alignments of the regions, match scores are computed for shifts of 10 pixels in both the vertical and horizontal direction
at each region. So, for each region i a 21×21 match score
matrixmi(x) is computed. There will beKsuch match score matrices.
Additionally, for each pixelxof the iris plane, an occlu-sion metricπ(x) is computed that measures the likelihood that the pixel belongs to the eyelid rather than the iris pattern. This metric is computed from four local statistics as in [35], namely (1) the mean intensity values within a neighborhood around the pixel, (2) the standard deviation of these intensity values, (3) the percentage of pixels whose intensity is greater than one standard deviation above the mean for the centers of the upper and lower eyelids, and (4) shortest Euclidean distance to the centers of the upper and lower eyelid. A Fisher linear discriminant [38] is then used to generate a single scalar quantity π(x) from the set of four statistics at each pixel. Finally, an overall occlusion metricπiis computed for each regionias the mean of allπ(x) in that region.
If a certain segment in the image has a particular deformation or occlusion state, neighboring segments are more likely to have similar states rather than different ones.
15 10 5 0
−5 −10 −15
−15
−10
−5 0 5 10 15
−1
−0.5 0 0.5
(a)
15 10 5
0
−5
−10
−15 −15
−10−5 0 5
10 15
−1
−0.8
−0.6
−0.4
−0.2 0 0.2 0.4 0.6 0.8 1
(b)
10 5
0
−5 −10 −10
−5 0
5 10
−0.8
−0.6
−0.4
−0.2 0 0.2 0.4 0.6 0.8 1
(c)
10
5
0
−5
−10 −10
−5 0
5 10
−1
−0.8
−0.6
−0.4
−0.2 0 0.2 0.4 0.6 0.8 1
(d) Figure17: Examples of Gabor functions that are used in the feature extraction stage.
(a)
(b)
Figure18: (a) shows an example of an iris plane that is obtained by unwrapping the iris region. The area occupied by the sclera is the U-shaped structure along the top of the rectangular image and at the top corners of the image. (b) shows the number of pixels in this image that were matched with a query iris image belonging to the same subject.
relationship between regions within the iris code. Based on this model, conditional likelihoods P(di | O1,O2,. . .,OK) andP(ωi | O1,O2,. . .,OK) are determined. (For a detailed derivation of these likelihoods, the reader is directed to [35].) Here,dicontains vertical and horizontal shifts of the
template region i. With respect to the query region,i and
ωi is a binary-valued occlusion variable which is either 0
or 1. The former indicates that the corresponding region
is not occluded, and the latter indicates otherwise. Oi is
(a) (b)
(c) (d)
(a) (b)
(c) (d)
Figure19: Face detection, eye detection, and iris acquisition shown for two users of the system. (a) shows the face detector. Once the face is determined to be stationary, the ASM is fitted and this is depicted in (b). (c) shows the position of the right eye read offfrom the ASM and finally (d) is the image of the eye and iris pattern acquired after the lens zooms into the location indicated in (c).
i=1, 2,. . .,K. Once we know these conditional likelihoods, the score for each subregioniis given by
Mi=
d
mi(d)P(di=d|O1,O2,. . .,OK), (18)
wheremi(d) corresponds to the pixel shift represented ind.
The final scoreMfrom all theKsub-regions is computed as
follows:
M=
K i=1βiMi K
i=1βi
, (19)
where the weightsβicorrespond to belief of nonocclusion in the regioni, that is,βi=P(ωi=0|O1,O2,. . .,OK). Receiver Operating Curves (ROCs) generated using such match scores are shown in the next section.
4. Results
This section shows the results of the face detector and the ASM-based eye detector, along with the captured image of the eye/iris. The iris is obtained from this acquired image and is used as the query image for a database of irises that have been collected. The database on which the system was tested has 12 people, with 7 images from each. The images were taken at distances ranging from 0.6 m to 1.5 m with the people in different postures (standing versus sitting) in front of the camera. The average acquisition time for the iris, once the face was detected, is measured to be 5 seconds.
4.1. Face and Eye Detection. The camera turns towards the face of the user wherever he/she may be in the frame, due to the face detection module of our system. In the case of multiple faces, it picks the face that is more dominant in the frame. Once the user limits their motion for about 5 frames, the camera zooms into the frame such that the face occupies roughly 200 pixels across the frame. (This is because the active-shape model fitting requires that the face occupy a
significant portion of the frame). Following this, the ASM model is fit on the face in the frame, and the center of the eye is determined, as described inSection 2. The acquisition process is depicted inFigure 19. The ASM fitting is not always robust along the boundary of the face. This is seen in the figure on the right inFigure 19. This is not the case however with the ASM fitting around the eye, as can be seen in both cases inFigure 19; the key points are always localized properly.
Various eye images acquired using this method are shown in Figure 20, along with their segmentation results, and discussed inSection 3.3.1.
4.2. Open Set Identification. As described in Section 3.3.2, the metric used to measure the similarity between two iris bit codes is the number of matching bits at corresponding locations. It was shown how the match score Mis computed from a given template iris code ct(x) and query iris code cq(x). (See (17), (18), and (19).) Clearly, 0 ≤ M ≤ 1, with M=1 for a perfect match.
In this work, we perform open set identification. In other words, the user is first associated with a class with which the user’s iris code matches best. Following this, a verification experiment is performed to verify whether the user actually belongs to this class or if the user is an imposter. To perform the verification experiments, we first enrolled the 12 users manually, using the same PTZ camera used in the verification stage. Once this was done, the camera was setup to perform iris acquisition as and when users approached the system (as described inSection 2.4). All the irises acquired, along with class information, were recorded before starting the verification experiment.
A user is said to be verified as belonging to a particular
class, only when M is below a set threshold. In
Figure20: Eye images acquired from various users who were at different positions within the capture volume are shown in the first row. The second row shows the segmentation results of these images. The segmentation is discussed inSection 3.3.1.
0 0.1 0.2 0.3 0.4 0.5 0.6 0.7 0.8 0.9 1
V
er
ification
rat
e
0 0.1 0.2 0.3 0.4 0.5 0.6 0.7 0.8 0.9 1 False acceptance rate
Figure21: Receiver operating curve for the database captured with the Axis 233D Network PTZ camera. The verification rate obtained at a false accept rate of 1% (1 image out of 84) is 95% (79 images out of 84). The number of classes used in this experiment is 12, with 7 images per class.
positives and true positives occur across the database. The
ROC in Figure 21 shows the verification rate (VR) versus
the false accept rate (FAR). The vertical axis of this plot represents the true accept rate (i.e., the rate of correctly verifying a person), and the horizontal axis represents the false accept rate (i.e., the rate of erroneously verifying a person as being someone else). We see that we get a VR of 95% (79 out of 84 images) when the FAR is 1% (1 image out of 84). In other words, 95% of the people in the database were correctly identified, while only 1% were falsely identified.
Table 1helps to visualize this graph in terms of the actual numbers of irises that were correctly identified versus those that were incorrectly identified. Each row in this table is a point on the graph in Figure 21, that is, for a particular value of threshold. The threshold value increases from row
1 to 5 in the table.Table 2 compares the relevant features
of our system compared with other state of the art systems mentioned in the introduction.
We see fromTable 2 that the proposed system achieves
a greater capture volume than other systems that were mentioned in the introduction. We do this using the pan-tilt functionality of the system. Additionally, there is no upper limit for the capture volumes; this depends entirely
Table 1: Useful values for visualization of result depicted in Figure 21. The first column indicates the number of true positives for increasing values of thresholds in the iris similarity metric. The second column indicates the number of false positives for the same. Number of true accepts Number of false accepts
79 1
80 5
81 10
83 15
84 22
on the iris pixel resolution required by the iris verification algorithm. We required a minimum resolution of 100 pixels using [35], and, hence, the limit for our experiments is 2.1 meters, as depicted inFigure 4. At this maximum stand-off, the illumination provided by a standard 100 W bulb suffices, in order to acquire the required iris images. This decreases the illumination requirement of our system as compared to the rest of the systems shown. An additional point to note is that all the other systems have a large form factor requiring more than two cameras and additional hardware. This is another area where our system improves on other systems because it uses only a standard security COTS PTZ camera along with COTS filters and lenses. (SeeFigure 2(b).) This significantly reduces the cost of the final system. Our system is also plug and play, requiring no calibration before use. For all other systems, a multicamera approach is advocated. The purpose of this is to use stereo vision to estimate depth. This depth information is then used to zoom (if required) to the iris and to perform autofocus.
5. Conclusion
This paper describes an unconstrained medium stand-off
range iris acquisition and recognition system built using a
commercial off-the-shelf (COTS) PTZ camera, which can
Table2: Comparison of relevant features of the proposed system with other state of the art systems. System specific features SarnoffIris On the Move
[11] Retica Eagle Eyes [16] Wheeler et al. [14] Proposed System Time to iris acquisition
(seconds) 2 6.1 3.2 5
Heigth×Width of Capture
volume (m) 0.2×0.4 3×2
0.076×0.076 for the narrow field of view camera. The details are not
mentioned for the wide field of view camera
Not constrained, duepan/tilt capability.
Depth of capture volume
(m) 0.1 3 <1.5
1.6 (limited by iris resolution) Minimum stand-off
distance (meters) 3 3 Not mentioned in paper 0.5
Number of cameras used 4 3 3 1
Additional requirements Portal with multiple near-IR illuminators
Laser illuminator,
range-finder Near-IR illumination panel
Standard 100 W table lamp if ambient IR illumination
(from sunlight) is not sufficient. Initial Calibration
required?
Yes, in order to determine camera heights and camera
focus position
No
Yes, for the wide field of view cameras, in order to estimate depth from stereo
No
the use of a single COTS camera (a monocular system) with relevant algorithms that can handle both face capture and iris capture and can provide the proposed large dynamic capture volume for unconstrained acquisition at about 1.5 m
stand-off. Almost all state-of-the-art research in reduced
constrained iris acquisition use two cameras for this purpose
[14–17]). The long-range Iris On-the-Move (IOM) system
uses only one camera for both face and iris capture. However, the drawback in this system is the limited capture volume (5 cm−10 cm [11]) and associated large form factor and cost as compared to our system, which is of the form of a simple PTZ surveillance camera.
Our work has blended many state-of-the-art techniques for face detection and facial shape modeling for the purpose of accurate eye detection and iris pattern feature extraction. Face detection helps to localize the position of the user in the frame and to track the user’s movements before applying the ASM for facial landmark localization (useful for pose estimation). The tracking output controls the pan-tilt mechanism of the camera. Once the user is detected, the camera automatically zooms in to capture the face and fit the ASM model (which works optimally when the user restricts motion). The ASM model helps to localize the position of the eye in the frame. The lens then zooms into its telephoto end, keeping this eye position at the center of the frame.
Initial experimental setup of 12 test subjects with 7 eye images per subject, show that we are able to consistently acquire eye images with 200 pixels across the iris on an average. This is a significant achievement because most standard algorithms require greater than 100 pixels diameter for useful feature extraction and matching. In addition to the use of only the iris information that is captured, the system can be modified for multibiometric recognition applications
since the face and periocular regions are being captured during the process of acquiring the iris.
References
[1] J. Daugman, “Probing the uniqueness and randomness of iriscodes: results from 200 billion iris pair comparisons,” Proceedings of the IEEE, vol. 94, no. 11, pp. 1927–1934, 2006. [2] J. Daugman, “Biometric personal identification system based
on iris analysis,” US patent no. 5, 291, 560, March 1994. [3] P. J. Phillips, K. W. Bowyer, P. J. Flynn, X. Liu, and W. T.
Scruggs, “The iris challenge evaluation 2005,” inProceedings of the IEEE 2nd International Conference on Biometrics: Theory, Applications and Systems (BTAS ’08), pp. 1–8, October 2008. [4] P. Phillips, W. Scruggs, A. Toole et al., “FRVT 2006 and
ICE 2006 large-scale results,” Tech. Rep. NISTIR 7408, 2006, http://iris.nist.gov/ice/ice2006.htm.
[5] R. P. Wildes, “Iris recognition: an emerging biometrie tech-nology,”Proceedings of the IEEE, vol. 85, no. 9, pp. 1348–1363, 1997.
[6] Y. Du, R. Ives, B. Bonney, and D. Etter, “Analysis of partial iris recognition,” inBiometric Technology for Human Identification II, vol. 5779 ofProceedings of SPIE, pp. 31–40, 2005.
[7] Y. Du, B. Bonney, R. Ives, D. Etter, and R. Schnltz, “Analysis of partial iris recognition using a 1-D approach,” inProceedings of the IEEE International Conference on Acoustics, Speech, and Signal Processing (ICASSP ’05), vol. 2, pp. II961–II964, March 2005.
[8] American National Standards Institute (ANSI), Z136-1-1993. [9] American Conference of Government Industrial Hygienists
(ACGIH)‘Threshold Limits Values’ 1994.
acquisition of images for iris recognition in less constrained environments,”Proceedings of the IEEE, vol. 94, no. 11, pp. 1936–1946, 2006.
[12] OKI Irispass,http://www.oki.com/en/iris/.
[13] U. Cahn von Seelen, T. Camus, P. Venetianer, G. Zhang, M. Salganicoff, and M. Negin, “Active vision as an enabling technology for user-friendly iris identification,” inProceedings of 2nd IEEE Workshop on Automatic Identification Advanced Technologies, pp. 169–172, 1999.
[14] F. W. Wheeler, A. G. A. Perera, G. Abramovich, B. Yu, and P. H. Tu, “Stand-offiris recognition system,” inProceedings of the IEEE 2nd International Conference on Biometrics: Theory, Applications and Systems (BTAS ’08), October 2008.
[15] G. Guo, M. Jones, and P. Beardsley, “A system for auto-matic iris capturing,” Tech. Rep. TR2005-044, Mitsubishi Electric Research Laboratories, 2005, http://www.merl.com/ publications/TR2005-044/.
[16] F. Bashir, P. Casaverde, D. Usher, and M. Friedman, “Eagle-eyesTM: a system for iris recognition at a distance,” in Proceed-ings of the IEEE International Conference on Technologies for Homeland Security (HST ’08), pp. 426–431, May 2008. [17] S. Yoon, H. Jung, K. Park, and J. Kim, “Non-intrusive iris
image acquisition system based on a pan-tilt-zoom camera and light stripe projection,” inOptical Engineering, vol. 48, pp. 037202–037202-15, 2009.
[18] http://www.aoptix.com/biometrics.html.
[19] Axis 233D Datasheet, http://www.axis.com/products/cam 233d/index.htm.
[20] C. Boyce, A. Ross, M. Monaco, L. Hornak, and X. Li, “Multi-spectral iris analysis: a preliminary study,” in Proceedings of Computer Vision and Pattern Recognition on Biometrics Workshop, 2006.
[21] Application Programming Interface,http://www.axis.com/. [22] ANSI INCITS 379-2004: Iris Image Interchange Format. [23] J. Forrester, A. Dick, P. Mcmenamin, and W. Lee,The Eye: Basic
Sciences in Practice, W. B. Saunder, London, UK, 2001. [24] S. Ray,Applied Photographic Optics, 3rd edition.
[25] http://www.bhphotovideo.com/c/product/56779 REG/Tiffen 52CUS 52mm Close up Glass Lens.html.
[26] http://www.maxmax.com/.
[27] P. Viola and M. Jones, “Rapid object detection using a boosted cascade of simple features,” inProceedings of the IEEE Computer Society Conference on Computer Vision and Pattern Recognition, pp. I511–I518, December 2001.
[28] Y. Freund and R. Schapire, “A short introduction to boosting,” Journal of Japanese Society for Artificial Intelligence, vol. 14, pp. 771–780, 1999.
[29] http://sourceforge.net/projects/opencvlibrary/.
[30] K. Seshadri and M. Savvides, “Robust modified active shape model for automatic facial landmark annotation of frontal faces,” inProceedings of the IEEE 3rd International Conference on Biometrics: Theory, Applications and Systems (BTAS ’09), 2009.
[31] T. F. Cootes and C. J. Taylor, “Statistical models of appear-ance for computer vision,” Tech. Rep., Imaging Science and Biomedical Engineering, University of Manchester, Manch-ester, UK, 2004.
[32] T. F. Cootes, C. J. Taylor, D. H. Cooper, and J. Graham, “Active shape models—their training and application,” Computer Vision and Image Understanding, vol. 61, no. 1, pp. 38–59, 1995.
.nist.gov/mbgc/.
[34] J. C. Gower, “Generalized procrustes analysis,”Psychometrika, vol. 40, no. 1, pp. 33–51, 1975.
[35] R. Kerekes, B. Narayanaswamy, J. Thornton, M. Savvides, and B. V. K. Vijaya Kumar, “Graphical model approach to iris matching under deformation and occlusion,”Proceedings of the IEEE Computer Society Conference on Computer Vision and Pattern Recognition, 2007.
[36] Y. Li and M. Savvides,A robust approach to specularity removal and iris segmentation, Ph.D. thesis, Department of Electrical and Computer Engineering, Carnegie Mellon University, Pittsburgh, Pa, USA, 2009.
[37] J. Daugman, “High confidence recognition of persons by iris patterns,” inProceedings of the 35th Annual International Carnahan Conference on Security Technology, pp. 254–263, October 2001.