ABSTRACT
HASAN, MD REJAUL. Total Cost of Ownership of Responsible Apparel Production in Low Cost Country (Under the direction of Dr. Marguerite Moore and Dr. Robert Handfield).
Low cost production is a major motivation for global apparel brands and retailers to
source apparel from less developed countries. However, low-cost apparel production is
commonly accompanied by human rights violations. Research suggests that brand and retailer
pricing practices are a major reason behind labor rights violations in global apparel supply
chains (Anner, 2013). To date, academics and practitioners remain unaware of the actual cost
of responsible supply chains that ensure adequate labor rights. To address this gap, this study
establishes a baseline cost model and a responsible cost model that considers the cost of labor
standards implementation based on a Total Cost of Ownership (TCO) approach. Actual cost data
for cotton t-shirt production is provided by nine Bangladeshi factories who supply major
western brands. Further, audit data for labor practices among the nine factories is also
reviewed to establish an understanding of each factory’s current labor practices. The research
suggests an average $0.08 difference in the cost of producing a t-shirt under regular conditions
versus under the minimum responsible condition. Sensitivity analysis is performed on the
model inputs and implications for practice and future research are offered.
Global apparel brands and retailers have sourced apparel from less developed countries for the
past two decades, which has been commonly accompanied by severe human rights violations.
Recent research suggests that brand and retailer pricing pressure is the primary (but not the
only) root cause behind these violations of human rights. Following the media attention, efforts
have been made to establish public policy and regulation (e.g. the Bangladesh Accord) but
establish a baseline for creation of meaningful policy and regulation, we sought to create a
rigorous assessment of the true cost of apparel production. In this research, we begin by
describing why public policy and government regulations (PPGR) has had limited success in
impacting low cost apparel working conditions and propose that policymakers and
governments are not equipped with the right production and supply chain data to develop and
negotiate effective policies. In addressing this shortfall, we model the cost of apparel
production in low-cost countries, applying a total cost of ownership (TCO) methodology. The
estimated model output draws from in-depth actual production cost data and offers a
comprehensive methodology for construction of generalized TCO models for apparel
production/supply chain including formulas, data sources, and taxonomies. Finally, we develop
important insights on how development of TCO models can inform public policy and
government regulations (PPGR) to ensure compliance with improved working conditions in
low-cost countries. These proposals include specific guidelines regarding a) payment of living wages
for workers, b) financial restructuring for improvement of factory conditions, and c) transparent
pricing to sustain the effort. We believe these policy guidelines have the potential to shift the
Total Cost of Ownership of Responsible Apparel Production in Low-cost Country
by
Md Rejaul Hasan
A dissertation submitted to the Graduate faculty of North Carolina State University
in partial fulfilment of the requirements for the degree of
Doctor of Philosophy
Textile Technology Management
Raleigh, North Carolina 2019
APPROVED BY: _______________________________
Dr. Robert Handfield Co-Chair of Advisory Committee
_______________________________ Dr. Marguerite Moore
Co-Chair of Advisory Committee
_______________________________
Dr. Nancy Cassill _______________________________ Mark Messura
_______________________________ Dr. Mark Anner
ii DEDICATION
I dedicate this research to my great father Md. Faruk Hossain, my amazing mom Amena
Begum and my beautiful daughter Raidah. The kind of sacrifice my mom & dad did for me is
extremely rare in the world. My father worked twenty hours a day for more than sixteen years
to raise me up and to ensure that I can pursue my dream. My mom has accepted to take over
all our family responsibilities so that I can study in a peaceful mind. My mom not only
succeeded to raise his son to have a Ph.D., but also two daughters with MBBS, one daughter
with MBA and the other son as an upcoming Chemist. My daughter Raidah, whom I owe a huge
debt for living without me for long four years during my doctoral study. I exist only because of
iii BIOGRAPHY
Rejaul was born and brought up in Dhaka, the capital city of Bangladesh. He had a
wonderful childhood and young age of growing up in the lively and colorful megacity, Dhaka.
Rejaul completed his Bachelor in Textile Engineering from the University of Dhaka, the best
textile school in Bangladesh with First Class First position among 165 distinguished peers. After
that, he was awarded competitive & prestigious Equity & Merit Scholarship for pursuing his M.
Sc in Textile Science & Technology at University of Manchester, United Kingdom. Before joining
NC State Ph.D. program, Rejaul worked in the country level management position for almost
five years in the leading sporting goods retailers named Decathlon. His global sourcing and
supply chain responsibilities included numbers of projects across Bangladesh, Vietnam,
Cambodia, China, France, and Morocco. During this time, Rejaul also worked as Visiting
Assistant Professor at National Institute of Textile Education & Research (NITER) at Bangladesh,
one of the prestigious textile education institute in Bangladesh.
At NC State University, he led his Ph.D. research project collaborated among NC State
College of Textiles, Poole College of Management, Cotton Incorporated, and Pennsylvania State
University. He has disseminated his research outcomes in Responsible Sourcing Conference at
Harvard University, ARCS 2018 Conference at MIT Sloan, Sustainable Fashion Conference 2018
at London College of Fashion. He was featured in NC State Graduate School Think Magazine
2017, NC State annual sustainability report 2017, and NC State Alumni Magazine 2018.
He was also an associate of Business Sustainability Collaborative, Poole College of Management
iv Ethics Fellowship by NC State Graduate School in 2016-17. He has also founded a start-up to
v ACKNOWLEDGEMNTS
Thanks to almighty who provides me all the courage and energy to purse the long and
arduous journey of doctoral study. I am extremely grateful to my parents, siblings, wife &
daughter who has accepted the options of endless sacrifice allowing me to chase my career
ambition. My heart-felt gratitude’s to Prof. Marguerite Moore and Prof. Robert Handfield for
their intensive support & coaching throughout the entire time. The endless inspiration of Prof.
Marguerite along with unconditional support helped me to overcome many apparently
impossible hurdles during my doctoral study. Gratitude to Prof. Handfield mentored me for
many hours to build my supply chain knowledge and capabilities. Thanks to Prof. Mark Anner
from Pennsylvania State University for his selfless support and offering his deep insight into this
study. I am grateful to Mark Messura for educating me with his deep industrial insights and
offering me every possible support whenever needed. Thanks to Prof. Nancy Cassill for being
vi TABLE OF CONTENTS
LIST OF TABLES...ix
LIST OF FIGURES...x
CHAPTER 1: Total Cost of Ownership as an Enabler of Public Policy & Government Regulation Reforms in Low Cost Apparel Factories ... 1
1.1 ABSTRACT ... 1
1.2 INTRODUCTION ... 3
1.3 LITERATURE REVIEW ... 8
1.3.1 Policy and Regulation Failures in Bangladesh ... 9
1.3.2 Total Cost of Ownership ... 14
1.3.3 Total Cost of Ownership in Apparel Industries ... 16
1.3.4 Integrating Total Cost of Ownership into the PPGR Dialogue in Bangladesh ... 19
1.4 METHODOLOGY ... 20
1.4.1 Sample ... 21
1.4.2 Sample Product ... 24
1.4.3 Data Collection ... 25
1.4.4 Analysis ... 27
1.5 RESULTS ... 28
1.6 DISCUSSION ... 34
1.6.1 Implications for Public Policy & Government Regulations (PPGR) ... 37
1.6.2 Living Wage... 38
1.6.3 Financial Restructuring ... 41
1.6.4 Transparent Pricing Policy ... 45
1.7 LIMITATIONS & FUTURE RESEARCH ... 46
1.8 REFERENCES ... 48
CHAPTER 2: Establishing Total Cost of Ownership for Apparel in Responsible Production Conditions ... 56
2.1 ABSTRACT ... 56
2.2 INTRODUCTION ... 57
vii
2.3.1 Product Costing for Apparel ... 62
2.3.2 Costing Methods ... 62
2.3.3 Costs Associated with Sourcing ... 63
2.3.4 Cost Models for Apparel ... 64
2.3.5 Total Cost of Ownership (TCO) ... 65
2.3.6 Total Cost of Ownership (TCO) Approach ... 66
2.3.7 Application of TCO ... 66
2.3.8 Limitations of Total Cost Ownership (TCO) ... 67
2.3.9 Total Cost of Ownership in Apparel Industries ... 68
2.3.10 Labor Rights Standards ... 70
2.3.11 Labor Rights Violations ... 72
2.3.12 Drivers of Labor Rights Violations ... 73
2.3.13 Determining the Cost of Labor Rights ... 74
2.4 METHODOLOGY ... 75
2.4.1 Responsible Production Standard for TCO Model ... 76
2.4.2 Contribution of Responsible Production Standard on Factory Cost ... 76
2.4.3 Application of the RTCO Model for a Set of Sample Suppliers in Bangladesh (N=9) ... 87
2.5 RESULTS ... 94
2.6 DISCUSSION ... 99
2.6.1 Cost Component for Responsible Production Standard ... 102
2.7 CONCLUSION ... 108
2.7.1 Contribution to Research ... 108
2.7.2 Practical Implications ... 109
2.7.3 Limitations & Future Research Directions: ... 110
2.8 REFERENCES ... 111
CHAPTER 3: Future Directions for Responsible Apparel Production: Stakeholder Perspectives ... 120
3.1 ABSTRACT ... 120
3.2 INTRODUCTION ... 121
viii
3.3.1 Selection of Key Informants ... 122
3.3.2 Data Collection ... 123
3.3.3 Analysis ... 124
3.4 RESULTS ... 124
3.4.1 Research Objective One (RO1) ... 127
3.4.2 Research Objective Two (RO2) ... 129
3.4.3 Research Objective Three (RO3) ... 132
3.5 CONCLUSIONS ... 135
3.6 IMPLICATIONS ... 136
3.7 LIMITATIONS AND FUTURE RESEARCH ... 138
3.8 REFERENCES ... 140
APPENDICES ... 141
APPENDIX A: T-Shirt Specification ... 142
APPENDIX B: Cost Break Down (CBD) ... 143
APPENDIX C: SAM, Efficiency, PPM ... 144
APPENDIX D: Labor Rights Stannard... 147
Appendix E: Cover Letter for Key Informant Contact ... 150
ix LIST OF TABLES
Table 1. 1: Final Factory Sample (N=9) ... 24
Table 1. 2: Product Selection for TCO ... 25
Table 1. 3: Formulas for TCO Calculations ... 27
Table 1. 4: Total Cost of Ownership for t-Shirt Production among Bangladeshi Sample (N=9) .. 30
Table 1. 5: Factory Operation Data ... 32
Table 2. 1: Labor rights standards developed for Responsible TCO model………..………. 76
Table 2. 2: Final Factory Sample (N=9) ... 89
Table 2. 3: Product Selection for TCO ... 90
Table 2. 4: Formulas for TCO Calculations ... 92
Table 2. 5: Source of different labor rights implementation cost ... 93
Table 2. 6: Responsible Total Cost of Ownership for t-Shirt Production among Bangladeshi Sample (N=9) ... 95
Table 2. 7: Factory Operation data ... 98
x LIST OF FIGURES
Figure 1. 1: TCO for Sample Factories (N=9) ... 31
Figure 1. 2: Average t-shirt TCO ... 33
Figure 1. 3: Disaggregated Average Cost of Making (CM) for Sample Factories (N=9) ... 34
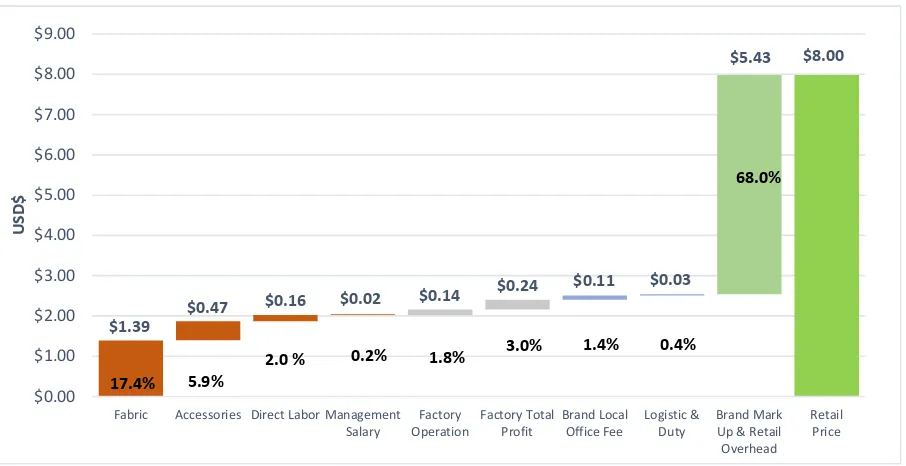
Figure 1. 4: Average t-shirt TCO and Retail Store Price (N=9) ... 37
Figure 1. 5: Average t-shirt TCO at Country Living Wage ... 40
Figure 2. 1: Responsible TCO for Sample Factories (N=9)... 96
Figure 2. 2: Average t-shirt Responsible TCO ... 97
Figure 2. 3: Responsible TCO for Sample Factories (N=9)... 98
Figure 2. 4: Average Responsible Factory Expense ... 101
Figure 2. 5: Average Responsible TCO for t-shirt at Varying Living Wage ... 104
Figure 2. 6: Average Responsible TCO for t-shirt at varying Health cost ... 105
Figure 2. 7: Average Responsible TCO at Varying Remediation Cost ... 106
1
1
CHAPTER 1: Total Cost of Ownership as an Enabler of Public Policy
& Government Regulation Reforms in Low Cost Apparel Factories
1.1
ABSTRACT
Global apparel brands and retailers have sourced apparel from less developed countries
for the more than past two decades, which has been commonly accompanied by severe human
rights violations. Recent research suggests that brand and retailer pricing pressure is the
primary (but not the only) root cause behind these violations of human rights. Following the
media attention, efforts have been made to establish public policy and regulation (e.g. the
Bangladesh Accord) but results also suggest that very little has changed. To shed light on this
problem and establish a baseline for creation of meaningful policy and regulation, we sought to
create a rigorous assessment of the true cost of apparel production. In this research, we begin
by describing why public policy and government regulations (PPGR) have had limited success in
impacting low cost apparel working conditions and propose that policymakers and
governments are not equipped with the right production and supply chain data to develop and
negotiate effective policies. In addressing this shortfall, we model the cost of apparel
production in low-cost countries, applying a total cost of ownership (TCO) methodology. The
estimated model output draws from in-depth actual production cost data and offers a
comprehensive methodology for construction of generalized TCO models for apparel
production/supply chain including formulas, data sources, and taxonomies. Finally, we develop
important insights on how development of TCO models can inform public policy and
low-2 cost countries. These proposals include specific guidelines regarding a) payment of living wages
for workers, b) financial restructuring for improvement of factory conditions, and c) transparent
pricing to sustain the effort. We believe these policy guidelines have the potential to shift the
3
1.2
INTRODUCTION
In recent decades, textile and apparel supply chain production for western consumption
continues to be adopted by major brands that seek to continually drive down cost. In their
pursuit of ever-lower costs, production has moved to the “new” low wage arbitrage targets of
Vietnam, Sri Lanka, Pakistan, Bangladesh, and South Africa. The practice of western brands
contracting to offshore producers in low cost countries continues to be a widely accepted
business practice that has proliferated over 20 years (Made in China, 2015; Baldwin & Forslid,
2013). Today, over 90 percent of global apparel is produced in low-cost Asian countries such as
Bangladesh, India, Vietnam, Cambodia, and China. As a result, apparel supply chains are
increasingly controlled by large brands who demand increasingly shrinking piece prices from
small niche manufacturers, who have little market power and unsophisticated management
systems to control cost (WTO Statistical Review, 2017; Berg & Hedrich, 2014).
In the last five years, a sudden series of disasters and media stories has caught the
attention of the public and of policy makers, shedding light on the abysmal working conditions
that exist in these low-cost factories. The largest of these, the Rana Plaza collapse in
Bangladesh occurred on April 24, 2013, killing 1,134 workers in the largest structural failure
accident in modern human history. This event led to increased public scrutiny of the working
environments of factories in not just Bangladesh but other countries that have failed to comply
with even the most rudimentary Western work policy standards. A litany of “excuses” for this
state of affairs was proffered by academics, including inadequate government regulation, a
4 downward cost pressure (Alamgir & Banerjee, 2018; Anner, 2017; Baumann-Pauly et. al., 2015;
Bartley & Egels-Zand_en., 2016; Anner & Hossain., 2014; Seidman, 2007).
After the news of Rana Plaza passed, nothing really changed. The major brands continue to
adopt an “arms’s length” attitude to labor violations, under the guise that they cannot control
off-shore practices of third parties. This is further complicated by the move to FOB price
contracts, in which apparel factories are no longer simply operating “cut and sew” operations
but are now being held accountable to cover all of the indirect costs associated with sourcing
material, transportation, insurance, factory safety and other indirect costs of running a factory.
The outcome, not surprisingly, is that most low-cost factories struggle to eke out 3-4 % profit
margins and must further skimp on overhead and worker wages to be competitive, leading to
unfair working conditions, avoiding western brand “audit” requirements, and reduction of
worker pay to sub-living wage levels. And yet, the true cost of apparel production remains an
elusive topic in the academic literature, despite the relationship of cost to the condition of
factory working conditions (Donaldson, 2018; Wieland & Handfield, 2013). Without insight into
the total cost of low wage factory production, the ability of policy-makers to create effective
regulations and watch-dog initiatives is hobbled.
To be fair, the issue of worker rights has led to some significant improvements in labor
policy in Bangladesh. In the immediate aftermath of the Rana Plaza incident, three major
policy and regulatory responses emerged.
The “National Tripartite Plan of Action (NTPA)” led by the Bangladesh Government (ILO,
5
The “Alliance for Bangladesh Workers’ Safety (Alliance)” led by 26 major North
American apparel brands and retailers, and
The “Accord on Fire and Building Safety in Bangladesh (Accord)” led by more than 200
European Brands and Retailers for government regulatory change and industry
self-regulations including examination of cause and prevention of future incidents (Khan &
Wichterich 2015).
While NTPA has been largely ineffective over the last five years, the Accord and Alliance
initiatives reported that more than 80 percent completion of their safety programs have been
completed. These programs include the completion of more than 2,000 factory safety audits
and remediation of well-over 100,000 factory safety issues (Accord & Alliances Progress Report,
2017, 2018). While recent research supports the fact that the Accord has brought a significant
improvement in the factory building safety in Bangladesh (Anner, 2018), the documented
effectiveness of these activities on worker wage and safety outcomes remains undetermined.
Critics of these initiatives cite numerous shortcomings that impact their scope and long-term
effectiveness. The most critical suggest that that Accord measures are superficial and fail to
address the fundamental driver of labor violations in Bangladesh, namely the low-cost supply
chain dynamics driven by the brands (Anner, 2018; Alamgir & Banerjee, 2018; Baumann-Pauly
et. al., 2015). Specifically, empirical research shows that the incessant downward pressure on
price and production lead times by the apparel brands creates an environment in which labor
rights violations are inevitable (Anner, 2013). An update to this study shows that conditions
6 percent and eight percent, respectively, in the last five years (Anner, 2018). This leads us to the
first set of research questions:
RQ1: Are factory working conditions a function of the cost pressure created by the large
apparel brands?
RQ2: Can a “fair cost” be stipulated as a basis for policy and regulatory reform that
extends across all brands to ensure worker safety and a living wage?
These questions presuppose that labor violations in the apparel industry will continue to
persist until such time as an analytic approach is used to support an effective policy and
regulatory response. As supply chain researchers, we are proposing that complex policy issues
must be grounded in a realistic analysis of industry costs at the factory level to be objective,
and to drive change. The intersection of supply chain methods with public policy assumes that
brands who contract in this milieu will agree to a “level playing field”, so long as the “fair cost”
of operating in these regions are unbiased and applied to all players in an unequivocal manner.
To date, no fair and objective cost analysis has been conducted, largely due to the proprietary
nature of cost data and the unwillingness of factory owners to share such data.
If we can answer the first two questions in the affirmative, the apparel industry and
developing country governments have an opportunity to collaborate on a PPGR initiative that is
grounded in data, and which can demonstrate a real cost-based standard for supply chain
transactions. In this research, we seek to advance this goal, through development of a standard
nomenclature and analytical method to identify and examine factory costs in Bangladeshi
price-sensitive apparel supply chains as a basis for government policy and industry regulation.
7 adopted in the research. This methodology has a reputation for being flexible, comprehensive
and practical in establishing supply chain cost vectors (Saccani et. al., 2017). If such an approach
is feasible to calculate, it may be used to set a standard to address the following set of research
questions:
RQ3: Can the elements of total cost in low-cost apparel factories be modelled to
calculate the true cost of sustainable and fair apparel production in low-cost countries?
RQ4: Can the results of an industry-government collaboration on a total cost of
ownership (TCO) data standard inform better public policy and government regulations
(PPGRs)?
While an ambitious goal, the research team set out to address these questions. With
respect to the Accord, we hope to provide guidelines that may serve to improve both it
substance and deployment. Specifically, a proof of concept TCO analysis was undertaken,
employing actual cost data collected from nine Bangladeshi factories producing cotton t-shirts
for large Western brands. These data are particularly relevant, given the prominence of
Bangladesh as a low-cost apparel supplier to the west (Brandão, 2018; Wieland & Handfield,
2014). The concrete detail of the cost data was collected through individual interviews and
one-on-one sharing of spreadsheets, based on the strong relationship between the researcher and
comptrollers in these factories. Taken as a whole, these data have the potential to provide a
level of unprecedented transparency to formulate TCO standards, fair wages, appropriate
factory overhead standards, and actionable public policy and government regulation (PPGR) for
apparel supply chains. This approach seeks to be mutually beneficial to the brands, to factory
8 Identification of the elements unique to low-cost apparel supply chains is an important
stepping stone in appeasing the controversy in the press surrounding the determination of a
‘living wage’, while producing actual cost data to address the excuse that factories cannot
afford to pay workers more. For policy makers, the development of an unbiased TCO analytical
methodology and nomenclature for establishing fair working standards in apparel and related
industries is possible. Once established, TCO analysis can be used to assess collect data and
establish the degree of transparency in factories to support decision making, contract
negotiation, and sourcing policy for the private sector, while establishing a grounded basis for
ascertaining that responsible production objectives are being complied with and satisfy PPGR
bureaucrats. By demonstrating a standard that allows comparison to actual factory data, this
research contributes to the broader goal of creating sustainability insights in a framework that
account for impacts on all stakeholders in an integrative fashion: brands, workers, and contract
manufacturers (Montabon et al., 2016).
1.3
LITERATURE REVIEW
There exists limited academic research in the domain that intersects supply chain
management and public policy / government regulations (PPGR), especially when it comes to
how supply chain methods can inform improved PPGR (Spring et al., 2016). In setting out to
explore this intersection as it related to offshore apparel production, we first identified a
limited body of research exploring regulatory reforms in Bangladesh (and other low-cost
sourcing countries) that sought to ensure worker factory safety. Notably much of this work
9 employment relations area. This research was helpful in defining the scope and limitations of
existing policy and regulations in Bangladesh as they related to fair factory working conditions.
These insights provided a measure of support to our initial hypothesis (embodied in
Research Question 1) that cost pressures have been largely responsible for a lack of progress in
worker safety post-Rana Plaza. To better understand the nature of this pressure, we sought to
identify an approach that would define the components of cost, and endeavor to ascribe these
components to those elements that impacted worker wages and safety. In this pursuit, we
were directed to the significant body of conceptual and empirical work delineating the
application of Total Cost of Ownership to such problems. After examining the structure,
benefits and limitations of the TCO approach, we adopted this modeling framework to provide
the methodological direction for documenting the true costs of production in low-price global
apparel supply chains. To support this approach, we relied on the existing research on costing
within the apparel industry and discovered a number of gaps that exist in documenting the true
cost of manufacturing in low cost countries. Finally, we explored whether TCO has been linked
to public policy and government regulations and discovered that our approach was indeed
unique. We thus summarize this progression in the sections below.
1.3.1 Policy and Regulation Failures in Bangladesh
Like other major low-cost sourcing countries, Bangladesh is known for its weak public
policy and government regulations in the apparel industry, a fact which ultimately encourages
multinational corporations and foreign direct investment (FDI) to the country (Alamgir &
10 recently, worker rights in the apparel industry was largely monitored by the voluntary audit and
compliance requirements of the brands and retailers, under the guise of a CSR (Corporate Social
Responsibility) program (Baumann-Pauly et. al., 2015). As prior research suggests, such
voluntary private regulations are often less effective in countries with poor compliance to
government regulations (Toffel et. al., 2015). This research proposes that stronger regulations
are only one part of the solution; improved working conditions are a function of both voluntary
regulations and effective public regulation (Locke, 2013). The incidents of Rana Plaza and
Tazreen Fashion in Bangladesh are deadly illustrations of how poorly voluntary private
compliance works in the presence of weak government regulation.
Post Rana Plaza, the Bangladesh government signed the NTPA jointly with worker and
employer’s representatives to promote a standardized factory safety inspection program with
the support of ILO (Wiersma, 2018). The Bangladesh Labor Act of 2006 was subsequently
amended to simplify the bureaucratic red tape associated with union formation, and to
introduce a health and safety committee presence at the factory level (Bangladesh Labour
Amendment Act, 2013). The Bangladesh government also established a minimum wage board
and raised the minimum wage to $68 per month (Khan & Wichterich, 2015). A positive outcome
is that both the Accord and the Alliance promoted significant efforts to improve worker safety,
including fire, electrical, structural safety, worker safety training, etc. The Accord established a
system of audits and audited 1,621 factories covering 2.54 million workers in Bangladesh with
an $11 million annual budget. They recently reported 84% remediation of factory safety issues
identified in the initial audits, consisting of corrections to 97,000 safety issues in Bangladeshi
11 remediation of the safety issues covering more than 1.3 million workers in Bangladesh in 785
factories (Alliances Annual Report 2017). The Accord has been especially praised by labor
advocates for its legally binding framework, in so much as the sourcing brand is legally
responsible to address much of the remediation expenditures for their respective factories
(Anner, 2013).
Despite the massive remediation efforts and investment on the part of the government
and industry, post Rana Plaza regulatory reforms and industry initiatives have been strongly
criticized by academics (Alamgir & Banerjee, 2018; Baumann-Pauly et. al., 2018; Labowitz &
Baumann-Pauly, 2014). Critics argue that the regulatory reforms and industry initiatives have in
fact achieved little to no progress in terms of improving prevailing wages, greater union rights
and access, and their failure to limit excessive overtime and unauthorized subcontracting
(Anner, 2018; Alamgir & Banerjee 2018; Anner, 2017; Baumann-Pauly et. al. 2015). In addition,
the Bangladesh government established the minimum wage paid to workers at a level that is
much lower than the WRC (2013) estimates (at 14% of living wage levels). While the number of
unions registered with the government grew immediately after Rana Plaza, the growth has not
been maintained due to the high number of registration rejections by the Bangladesh
government (Anner, 2018). There are still significant shortcomings in the country’s labor laws;
particularly when it comes to health and safety issues, worker rights in export processing zones
and subcontracting practices in factories. (Alamgir & Banerjee, 2018; Baumann-Pauly et. al.,
2015). (The latter practice refers to the subcontracting of orders by factories to unsafe and
unregistered “jobbers” without prior authority by the brand, (Wieland & Handfield, 2015)). To
12 subcontractors from their safety remediation requirements, and these entities are well-known
for their lack of compliance to worker safety standards (Alamgir & Banerjee, 2018; Wiersma,
2018; Baumann-Pauly et. al., 2015). Rana Plaza consisted largely of small unauthorized
subcontracting “job shops” that were producing apparel for the larger factories as overflow
capacity production. This points to the importance of controlling the tier 2 suppliers and
subcontracting dynamics that exist in Bangladesh if worker safety is truly going to be addressed
(Baumann-Pauly et.al., 2015).
Another reason for the significant delays in deploying the Accord and Alliance
remediation is the failure to address an important question: Who will pay for the remediation
cost? (Russell, 2016; Scheper, 2017). Though the legally binding nature of the Accord stipulated
that members were somewhat responsible for the remediation financing, follow-up studies
show that the Accord and Alliances adopted a position of very limited financial responsibility for
the remediation financing, ultimately passing on the financial burden to factory owners
(Alamgir & Banerjee, 2018; Anner, 2018; Bain 2017; Scheper, 2017). Many factory owners are
either unwilling or unable to carry the high remediation cost which generally range from
$100,000 to $250,000, but in extreme cases were as much as $1.5 million (ILO, 2016; Alamgir &
Banerjee, 2018). This was complicated by the shoddy regulation of financial lending by banks in
Bangladesh and the high interest and capital costs of lending for factory owners (ILO, 2016). In
effect, the required Alliance remediation costs not only increased production costs and reduced
factory profits (Alamgir & Banerjee, 2018; Anner 2018). To make the situation even worse,
recent research shows that since the Rana Plaza event, prices paid by brands to supplier
13 declining real wages and an increase in worker rights’ violations since 2011. Real wages have
dropped by 6.47% following the initial wage increase of December 2013, and violations of
workers’ rights to form unions, bargain, and strike have increased by 11.96% between 2012 and
2015 (Anner, 2018).
Research suggests that the failure to address the root cause of core labor rights
violations explains the limited success of the post Rana Plaza regulatory reforms in Bangladesh
(Anner, 2018; Alamgir & Banerjee, 2018; Scheper, 2017; Baumann-Pauly et.al., 2015). Anner
(2013) argues that the brands’ sourcing practices involving extreme price pressure and demand
for reduced lead times in the negotiation process have pushed factories to cut corners. Major
brands continued pressure on lower pricing and threats to go elsewhere have acted as the
primary driver for factory owner inability to address violations at the factory level and have left
most of Accords’ good intentions unmet (Anner, 2018; Baumann-Pauly et.al., 2015). Empirical
evidence shows that U.S. apparel import costs dropped during the 1990 to 2010 period, as did
the labor rights indicators of these same exporting countries during this period. A recent survey
of Bangladeshi apparel factories showed that post-Rana Plaza, prices dropped a further 13
percent and lead times shrunk by another 8.14 percent beyond the 2010 levels (Anner, 2018).
This type of continued cost pressure is clearly unsustainable and detrimental to investment in
safer factories. The incessant downward pressure on price and lead time, combined with the
additional financial burden of remediation investment at above average costs of capital is
leading to the perfect storm, and another Rana Plaza may likely be on the horizon.
The situation will certainly not promote an environment for improvement of worker
14 working conditions are indeed largely a function of the cost pressure created by the large
apparel brands but what do we mean by a fair price? This leads us to our Research Question 2,
where we suggest that an improved definition of what constitutes a “fair” cost within apparel
factories can inform PPGR standards in order to promote improved working conditions and
worker pay in this industry. This question remains unanswered and our current review of the
scholarly literature in the global policy research. This in turn led us to explore how supply chain
managers would address this question.
1.3.2 Total Cost of Ownership
Understanding the components of total factory production costs is a topic that is well
documented in supply chain research. Total cost of ownership (TCO) frameworks have their
origin in Williamson’s work on transaction cost economics (TCE) theory. TCE is one of the
singular most popular theories used to ground SCM research (Defee et al., 2010), even as
scholars have argued its usefulness (e.g., Williamson, 2008; Zipkin, 2012). Many phenomena in
SCM research can be formulated as contracting problems (Cachon, 2003) and in this context
TCE’s ability to explain behaviors with a high degree of abstraction is a powerful and useful
theoretical foundation upon which to build empirical models. Although SCM portrays clusters of
related transactions as supply chains organized to satisfy a demand, there is a need to shift TCE
theory “from a focus on bilateral transactions, to examining transactions within a supply chain
context” (Wever et al., 2012). The application of TCO therefore seeks to capture multiple
transactions across a supply chain, and in so doing extends TCE to a more granular level that
15 In practice, TCO models have been applied for make-or buy decisions leading to an outsourcing
decision but are also useful in post-transaction analysis to continuously improve outsourced
production and services (Ellram, 1995). Consistent with the logic of transaction cost theory, TCO
provides a strategic approach to costing that segments and clusters cost elements in
transaction rich environments. Ellram (1994) defines TCO as, “an innovative philosophy aimed
at developing an understanding of the ‘true’ cost of doing business with a particular supplier for
a particular good or service” (p.171). Other definitions characterize TCO as an extension of
activity-based costing (ABC) (Wouters et al., 2005) and Life Cycle Costing (LCC), although such
applications span a long-term timeframe (Saccani et. al., 2017). In practice, TCO models are
either value-based or dollar-based (Ellram, 1995). The value-based approach is deductive, such
that each cost element is calculated as a percentage of the total product cost. In contrast, the
dollar-based approach assigns an actual calculated cost to every element and sums these
elements to produce a total cost.
Empirical applications of TCO have been applied in a number of non-apparel industries
including automotive (Van Vliet et. al., 2011; Gilmore et. al., 2013; Rusich et. al., 2015;
Nilprapunt et. al., 2016), information technology (Koomey et al., 2007; Patterson et al., 2007;
Walterbusch et al., 2013), and heavy equipment purchases spanning several industries
(Hensley. et. al., 2012; Prabhakar & Sandborn 2012). For the most part, this stream of research
uses TCO to inform supplier selection decisions.
Research suggests that the primary benefits associated with TCO are its flexibility and
data driven methodology. Ellram and Sefird (1998) emphasize the flexibility of TCO applications
16 67). Alard et al. (2009) suggest that TCO creates a sound basis for evidence-based negotiations
in supply chains that can lead to more collaborative and effective outcomes. Noted limitations
of TCO applications arise from the intense nature of data collection requirements required to
populate TCO models. Ellram (1995) acknowledges that difficulties arise in sharing proprietary
cost data between buyers and sellers. Researchers also suggest that complex specification and
measurement of costs can impede applications of TCO models (Ellram, 1993; Ellram &
Feitzinger, 1997; Wouters et al., 2005; Song et. al. 2007). Challenges related to quantifying
non-monetary relevant costs of performance are also noted (e.g., supplier performance costs, social
policy costs) (Bhutta & Huq, 2002). Finally, high levels of trust between supply chain partners
are emphasized as a core enabler for sharing proprietary data leading to development of robust
models (Ellram, 1995; Ellram & Siferd, 1998; Zachariassen & Stentoft Arlbjørn 2011). This
requirement is particularly challenging when such buyers and sellers are from different cultures
and backgrounds, and trust is not as likely to be present (Wieland and Handfield, 2013).
1.3.3 Total Cost of Ownership in Apparel Industries
Although a number of TCO applications are exemplified across a number of different
industrial contexts, (Ellram & Siferd 1998; Ferrin & Plank, 2002; Zachariassen & Stentoft
Arlbjørn 2011), there are almost no examples of TCO model applications in the apparel sector
mentioning robust methodology and details data source. Apparel cost models can be found in
the work of Miller & Hohenegger, 2016; Miller, 2009, 2013; Miller & Williams, 2009;) and
among non-academic entities such as the Fair Wear Foundation, Oxfam International, and the
17 comparisons at the factory level for material, labor, overhead, and profit that is required to
produce a robust TCO analysis.
Miller & Hohenegger (2016) outlines the methodology for labor pricing in apparel cost
models using formulas, and compares product costs for three countries (Bangladesh, China, and
Cambodia). But this study does not provide details about total product costing and data
sources, hence it is not clear if the calculations are based on data provided by any apparel
factories or estimates only. Other research by Miller (2013, 2009) explains the labor pricing
methods while calculating apparel product costs using industrial engineering principles. The
author shares several apparel product cost breakdowns with limited explanations of data
sources. Although the topic of “living wages” in global apparel industries is mentioned in the
work of Miller & Williams (2009), their example of a fair-trade cotton t-shirt retail price
breakdown includes fabric, trimmings, tags, factory profit, FOB (Freight on Board)1, and LDP
(Landing duty paid price) without comprehensive explanations about how they are calculated.
The authors briefly note that their data are “sourced from industry” without any further details
on the source of the data or the data collection procedures. Another example is a cost
breakdown of a men’s knit shirt from the Philippines discussed in a study by Merk (2003) which
also fails to provide any comprehensive data sources.
1In their paper, Miller and Williams define FOB price as the price that includes materials (fabric, accessories) and
18 Fair Wear Foundation (2014) developed a cost model for apparel production based on a
data from a single Macedonian factory. The study identified several cost elements up to
ex-factory cost (FOB) and demonstrated the methodology to calculate those elements. These
studies lack several factors required to establish a valid TCO model, including a comprehensive
data set, specific details on data collection methodologies, and inclusion of total supply chain
cost factors. Other recent studies by BCG (2017) and an Oxfam report (2017) show cost figures
for apparel produced in a global supply chain but fail to provide a robust description of the
methodology for calculations, formulas, and data sources. These studies point to the fact that
collecting such models is not only difficult, but that the data required to do so is extremely
difficult to collect and collate in a structured fashion.
Despite the challenges of data collection, we propose in our Research Question 3 that if
the elements of total cost in low-cost apparel factories can be modelled, then the true cost of
sustainable and fair apparel production in low-cost countries can be used as an input into PPGR
negotiations. Moreover, the call for increased transparency into low-cost country apparel
factories is a hollow one, unless the true cost elements of doing so can be brought to the table.
Documenting the TCO of fair sustainable apparel production is at the foundation for creating a
policy debate to clarify who will cover the costs of building “truly sustainable supply chains”
(Montabon et al., 2016; Pagell and Shevchenko, 2014). An explicit TCO of low-cost country
apparel supply chains is an important first step in the move towards broad statements such as
that expressed by Pagell and Shevchenko (2014, p. 45), that “a supply chain’s social and
environmental performance as equally or more valid than economic performance”. While such
19 including the true costs that exist in factories that produce low-cost apparel for large global
brands (Montabon et al., 2016).
1.3.4 Integrating Total Cost of Ownership into the PPGR Dialogue in Bangladesh
To the best or our knowledge, we were unable to find any research that sought to link
TCO models as a means of influencing and shaping public policy and government regulations
(PPGR) of low-cost apparel factories. Some transportation models employ TCO methods to
influence other sustainability criteria and policy impacts however (Palmer et. al., 2018; Levay et.
al., 2017; Hagman 2016). For instance, Palmer et. al. (2018) measured the TCO for electric and
hybrid vehicles in different countries and compared them. Their results suggest that the TCO
approach could be employed to inform policymakers in high traffic environments, particularly
on regulating freight fleets to reduce carbon emissions and improve air quality. Levay et al.
(2017) also conducted a TCO study on electrical vehicles in different European countries and
derived some policy implications that may help to reduce prices and increase sales for
alternative vehicle segments.
Our study is unique, in that it is the first that seeks to derive policy implications for
regulating work environments in Bangladesh based on empirically derived cost models. These
models are derived from data collected directly from Bangladeshi contract manufacturers who
are supplying apparel to leading global apparel brands. The data collection process was lengthy
and time-consuming, and required in-depth interviews and data exchange, enabled by years of
trusted relationships between one of the authors and the factories in Bangladesh. The author
in question worked as a factory in auditor in Bangladesh for several years and was able to
20 former working relationship. The data collection process required more than a year of in-depth
meetings between the factory owners and the author and required considerable assurances of
confidentiality. Normally, factory comptrollers who share such data would surely be fired, and
their business would likely lose a significant volume of customers. This lengthy data collection
process yielded a unique, robust, and extremely confidential data set that has been employed
to construct a comprehensive TCO model, covering the total supply chain cost of apparel
manufacturing in Bangladesh.
In the remainder of the study, we begin by describing the detailed step-by-step
methodology used to construct the elements of an apparel factory TCO model, providing
additional details on the cost calculations and nomenclature employed. Next, we describe the
sampling procedure for the nine different Bangladeshi factories in our sample and report the
factory cost analytics in the Results section that follows. Finally, we develop the implications of
our TCO analysis to address the final research question 4, which is to explore whether the TCO
methodology can be employed to better inform better public policy and government
regulations (PPGR) that will create a more sustainable global apparel supply chain.
1.4
METHODOLOGY
The methodology for building the TCO model exploits both primary and secondary data
in developing a model that is useful in addressing PPGR for sustainable supply. Details of the
data collection process among Bangladeshi factories are provided in the sample description,
followed by data collection procedures. (In the discussion section, we also discuss the lessons
21 recommendations were to be adopted). Procedures for TCO model construction and
integration are also described in the section that follows.
1.4.1 Sample
The sample for the study consists of active Bangladeshi apparel factories that supply
market-leading multinational apparel and retail brands. Bangladesh is an appropriate sampling
frame for the study given its global prominence in low-cost apparel production. From June
2016 to June 2017 Bangladesh exported $28 billion in apparel, making the country the second
largest apparel exporter after China (WTO, 2017). In 2017, apparel accounted for more than 81
percent of Bangladeshi exports. The apparel industry employs approximately four million
workers, among which 80 percent are women (BGMEA, 2017). Despite positive economic
impacts, the Bangladeshi apparel industry is criticized for negative impacts such as labor rights
violations, following the Rana Plaza collapse which is attributed to downward price pressure in
the industry (Anner, 2013; Guardian, 2014; Wieland & Handfield, 2014). By creating visibility
into the true operating costs that exist within Bangladeshi factories, a more robust context for
discussing sustainable policies for garment production in the global mass market for apparel is
supported.
Due the developing Bangladeshi economy, reliable industry statistics for evaluating the
country’s apparel industry structure do not exist. Several public and private organizations track
the number of Bangladeshi apparel factories. For example, in 2017 the Bangladesh Garments
Manufacturers and Exporters Association (BGMEA) reported 4,482 active non-knitwear
22 Association (BKMEA) reported 2,030 knit garment factories in operation. The Center for Policy
Dialogue (CPD) in Bangladesh recently reported 3,856 active apparel factories. However, the
organization cautioned that these data, compiled from secondary sources, were in need of
refinement. This lack of reliable industry intelligence is highlighted in the recent conflicting
accounts over the number of factories operating in Bangladesh (Anner et al., 2016; Labowitz &
Baumann-Pauly., 2015). From a sampling perspective, a structural understanding of the
industry is difficult to specify.
To generate a sample pool for the research, potential factories were identified and
contacted through a major European apparel retailer. The retailer provided multiple personnel
with factory contacts to assist in the recruiting effort. This firm is a global retailer, with more
than one thousand stores worldwide.
An initial group of 50 factories were contacted and agreed to participate in the study, on
the condition that researchers provided a non-disclosure agreement for their data. At this
point, each factory was screened to ensure the availability of a minimum of one year of detailed
factory operating expenses for the most recent calendar year (June 2016-2017). To select
specific participants for the research, several criteria were applied to the 50 factories. Cotton
t-shirts were selected as the focal product for building the TCO based on their production
requirements and output. In this manner, each factory included in the sample was requested to
identify cotton t-shirts that were produced using a similar process. The researchers worked
with the retail suppliers to identify factories that produced comparable t-shirts for a single,
global brand. Nine factories were identified that met the inclusion criteria. Though analysis of
23 reports (CPD RMG Study 2017) the nine factories ranked among the top fifty percent in the
country based on the total number of workers. Additionally, as suppliers for top global brands,
the nine factories likely represent relatively large firms among the Bangladeshi industry. For the
analysis, the factories are distinguished by total number of workers into three ordinal
categories: small, medium, and large (Table 1). To protect factories’ privacy, each respondent is
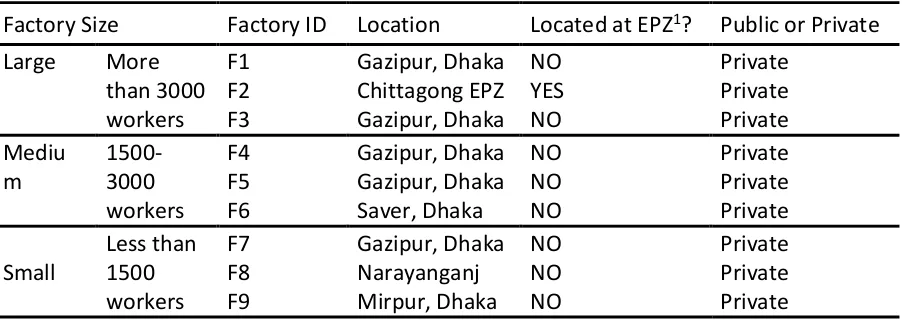
24 Table 1. 1: Final Factory Sample (N=9)
Factory Size Factory ID Location Located at EPZ1? Public or Private
Large More than 3000 workers
F1 Gazipur, Dhaka NO Private
F2 Chittagong EPZ YES Private
F3 Gazipur, Dhaka NO Private
Mediu
m 1500-3000 workers
F4 Gazipur, Dhaka NO Private
F5 Gazipur, Dhaka NO Private
F6 Saver, Dhaka NO Private
Small Less than 1500 workers
F7 Gazipur, Dhaka NO Private
F8 Narayanganj NO Private
F9 Mirpur, Dhaka NO Private
1 Export Processing Zone
1.4.2 Sample Product
A basic 100 percent cotton t-shirt was designated as the unit of analysis to build the TCO
(HS code: 61091000). The rationale for using a t-shirt to build the TCO was primarily due to the
wide distribution of t-shirts in global markets as well as the straightforward production
requirements. As stated in the sampling procedure, the availability of comprehensive costing
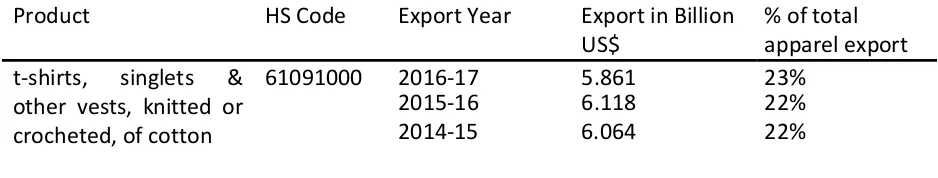
data for t-shirts among the nine factories also supports this decision. Over the past three years,
cotton t-shirt exports accounted for a significant proportion (22.0%) of Bangladeshi apparel
industry output (Table 2). Technical specifications for the t-shirt used to generate the TCO are
25 Table 1. 2: Product Selection for TCO
Product HS Code Export Year Export in Billion
US$ % of total apparel export t-shirts, singlets &
other vests, knitted or crocheted, of cotton
61091000 2016-17 5.861 23%
2015-16 6.118 22%
2014-15 6.064 22%
1.4.3 Data Collection
Data for the study were captured between June 2016 and June 2017. Each factory
provided cost breakdown data (CBD) for their t-shirt production for the period beginning
January 2017 and ending June 2017 (Appendix B). The production cost data are valid under the
certain business terms among brand and the factories. The CBD data reflect costs associated
with materials and production within each factory. Note that costs associated with materials
(fabric and accessories) are generated outside of the factory by external mills appointed by the
brand. As a result, the values associated with accessories is constant across suppliers (N=9).
While the fabric cost per kg (kilogram) is constant across suppliers (N=9), it varies at the factory
level based on the amount of fabric required to produce a single t-shirt in each factory. The cost
of making a t-shirt at the factory level is a function of standard allowed minutes (SAM), factory
production efficiency percentage, and factory price per minute (PPM). Each of these elements
required supplemental data for calculation from the factories. Data for these calculations were
provided by the factories except for SAM which required data from the Generalized Sewing
Database (GSD2) for quantification. To quantify SAM, factory production efficiency percentage,
26 and factory price per minute, a series of calculations were required (shown in Appendix C).
Following identification and calculation of the cost elements, the data were reviewed and
cross-checked with purchasing and technical personnel from the partner brand to ensure accuracy.
Additionally, logistic costs associated with the t-shirt were collected from suppliers and
the brand. Each brand’s local office costs associated with the t-shirt purchase were also
collected from the brand purchasing team. Table 3 shows the list of formulas used to calculate
27 Table 1. 3: Formulas for TCO Calculations
TCO Elements Formula for Calculation
Materials cost
Yarn cost per t-shirt yarn cost per kg * consumption per t-shirt in kg
Knitting cost per t-shirt knitting cost per kg fabric * consumption per t-shirt in kg Dyeing cost per t-shirt dyeing cost per kg fabric * consumption per t-shirt in kg Finishing cost per t-shirt finishing cost per kg fabric * consumption per t-shirt in kg Process wastage cost per
t-shirt wastage cost per kg fabric * consumption per t-shirt in kg Fabric cost per t-shirt (yarn + knitting + dyeing + finishing + wastage) cost per
t-shirt
Accessories cost per t-shirt (accessories + trimmings + packaging) cost per t-shirt Cut & Sew cost
Cost of making* (SAM * factory price per minute)/ factory production efficiency percent
Logistic cost
Logistic cost per t-shirt (local transportation + customs duty & documentations + international shipping + Import duty) cost per pc of t-shirt
Buyer in country administrative cost
Local office cost per t-shirt t-shirt FOB3 in USD * 5.0%
*NOTE: Cost of making requires additional calculations. SAM = Provided directly by GSD through factories & brand
Factory production efficiency (%) = (SAM of the t-shirt from GSD/ time estimated to produce the t-shirt in factory) %
Factory price per minute = total annuals price of the factory/total annual working minutes Total annuals price of the factory = total annuals cost of the factory + factory profit Total annuals cost of the factory = total direct labor cost + overhead cost
Direct labor cost = worker wage + overtime + any other allowance
Overhead cost = indirect labor cost + other production & non-production overhead
1.4.4 Analysis
Following the guidelines of Ellram (1995), a dollar-based approach was used in
constructing the TCO model for t-shirts. The TCO calculations were designed to capture the cost
28 paid by the brand to their suppliers for a finished t-shirt (per piece in FOB USD) and then
extended to logistics and brand local office costs to derive the total supply chain cost. Apart
from material costs, any other costs associated with upstream or downstream supply chain
activities beyond logistic and local office costs were not included in the scope of the model.
The cost elements were integrated into a single model and subsequently compared to the
relevant costing study in the global apparel context (Fair Wear Foundation 2014) to examine
structure. The fabric cost per t-shirt, cost of making per t-shirt, logistics cost, and brand local
office cost all require multiple inputs to produce a final calculation, and these have all been
integrated in the TCO analysis. The accessories cost presented in the model is constant and
does not vary.
After initial completion of the TCO results, the output was presented in a spreadsheet
format with clear access to formulas and submitted (individually) for review to the nine
participating factories and the brand. Several iterations between researchers and factory
personnel (N=9) and the brand were undertaken to edit initial TCO cost calculations particularly
such parameters as price per minute and production efficiency. The final TCO was integrated by
combining the material costs, cut and sew costs, logistics costs, and the local office cost.
1.5
RESULTS
The data were combined and integrated to develop the TCO analytical estimates with
material, cut and sew, logistics and local office costs delineated. The cut and sew costs which
29 extensive calculation and validation among the participating factories (as explained in the
Methodology). The comprehensive dollar based TCO values for cotton t-shirt production among
30
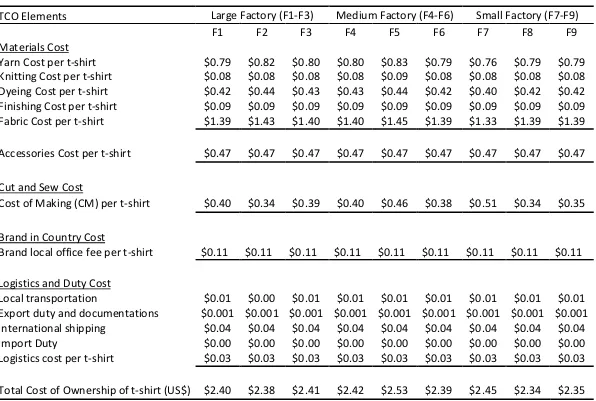
Table 1. 4: Total Cost of Ownership for t-Shirt Production among Bangladeshi Sample (N=9)
TCO Elements Large Factory (F1-F3) Medium Factory (F4-F6) Small Factory (F7-F9)
F1 F2 F3 F4 F5 F6 F7 F8 F9
Materials Cost
Yarn Cost per t-shirt $0.79 $0.82 $0.80 $0.80 $0.83 $0.79 $0.76 $0.79 $0.79
Knitting Cost per t-shirt $0.08 $0.08 $0.08 $0.08 $0.09 $0.08 $0.08 $0.08 $0.08
Dyeing Cost per t-shirt $0.42 $0.44 $0.43 $0.43 $0.44 $0.42 $0.40 $0.42 $0.42
Finishing Cost per t-shirt $0.09 $0.09 $0.09 $0.09 $0.09 $0.09 $0.09 $0.09 $0.09
Fabric Cost per t-shirt $1.39 $1.43 $1.40 $1.40 $1.45 $1.39 $1.33 $1.39 $1.39
Accessories Cost per t-shirt $0.47 $0.47 $0.47 $0.47 $0.47 $0.47 $0.47 $0.47 $0.47
Cut and Sew Cost
Cost of Making (CM) per t-shirt $0.40 $0.34 $0.39 $0.40 $0.46 $0.38 $0.51 $0.34 $0.35
Brand in Country Cost
Brand local office fee per t-shirt $0.11 $0.11 $0.11 $0.11 $0.11 $0.11 $0.11 $0.11 $0.11
Logistics and Duty Cost
Local transportation $0.01 $0.00 $0.01 $0.01 $0.01 $0.01 $0.01 $0.01 $0.01
Export duty and documentations $0.001 $0.001 $0.001 $0.001 $0.001 $0.001 $0.001 $0.001 $0.001
International shipping $0.04 $0.04 $0.04 $0.04 $0.04 $0.04 $0.04 $0.04 $0.04
Import Duty $0.00 $0.00 $0.00 $0.00 $0.00 $0.00 $0.00 $0.00 $0.00
Logistics cost per t-shirt $0.03 $0.03 $0.03 $0.03 $0.03 $0.03 $0.03 $0.03 $0.03
31 The TCO model results show that an average total cost per unit is $2.41 (range: $2.38 -
$2.53 per unit). In terms of factory size, a stable pattern of production costs related to total
number of workers was not apparent from the data. The average TCO for large factories (more
than 3,000 workers) was $2.38, medium factories (1,500-3,000 workers) $2.42, and small
factories (less than 1,500 workers) $2.36 (Figure 1). We noted that the standard cost appeared
to be more consistent among large factories relative to medium and small factories.
Figure 1. 1: TCO for Sample Factories (N=9)
Material costs including fabric and accessories accounted for 77 percent (on average) of
the total t-shirt cost while cut and sew costs, brand in-country costs and logistics costs
accounted for a significantly smaller proportion of the TCO. Though the fabric cost (yarn,
knitting, dying, finishing) per kilogram was constant across the sample factories (N=9), this cost
varies based on unique consumption factors associated with each factory (Table 4). The average
fabric cost per factory was $1.39 (range: $1.33-$1.45). The sample factories do not exhibit a
consistent pattern of fabric consumption based on factory size. However, the smaller factories $2.40 $2.38 $2.41 $2.42$2.53 $2.39 $2.45 $2.34 $2.35
$0.00 $0.20 $0.40 $0.60 $0.80 $1.00 $1.20 $1.40 $1.60 $1.80 $2.00 $2.20 $2.40 $2.60 $2.80 F1 F2 F3 F4 F5 F6 F7 F8 F9 USD$
Fabric Accessories Cost of Making Brand local office fee Logistic & Duty
32 in the sample appeared to have lower consumption costs compared to the larger factories.
Note that the accessories cost was constant across the factories ($0.47).
Table 1. 5: Factory Operation Data
F1 F2 F3 F4 F5 F6 F7 F8 F9
Factory Efficiency (%)* 77 79 83 87 64 64 62 73 72
Factory Price Per
Minute (USD$) * 0.040 0.035 0.042 0.045 0.038 0.032 0.041 0.032 0.033
Fabric Consumption to
make a t-shirt (gm) 230 237 233 233 240 230 220 230 230 *Calculations for Factory Efficiency and Factory Price Per Minute are presented in Appendix C
An incredible statistic was that the Cost of Making (CM) was on average only 16 percent
of t-shirt production TCO. The average CM per t-shirt was approximately $0.40 (range:
$0.34-$0.51). The CM calculation relies on three inputs: SAM data, factory efficiency, and price per
minute. The SAM measure is constant while the latter two measures vary by factory. The
average factory efficiency among the sample is 73 percent (range 62%-87%), while the average
factory price per minute (PPM) is $0.038 (range: $0.032-$0.045) (Table 5).
The additional TCO costs originating from the brand’s in-country expenditures account
for 4.7 percent of the total. Logistics costs including local transportation, import and export
duties, documentations, and international shipping represented only 1.4 percent of the TCO.
The sample data was for import destinations exclusively within the European Union, with which
33 Figure 1. 2: Average t-shirt TCO
The cost of making (CM) element includes numerous inputs related to overall factory
operations (e.g., wages, salaries, overhead) as well factory profit. Note that CM does not
constitute, but rather contributes, to total factory profit for the t-shirt. Based on the TCO, the
CM contributes 20 percent to factory profit on a t-shirt ($.08). Further discussion of this result
with the participants revealed that factories tend to derive hidden profits from material costs
and consumption. Therefore, the actual profit per t-shirt is higher, potentially ranging from 20
to 30 cents, based on estimates given by the respondents. The adjusted CM estimates agree
with past research on t-shirt costing in Macedonia that suggests factory profit margins ranging
from 10-15 percent of the FOB (Fair Wear Foundation, 2014).
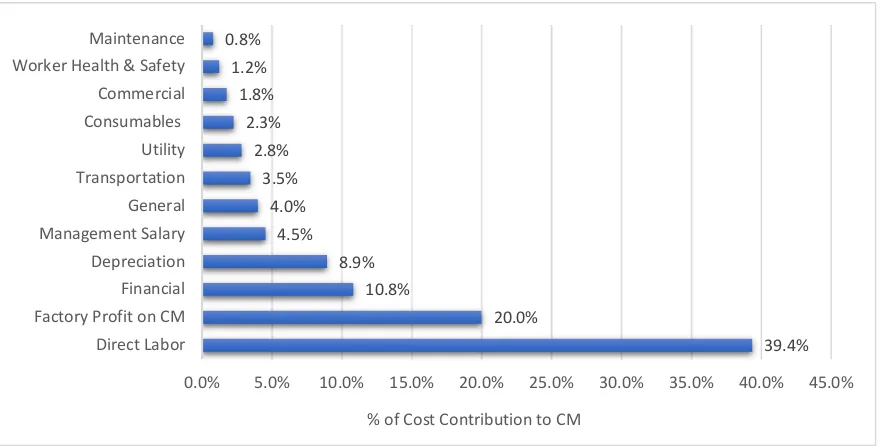
The top four contributors to CM account for approximately 79 percent: labor (39.4%),
profit (20.0%), finance (10.8%), depreciation (8.9%). The elements that constitute the remaining
proportion of CM include: management salary (4.5%), general expenses (4%), transport (3.5%),
utility (2.8%), consumables (2.3%), commercial (1.8%), worker health and safety (1.2%), and $0.80
$2.41
$0.08
$0.43 $0.09
$0.47
$0.40 $0.11 $0.03
$0.00 $0.50 $1.00 $1.50 $2.00 $2.50 $3.00
Yarn Knitting Dyeing Finishing Accessories Cost of
Making BrandLocal Office Fee Logistic & Duty TCO TC O U S$ Material Costs 33.2%
3.3% 17.8%
3.7% 19.5%
16.6%
34 maintenance (0.8%). In terms of average monetary contribution to the TCO, the data indicate
that only 6.5 percent of total cost is attributed to labor (approximately $0.16 per $2.41 t-shirt).
Further only 1.2 percent of CM cost applies to worker health and safety (e.g., medical expense,
safety equipment).
In the following section, we discuss the implications of the TCO model outputs for public
policy and government regulation.
Figure 1. 3: Disaggregated Average Cost of Making (CM) for Sample Factories (N=9) Note: CM accounts for 16 percent of the TCO
1.6
DISCUSSION
Factory fabric consumption cost for t-shirt production was found to vary significantly
among the factories in our sample. A factory’s fabric consumption depends upon its technical
capabilities including effective use of skilled labor and machinery. The consumption findings as
they relate to company size are contrary to prior thinking that larger companies are more 39.4% 20.0% 10.8% 8.9% 4.5% 4.0% 3.5% 2.8% 2.3% 1.8% 1.2% 0.8%
0.0% 5.0% 10.0% 15.0% 20.0% 25.0% 30.0% 35.0% 40.0% 45.0% Direct Labor
Factory Profit on CM Financial Depreciation Management Salary General Transportation Utility Consumables Commercial Worker Health & Safety Maintenance
35 efficient. In fact, the smaller companies in the sample had lower consumption costs compared
to their larger counterparts. The consumption measures may have been influenced by a factory
practice whereby profits are hidden in fabric consumption costs.
Factory efficiency is also a function of technical capability (Appendix C). Factory
efficiency does not suggest a consistent pattern related to factory size (Table 5). According to
Te Velde (2014) the average garment factory efficiency in Bangladesh (45%) is comparatively
lower than those reported for the sample (62%-87%) indicated higher efficiencies across the
board for the participant factories. Factories within the sample differed in terms of their t-shirt
production experience. Based on the data, factories with longer histories of t-shirt production
tend to enjoy higher efficiencies regardless of size (e.g., F4 has been producing this t-shirt for
four consecutive years).
Factory price per minute (PPM) is the ratio of total factory operation cost to total active
minutes of operation over a year in this study. Therefore, PPM largely depends on total factory
operating efficiency and cost structure. Among the sample, smaller factories suggest relatively
lower PPM values compared to medium and larger factories (Table 5). Higher PPM costs among
the larger factories are logically driven by higher management salaries, higher wages (labor
costs), and higher maintenance costs typical to scale.
The CM element accounts for a mere 16 percent of the TCO. Disaggregation of the CM
element reveals additional insight into the current dynamics of low-cost global apparel supply
chains (Figure 3). For instance, the average cost of labor and worker health & safety contributes
only 6.7 percent ($0.16 /$2.41) to the TCO. This small contribution of cost to worker wages and