ABSTRACT
FEI, XIUZHU. Towards Closed Loop Recycling of Polyester Fabric. (Under the direction of Dr. Harold S. Freeman and Dr. David Hinks).
Polyethylene terephthalate (PET) is extensively used in various types of apparel, home textiles, and outdoor products that are regularly placed in landfills after use. But unlike natural fibers, PET is not readily biodegradable. In view of sustainability, research regarding the recycling of textiles derived from PET fibers is of interest, and effective color removal has been recognized as a crucial step towards recycling of colored PET fabrics. To this end, a decolorization process was developed using sodium formaldehyde sulfoxylate (SFS) as the reducing agent. Disperse dye decolorization studies were conducted in water and acetone media, and an optimized combination of treatment time (30 min), water to acetone ratio (1:2), SFS concentration (10g/L), temperature (100oC), and liquor ratio (1:50) was found effective for decolorizing various commercial disperse dyes as well as basic dyes. Results in terms of intrinsic viscosity of decolorized PET showed that the optimized SFS decolorization method has no significant effect on fiber strength.
The goal of this work was to study the recyclability of bath and fabric after decolorization, investigate the ecotoxicity of the decolorization process, study the life cycle assessment of the closed-loop recycling process, characterize dyes from commercial fabrics and study their decolorization properties.
Disperse Yellow 42 and Disperse Red 60, respectively, have better decolorization efficiency than those containing azo Disperse Orange 30 and Disperse Blue 79 dyed fabrics.
Bearing in mind that ecotoxicity testing is of increasing importance in the screening of newly developed substances or treatment processes, solutions of six high volume disperse dyes and one basic dye were decolorized using SFS, and the resultant solutions were tested with
Daphnia similis and Parhyale hawaiensis to observe the acute toxicity to the two species. The control sample, which is the SFS solution without dyes, showed that EC50 to Daphnia similis
is 1.83%, and LC50 to Parhyale hawaiensis is 9.0%. EC50 and LC50 were expressed in percentage of dye solution. Decolorized dye solutions differed in the toxicity, however, the differences were not significant. The toxicity observed in the acute tests is probably mainly related to SFS decolorization medium. Converting EC50 and LC50 of decolorized solution to equivalent concentration, the effluents were considered relatively harmful to Daphnia similis. Control SFS solution and decolorized Disperse Blue 56 were moderately toxic to Parhyale hawaiensis, whereas decolorized Disperse Orange 30 was relatively nontoxic to Parhyale hawaiensis.
© Copyright 2018 by Xiuzhu Fei
by Xiuzhu Fei
A dissertation submitted to the Graduate Faculty of North Carolina State University
in partial fulfillment of the requirements for the degree of
Doctor of Philosophy
Fiber and Polymer Science
Raleigh, North Carolina 2018
APPROVED BY:
_______________________________ _______________________________ Dr. David Hinks Dr. Harold S Freeman
Co-chair of Advisory Committee Co-chair of Advisory Committee
DEDICATION
I dedicate my dissertation work to Dr. Harold S. Freeman and Dr. David Hinks for their guidance and support over the years.
BIOGRAPHY
ACKNOWLEDGMENTS
Writing this note of thanks is the finishing touch on my dissertation. It has been several years of learning in North Carolina State University, Raleigh, not only in the scientific area, but also on a personal level. I would like to express my sincere acknowledgements to the people who have supported and helped me so much throughout this period.
I would first like to thank Dr. David Hinks for founding me throughout my research career. I have never imaged I could study abroad before I received an offer letter from Dr. Hinks 5 years ago. I am deeply grateful for the opportunity. He covered me all the time so I could focus on the research. Without his support, this PhD work would not have been achievable.
My greatest appreciation goes to Dr. Harold S. Freeman for all the guidance, instruction and encouragement he gave me during the time I spent at the NC State. He is a very patient and responsible professor. I will always keep every piece of hand-written feedback he gave to me about my thesis and manuscripts. He pointed me to the right direction so that I can successfully complete my dissertation. He is also a considerate person which inspires me a lot in my personality.
I would also like to thanks Dr. Nelson Vinueza and Dr. Joseph DeCarolis for their excellent cooperation as kindly being my committee members. I sincerely appreciate the helpful suggestions and comments I received from them.
TABLE OF CONTENTS
LIST OF TABLES ... x
LIST OF FIGURES ...xii
1. INTRODUCTION ... 1
2. LITERATURE REVIEW ... 3
2.1 Polyethylene terephthalate ... 3
2.1.1 Introduction to polyethylene terephthalate ... 3
2.1.2 Properties of polyesters ... 5
2.2 Coloration of polyester ... 7
2.2.1 Disperse dyes ... 8
2.2.2 Basic dyes ... 14
2.3 Dye characterization ... 16
2.3.1 Ultraviolet-visible spectroscopy ... 16
2.3.2 Chromatography ... 17
2.3.3 Mass spectrometry ... 18
2.4 Toxicity ... 19
2.7.1 Dye structure property relationships ... 20
2.4.2 Methods used ... 25
2.5 Decolorization treatment ... 29
2.5.1 Wastewater decolorization treatment ... 29
2.5.2 Decolorization of textiles ... 37
2.6 Recycling method ... 40
2.6.1 Conventional polymer recycling ... 41
2.7 Preliminary study - development of SFS decolorization method ... 45
2.7.1 Effect of treatment conditions on fabric decolorization ... 48
2.7.2 Fabric strength assessment ... 57
2.7.3 Conclusions from preliminary study... 58
3. PRESENT RESEARCH ... 59
3.1 Objectives ... 59
3.2 Rational ... 59
4. REUSE OF DECOLORIZATION BATH AND DECOLORIZED FABRICS ... 61
4.1 Introduction ... 61
4.2 Experimental ... 64
4.2.1 Material ... 64
4.2.2 Batch fraction distillation ... 65
4.2.3 Application of disperse dyes to decolorized fabrics ... 65
4.2.4 Decolorization of laboratory-dyed fabrics using acetone distillate ... 66
4.2.5 Color evaluation ... 66
4.2.6 Fabric strength evaluation ... 67
4.3 Results and discussion ... 67
4.3.1 Solvent recovery and reuse ... 67
4.3.2 Re-dyeing decolorized cationic dyeable PET ... 68
4.3.3 Burst pressure measurement ... 74
4.4 Conclusion ... 74
5. THE ECOTOXICITY OF SODIUM FORMALDEHYDE SULFOXYLATE DECOLORIZATION MEDIUM ... 75
5.1 Introduction ... 75
5.2.1 Materials and organisms ... 80
5.2.2 Decolorization of commercial dyes ... 80
5.2.3 Ecotoxicity testing ... 81
5.3 Results ... 81
5.3.1 SFS decolorization of commercial dyes... 81
5.3.2 Daphnia similis test ... 85
5.3.3 Parhyale hawaiensis test ... 88
5.4 Conclusion ... 91
6. LIFE CYCLE ASSESSMENT OF CLOSED-LOOP RECYCLING OF PET FABRICS ... 92
6.1 Goal and scope ... 92
6.2 Introduction ... 93
6.3 Methodology ... 95
6.3.1 Goal and scope, functional unit and system boundary ... 95
6.3.2 Data collections and assumptions ... 98
6.3.3 Weight and normalization ... 100
6.4 Closed-loop recycling of polyester fabric ... 103
6.5 Life-cycle assessment results ... 104
6.5.1 Comparative analysis ... 104
6.5.2 Contribution analysis ... 106
6.6 Sensitivity and uncertainty analysis ... 109
6.7 Conclusion ... 111
7. COMMERCIAL BLACK DYE COMPOSITION AND THEIR DECOLORIZATION PROPERTIES ON POLYESTER FABRIC ... 112
7.2 Experimental ... 114
7.2.1 Materials ... 114
7.2.2 Decolorization of commercial black fabrics ... 115
7.2.3 Fabric color evaluation... 115
7.2.4 Chemical analysis ... 115
7.2.5 Preparation of disperse dyes ... 117
7.2.6 Decolorization of commercial dye solutions ... 119
7.3 Results and discussion ... 119
7.3.1 Analytical results ... 119
7.3.2 Comparison with synthesized disperse dyes ... 128
7.3.2 Decolorization results ... 130
7.4 Conclusion ... 134
8. FUTURE WORK ... 135
9. REFERENCES... 138
LIST OF TABLES
Table 1. Relationship between polyester molecular weight and spinnability 3. ... 5
Table 2. Abrasion resistance of polyester and other synthetic fibers. ... 7
Table 5. Absorption of visible light and color seen ... 16
Table 6. Disperse dyes considered a health risk to consumers. ... 21
Table 7. Interpretation of LC50 values. ... 27
Table 6. K/S values of commercial PET fabrics before and after SFS (40g/L) treatment in acetone/water (1:1) at 100°C. ... 47
Table 7. Intrinsic viscosity (IV) Vs viscosity-average molecular weight for control PET fabric and PET fabric after SFS (40g/L) treatment in acetone/water (1:1) at 100 ˚C. ... 57
Table 8. C.I. names, classes, and structures of dyes used in this study. ... 64
Table 9. Acetone recovery percentage from lab-scale fractional distillation. ... 67
Table 10. K/S values from lab-dyed cationic dyeable PET fabrics using virgin and recovered acetone for SFS (40g/L) decolorization in water/acetone (1:2) at 100 °C. ... 68
Table 11. Color difference values of cationic dyeable PET fabrics between once decolorized fabrics and virgin white fabrics dyed by corresponding original colors. ... 69
Table 12. Color difference values of cationic dyeable PET fabrics between twice decolorized fabrics and virgin white fabrics dyed by corresponding original colors. ... 71
Table 13. Color difference values of cationic dyeable PET fabrics between three-time decolorized fabrics and virgin white fabrics dyed by Disperse Yellow 42. ... 73
Table 14. C.I. names, classes, and structures of dyes used in this study. ... 79
Table 15. EC50 (%) values of SFS decolorized solution tested with Daphnia similis. ... 87
Table 16. Global harmonized system criteria for classification of a substance in acute categories ... 88
Table 18. Physico-chemical parameters of Parhyale hawaiensis acute toxicity test. ... 89
Table 19. Globally harmonized system criteria for classification of hazardous to the aquatic environment. ... 91
Table 20. Basis of the comparative life cycle assessment study. ... 97
Table 21. Data source of this study. ... 101
Table 22. Impact categories and TRACI normalization factors (US 2008) used in LCA analysis ... 102
Table 23. Normalized LCA results for producing 1 metric ton of PET fiber by virgin and recycled fiber production methods. ... 105
Table 24. Processes contributing to acidification potential in recycled PET fiber production ... 107
Table 25. Processes contributing to acidification potential in virgin PET fiber production ... 107
Table 26. Retention time, area, and percentage area of peaks ... 122
Table 27. Identification of disperse dyes. ... 125
Table 28. H-NMR spectral results of the Orange, Blue1 and Red dyes. ... 128
LIST OF FIGURES
Figure 1. Simplified two-step PET manufacturing process. ... 4
Figure 2. Structure of cationic dyeable polyester... 5
Figure 3. Structures of various chromophores. ... 9
Figure 4. General structure of aminoazobenzene disperse dye. ... 10
Figure 5. Disperse dye structure based on aminoazobenzene. ... 11
Figure 6. Structural skeleton of most anthraquinone disperse dyes. ... 12
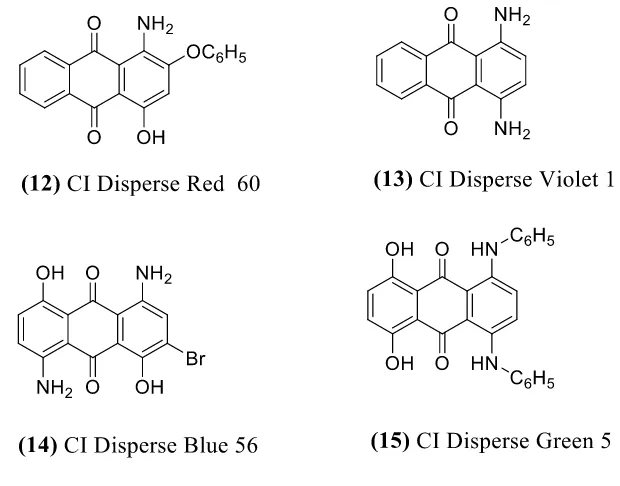
Figure 7. Disperse dye structure based on anthraquinone. ... 13
Figure 8. Chemical structure of two heterocyclic disperse dyes... 14
Figure 9. Colorless compound liberated from reaction of basic dye with alkali. ... 15
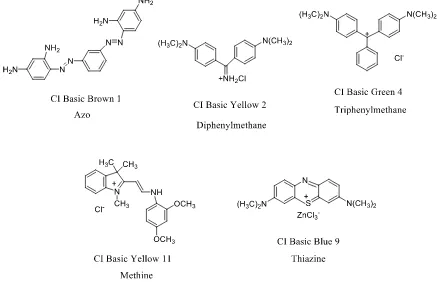
Figure 10. Structure and color index specification of some basic dyes. ... 15
Figure 11. Chemical structures of some bladder carcinogens. ... 20
Figure 12. Chemical structure of 6BT and 4PhDAB. ... 23
Figure 13. Electrophilic nitrenium ion from amino-containing compounds. ... 24
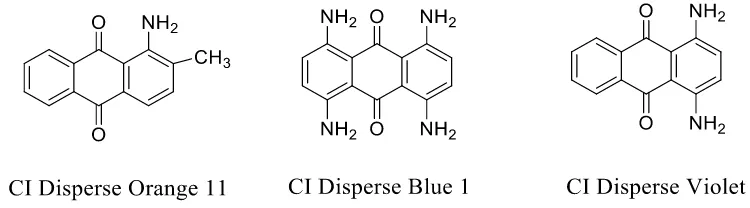
Figure 14. Carcinogenic CI Disperse Orange 11 and CI Disperse Blue 1, and mutagenic CI Disperse Violet 1. ... 24
Figure 15. Metabolic pathway for polycyclic aromatic hydrocarbons. ... 25
Figure 30. Proposed initial pathway for degradation of commercial DR1 dye by photo-Fenton oxidation35. ... 28
Figure 17. Production of reactive species in hydrogen peroxide (1), ... 31
Figure 18. Proposed degradation pathway for the dye RB 171 by ozonation53... 33
Figure 19. Chemical structures of some important reducing agent. ... 34
Figure 20. Reductive degradation of azo dye under anaerobic condition. ... 35
Figure 21. General overview of the fate of azo dyes during anaerobic-aerobic treatment. .. 36
Figure 23. Reductive dehalogenation of phenacyl halide in ethanol medium by SFS... 40
Figure 24. SFS decomposition reaction upon heated. ... 40
Figure 25. Preparation of benzothiazole from BHET (a) and synthesis of dyes (b)81. ... 44
Figure 26. Color photographs of polyester fabric dyed with synthesized dyes. ... 45
Figure 27. Changes in the UV-visible spectrum of (A) Disperse Blue 56, (B) Disperse Orange 30, (C) Disperse Yellow 42, and (D) Basic Yellow 28 after SFS (25g/L) treatment in water/acetone (1:1) medium. ... 46
Figure 28. Commercial PET fabrics before and after SFS (40g/L) treatment in acetone/water (1:1) at 100°C. ... 48
Figure 29. Effect of (a) treatment time, (b) water to acetone ratio, (c) SFS concentration, (d) Temperature, and (e) liquor ratio on K/S value of black commercial fabrics after decolorization. ... 54
Figure 30. Visualized effect of (a) treatment time, (b) water to acetone ratio, (c) SFS concentration, (d) Temperature, and (e) liquor ratio on K/S value of black commercial fabrics after decolorization. ... 55
Figure 31. Diagram of experimental device for lab-scale fractional distillation. (1) Digital hot plate, (2) round-bottom flask, (3) condenser used as fractionating column, (4) two-way adapter, and (5) condenser. ... 65
Figure 32. Cationic dyeable PET fabrics showing the color difference between virgin (left) and once decolorized fabrics (right) after dyeing in the same bath. (a) Disperse Red 60, (b) Disperse Orange 30, (c) Disperse Yellow 42, and (d) Disperse Blue 79. ... 70
Figure 33. Cationic dyeable PET fabrics showing the color difference between virgin (left) and twice decolorized fabrics (right) after standard dyeing in same bath. ... 71
Figure 34. Disperse Yellow 42 on three-time decolorized cationic dyeable PET fabrics originally dyed by (1) virgin-standard, (2) Disperse Yellow 42, (3) Disperse Orange 30, (4) Disperse Red 60, and (5) Disperse Blue 79. ... 73
Figure 35. Preparation of sodium formaldehyde sulfoxylate through (1) reaction of formaldehyde with dithionite, and (2) reaction of bisulfite and formaldehyde with zinc. ... 75
Figure 36. Reduction of aromatic aldehyde to alcohol by SFS in aqueous media72. ... 76
Figure 38. SFS decomposition reaction upon heated. ... 78 Figure 39. UV-Vis absorption spectra of commercial dyes (100mg/L) and SFS
decolorized (SFS=10g/L, 95 °C, 45min) solutions. ... 83 Figure 40. Comparison of decolorization percentage after SFS decolorizaton treatment
(10g/L, 95 °C, 45min). ... 85 Figure 41. EC50 (%) values and confident intervals of SFS decolorized solution tested
with Daphnia similis. ... 87 Figure 42. LC50 (%) values and confident intervals of SFS decolorized solutions tested
with Parhyale hawaiensis. ... 90 Figure 43. Cradle-to-gate system boundaries of virgin PET fiber production system
(left), and recycling PET fibers from waste PET textile products (right). ... 98 Figure 44. The closed-loop recycling process. ... 104 Figure 45. Comparison of environmental impacts for producing 1 metric ton of PET
fiber by virgin (Black) and recycled (Red) fiber production system using
TRACI method. ... 106 Figure 46. Sensitivity of the acetone consumption to acidification, global warming,
photochemical ozone formation, and resource depletion... 110 Figure 47. Disperse Black 9 formation inside textiles. ... 113 Figure 48. TLC analysis of black fabric extract using chloroform: acetone (19:1). ... 120 Figure 49. UV-vis spectra of orange, blue1, red and blue2 fractions in
chloroform/acetone (19/1, v/v) obtained by UV-vis spectroscopy. ... 120 Figure 50. Chromatographic separation of the sample extracted from commercial black
fabric at 515 nm. ... 122 Figure 51. UV-vis spectra obtained by photodiode array detection of peak 1 obtained at
3.167 min, peak 2 at 3.383 min, peak 3 at 4.133 min, and peak 4 at 5.483
min. ... 123 Figure 52. High resolution mass spectra and possible structures characterizing
Figure 55. TLC chromatogram compassion of A: black fabric extraction; B:
synthesized orange disperse dye; and C: synthesized blue disperse dye using
hexane/ethyl acetate (1/20). ... 130
Figure 56. Commercial black fabric before and after SFS (10g/L) treatment in water/acetone (1:2) at 100 ˚C for 30 min. ... 131
Figure 57. Commercial disperse dye solution of SFS (10g/L) treatment in water/acetone (1:2) at 100 ˚C in different treatment times: A=0 min, B=5 min, C= 10 min and D=15 min. ... 133
Figure 58. Absorption spectra changes during the SFS decolorization ([SFS] =10g/L, water/acetone=1/2, 100 ˚C) of black dye mixture solution. ... 133
Figure 60. SEM pictures of SFS decolorized polyester fabrics. ... 136
Figure 61. Microscopic pictures of (a) blue fiber and (b) decolorized blue fiber. ... 137
Figure 62. Full 1H-NMR spectrum of synthesized orange disperse dye. ... 158
1. INTRODUCTION
Polyethylene terephthalate (PET) fiber, commonly known as polyester fiber, has become the fiber of choice within textile industry due to its unique set of advantages. The overall demand for polyester fiber is increasing year-by-year. The low price of the virgin polyester fiber accounts significantly for this growing trend. One major application of polyester fiber is the production of fabrics, which are extensively used in all kinds of apparel, home furnishings, and other finished textile goods that are regularly disposed and ended in landfills. However, disposing PET products in landfills creates significant environmental issues, because of the durability of the polymer involved. In addition, the manufacture of PET is an energy-intensive process requiring large amounts of crude oil. One-time use of PET fabric is regarded as a waste of valuable polymer derived from non-renewable petroleum resources. Efforts have been devoted to recycle PET beverage bottles and liquid containers. However, methods that have been developed to recycle PET bottles are not applicable to recycle PET fabrics due to the presence of dyes.
Removing dyes from textile wastewater has been widely studied in recent years. Physical methods, including adsorption and membrane filtration, chemical methods, such as bleaching and ozonation, and biological methods have been reported. However, there is no systematic study on removing dyes from fabric in order to achieve fabric recycling. Bearing this in mind, an innovative approach is proposed in this work to decolorize dyes from fabrics.
This project will achieve the following objectives:
(2) Determine the scope of disperse dyes that can be removed by the decolorization method.
(3) Study the recyclability of the decolorized fabric. (4) Study the ecotoxicity of the decolorization process.
2. LITERATURE REVIEW
2.1 Polyethylene terephthalate
2.1.1 Introduction to polyethylene terephthalate
Polyethylene terephthalate, commonly abbreviated PET, is the most common form of polyester used commercially. PET has wide range of applications. It is spun into fibers for the production of fabric, blow-molded into disposable beverage bottles, and extruded into photographic film and magnetic recording tape. The history of polyester fiber dates back to the early 1940s when British scientists Whinfiled and Dickson firstly synthesized PET from a combination of terephthalic acid and ethylene glycol and found it was well suited for forming fiber. The first marketed polyester fiber was patented as Terylene by Imperial Chemical Industries Ltd, and later DuPont manufactured another polyester fiber using modified nylon technology, which they named Dacron. Subsequent to the development of Terylene and Dacron, a whole range of trademarked products as Kodel and Mylar were rapidly produced during 1960s and 1970s 1.
Figure 1. Simplified two-step PET manufacturing process.
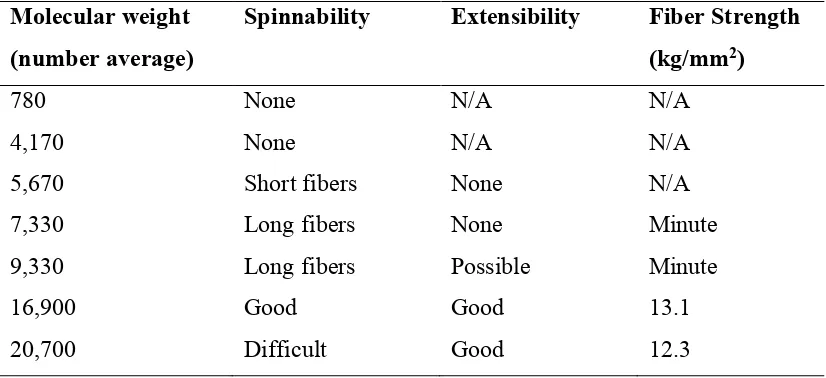
Table 1. Relationship between polyester molecular weight and spinnability 3.
Molecular weight (number average)
Spinnability Extensibility Fiber Strength (kg/mm2)
780 None N/A N/A
4,170 None N/A N/A
5,670 Short fibers None N/A
7,330 Long fibers None Minute
9,330 Long fibers Possible Minute
16,900 Good Good 13.1
20,700 Difficult Good 12.3
Apart from the conventional polyester fiber, there are cationic dyeable polyesters (CDP) that also became popular. CDP is a special polyester having anionic sites in the main chain5. The schematic structure of CDP is shown in Figure 2. It is worth mentioning that in a CDP polymer chain, the number of sections containing anionic sites are much less than the number of normal ester sections.
Figure 2. Structure of cationic dyeable polyester.
2.1.2 Properties of polyesters
in the textile market. In fact, in 2014, world production of polyester reached 46.1 million tons, which is greater than production of all the other synthetic fibers6. Distinguished properties of PET take credit for its success. The presence of aromatic rings in the main chain gives PET notable stiffness and strength. When heated above its glass-transition temperature, PET turns from a rigid glass-like form into a rubbery elastic state, where the polymer molecular chain can be stretched and aligned in one direction to form polyester fibers7. Polyester fibers exhibit high elastic modulus, which indicates that polyester fibers possess superb elastic recovery8. This capacity of recovering rapidly imparts polyester fibers with excellent crease resistance and very good dimensional stability. When used in textiles, PET also has many other attractive properties, like good abrasion and heat resistance9. Abrasion is an undesirable but inevitable effect of exposure to normal use. The abrasion of resistance of PET fiber is not as excellent as polyamide fibers, but almost equals to or surpasses the values of viscose and acetate fibers10.
of PET, the ester linkages should undergo hydrolysis attacked by acids and alkalis. However, polyester fiber shows chemical resistance better than expected. Because the attack of these chemical agents is limited essentially to the surface, since water-soluble acids and alkalis cannot diffuse insider the nonpolar polymer phase. For the same reason, polyester fibers show an outstanding resistance to oxidants and reducing agents. CDP, the modified polyester, possesses similar properties with fibers of normal PET. However, the meta substitution in the anionic section increases segmental mobility, resulting in lower glass transition temperature and lower thermal stability of the CDP14. Also the CDP is more readily hydrolyzed.
Table 2. Abrasion resistance of polyester and other synthetic fibers.
Type of fiber Number of rubs up to breaking point
Dry Wet
Polyester 1980 1870
Polyamide 8800 3890
Polyacrylonitrile 135 139
Viscose 880 28
Acetate 409 58
2.2 Coloration of polyester
compact structure of polyester fibers, only pale to medium shades can be obtained under atmospheric conditions. For darker shades it is necessary to employ various carriers or raise dyeing temperature to increase the disperse dye diffusion. Cationic dyeable polyester fibers is a special polyester fiber that can be dyed with both disperse dye and cationic dye.
2.2.1 Disperse dyes
for permanent press finishing treatments. They are not generally suitable for the carrier dyeing of polyester at the boil. From a dye chemist’s perspective, a classification by chromophore is very useful. The Color Index listed around 1,150 disperse dyes in 1992 by chemical class, and the categories include but not limit azo (1), anthraquinone (2), nitrodiphenylamine (3), methine (4), quinoline (5), coumarin (6), and aminoketone (7). The corresponding chemical structures of the chromophores are demonstrated in Figure 3.
Figure 3. Structures of various chromophores.
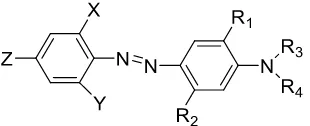
important. Aminoazobenzene is a typical structure in mono-azo disperse dye, which is presented by the structure in Figure 4. The characteristics of the product is controlled by the chemical nature of the substituents.
Figure 4. General structure of aminoazobenzene disperse dyes.
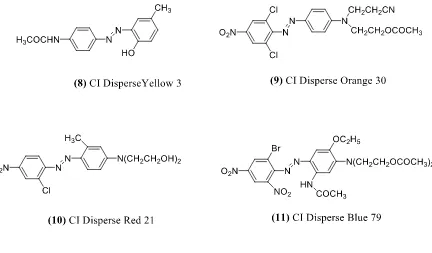
Figure 5. Disperse dye structure based on aminoazobenzene.
There are some deficiencies in azo dyes, which dye chemist should pay attention to during application, such as duller shades and lower light fastness than anthraquinone dyes, and the potential to breakdown into carcinogenic amines derived from the cleavage of the azo linkage20. However, the cost effectiveness compensates for the drawbacks mentioned above, which makes azo dyes still the largest class of synthetic organic dyes.
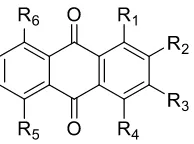
Figure 6. Structural skeleton of most anthraquinone disperse dyes.
Figure 7. Disperse dye structure based on anthraquinone.
Figure 8. Chemical structure of two heterocyclic disperse dyes.
2.2.2 Basic dyes
Concerning cationic dyeable polyesters, it literally means that they can be dyed by a cationic dye, which is also known as basic dye. Meanwhile, being dyeable by basic dyes does not prevent them being dyeable by disperse dyes as well. The consumption of CDP accounts for less than 10% of the polyester market, and they are often blended with other fibers to achieve certain properties. For example, when CDP is blended with polypropylene, the resulting mixed fiber shows reduced crystallinity, which favors the dyeability of the fibers21.
Basic dyes also have various chemical classes defined by their chromophores. Figure 10 shows structure and color index specification of several important basic dyes belonging to various classes.
advantages like wide shade range, good brightness and relatively economical. However, they also have marked disadvantages, such as poor shade stability, very poor light fastness, high acid content, and color backwaters, making them not as wide spread as disperse and other dyes.
Figure 9. Colorless compound liberated from reaction of basic dye with alkali.
2.3 Dye characterization
2.3.1 Ultraviolet-visible spectroscopy
Color of a substrate is determined by the light reflected from the surface of a solid or passing through a liquid. Sunlight has uniform white color, but it is actually composed of a broad range of wavelengths in the ultraviolet (UV), visible and infrared (IR) portions if the spectrum. Visible wavelengths cover a range from approximately 400 to 700 nm, among which the shortest is violet and the longest is red. When a beam of sunlight or other white light is illuminated at a red dye, a portion of mixed wavelengths is absorbed, leaving the red light to be reflected. The remaining red light is the complementary color to the wavelengths absorbed. Ultraviolet-visible (UV-Vis) spectrophotometer is used to measure the absorbed light22. The relationship between the wavelength absorbed, colored absorbed and the color seen by human eye is demonstrated in Table 3.
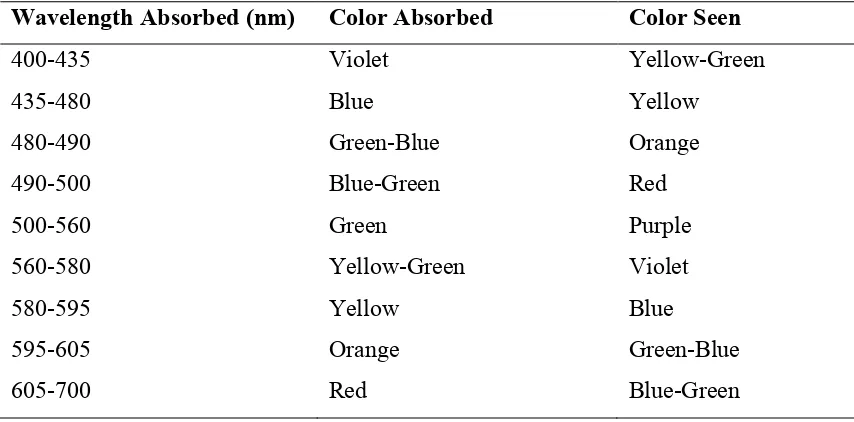
Table 3. Absorption of visible light and color seen
Wavelength Absorbed (nm) Color Absorbed Color Seen
400-435 Violet Yellow-Green
435-480 Blue Yellow
480-490 Green-Blue Orange
490-500 Blue-Green Red
500-560 Green Purple
560-580 Yellow-Green Violet
580-595 Yellow Blue
595-605 Orange Green-Blue
For dye solution, other than measuring the absorbed wavelength of the sample, concentration of the dye solution can also be obtained by UV-Vis measurement. Because the absorption of light by a dye in solution is directly proportional to its concentration; i.e., the greater the concentration of the dye, the greater of the amount of light is absorbed. The equation for the absorption is known as Beer-Lambert Law, which is:
𝐴 = 𝜀𝑏𝑐
Where A is the observed absorption, b is the path length of the sample cell, c is the concentration of the sample, and ε is the absorptivity or molar extinction coefficient, which is specific for each species23. Typical ε values for mono-substituted anthraquinone disperse dyes are in the range of 4,000-7,000, and for di-substituted anthraquinone disperse dyes are about 10,000-17,000.
2.3.2 Chromatography
choice of materials, e.g. cellulose, silica, alumina, inert gas, etc. High performance liquid chromatography (HPLC) is an improved form of column or thin layer chromatography. It uses material with very small particle size for column packing, which gives a larger surface area for interactions between the stationary phase and the molecules flowing through it. Moreover, there are two phases in use in HPLC depending on the relative polarity of the solvent. One is normal phase, the column of which is filled with polar materials as same as normal thin layer chromatography. The other is reversed phase HPLC. In this case, the column is filled with modified silica gels to make it non-polar. Although it is described as “reversed”, it is the most commonly used form of HPLC. In addition, the detection method is also improved by using highly automated and extremely sensitive technologies.
2.3.3 Mass spectrometry
known patterns or other referrals, which means LC-MS can identify a wide range of compounds without having to know their retention times.
2.4 Toxicity
Figure 11. Chemical structures of some bladder carcinogens.
2.7.1 Dye structure property relationships
Table 4. Disperse dyes considered a health risk to consumers.
C.I. Name Chemical structure Disperse Blue 106
Disperse Blue 124
Disperse Blue 1
Disperse Yellow 3
Disperse Orange 1
Disperse Orange 3
Disperse Red 1
Disperse Red 17
potential. Besides, disperse dyes containing anthraquinone or azo structures are more likely to cause contact dermatitis28.
Certain reactive dyes have been implicated in causing acute effects on plant workers who manufacture or handle the dyes29. Reactive dyes for cotton are water-soluble and readily hydrolyzed. Once the dye has been used to color the cotton fabric, the dye structure is modified, i.e., a covalent bond is formed between the dye and the hydroxyl group in the fiber. Any reactive dye left on the surface should be hydrolyzed in the wet dyeing process and can be easily removed through washing and rinsing. That is the reason why reactive dyes should poses no problems in consumers but mainly in plant workers.
Genotoxicity is the major long-term potential health hazard of certain textile dyes. Genotoxic chemicals include mutagens, carcinogens and teratogens. Some azo dyes have been found to be both mutagenic and carcinogenic, e.g., 6-dimethylaminophenylazobenzothiazole (6BT) is a potent carcinogen and mutagen in rat following dietary administration30. In stark contrast, some other azo dyes are neither mutagenic nor carcinogenic, e.g., 4’-phenyl-4-dimethylaminozaobenzene (4PhDAB) shows low azoreductase activity in the Salmonella
Figure 12. Chemical structure of 6BT and 4PhDAB.
The underlying principle for dyes to induce genotoxic effects on living organisms is that the dyes need to penetrate the cell membranes and attack the DNA function. Therefore, physical factors of dyes such as solubility and molecular size are essential in determining whether the dye penetration occurs. In general, molecules with small size are more readily transported across the cell membranes than larger molecules. Above a certain molecular size, MW > 800, chemicals become too large to transport across the membranes. Thus, producing dyes with large molecular size is a potential way to prevent genotoxic effects. Indeed, this approach was adopted to produce non-toxic food dyes. Solubility is also of importance in determining the toxicity of dyes. Majority of pigments are non-carcinogenic because the nature of large pigment particles does not allow them to pass the cell membranes. Dyes with high water solubility are often non-carcinogenic. Because water-soluble molecules are generally excreted rapidly, bioaccumulation of such dyes is less likely to occur in a living organism32.
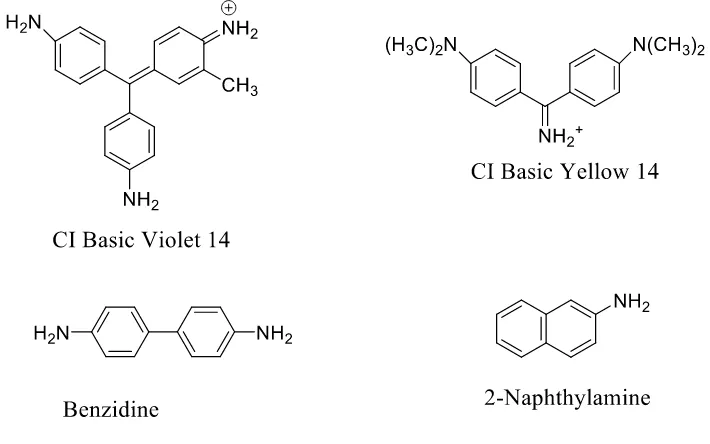
amino-containing dye. Figure 13 shows the general process for these compounds to produce an ultimate electrophilic nitrenium ion33. This pathway occurs at primary or secondary amino groups, and at methylamino- or dimethylamino-groups via oxidative demethylation. As earlier mentioned, half of these compounds increasing the bladder cancer incidence are large depots for the nitrenium ion. Anthraquinone structure does not contain azo bond, but also follows the similar reaction mechanisms. Anthraquinone dyes having one or more primary amino- or methylamino- groups tend to be genotoxic. For instance, in Figure 14, CI Disperse Orange 11, and CI Disperse Blue 1 are carcinogens, and CI Disperse Violet 1 is a mutagen. Cationic dyes have been reported to be carcinogenic, such as CI Basic Violet 14 and CI Basic Yellow 14, as shown in Figure 11.
Figure 13. Electrophilic nitrenium ion from amino-containing compounds.
Carcinogens from carbon and oxygen electrophiles are not as common as nitrogen electrophiles. However, they are encountered in the synthesis or chemical modification of dyes. They are usually chemicals containing alkyl substituents bearing a leaving group, such as chlorine and bromine, or a strained small ring system, which open to generate an electrophilic center. Some agents used in the synthesis of dyes produce electrophilic carbon by the polarization induced by the electron-withdrawing group. Typical examples are vinyl chloride, acrylamide and acrylonitrile. Many compounds having four or more fused benzene rings are believed to be carcinogenic. Because they tend to generate an electrophilic carbon center via epoxide formation, as illustrated in Figure 1534.
Figure 15. Metabolic pathway for polycyclic aromatic hydrocarbons.
2.4.2 Methods used
measured effect is plotted graphically with the concentration. The endpoint for acute toxicity is usually survival, whereas endpoints for chronic studies are sub-lethal effects such as growth, reproduction, behavior.
2.7.2.1 Acute toxicity tests
Table 5. Interpretation of LC50 values.
LC50 (mg/L) Toxicity rating
>100 Relatively nontoxic
10-100 Moderately toxic
1-10 Very toxic
<1 Extremely toxic
Much research has been conducted to investigate the ecotoxicity of some commercially available disperse dyes and their main degradation products by either reduction or oxidation. For example, ecotoxicity of Disperse Red 1 (DR1), an azo dye, and the degradation products generated during photo-Fenton degradation has been assessed by measuring acute toxicity with microcrustacean Daphnia similis35. The tests were performed with Daphnia similis in 48 h, and EC50 values were reported. By real-time monitoring the photo-Fenton degradation process, it was found that toxicity increased after 10 min as a consequence of generation of degradation products of higher toxicity than DR1. After 45 min reaction, acute toxicity of DR1 azo dye to
Figure 16. Proposed initial pathway for degradation of commercial DR1 dye by photo-Fenton oxidation35.
2.7.2.2 Chronic toxicity tests
generations are exposed during a typical study, and therefore chronic tests should not use these species. As acute toxicity tests, chronic toxicity tests also have standard testing methods regulated by environmental agencies. Important information derived from the concentration-response curve tells the NOEC (no observable effect concentration), LOEC (lowest observable effect concentration), and MATC (maximum allowable toxicant concentration) values of the chemical.
2.5 Decolorization treatment
According to the treatment object, decolorization can be classified into two categories: decolorization of solid phase and decolorization of liquid phase. The latter is well known as wastewater decolorization treatment. Decolorization of solid phase, which means stripping colors from a solid substrate, has been less investigated.
2.5.1 Wastewater decolorization treatment
on the decolorization of textile dyes has mainly been focused on water-soluble dyes, while decolorization of disperse dyes has received only scant attention.
2.5.1.1 Chemical methods
ozone reaction are not sensitive to pH and only mildly affected by temperature. In that study, researchers also found that ozone does not react preferentially with uncolored organic compounds. In practice, ozone alone is usually utilized for the treatment of drinking water. At present, Advanced Oxidation Process (AOP) 39,48–52 has been developed to oxidize organic compounds to harmless products with high reaction rate as well as low environmental emissions. The AOP is mainly a catalyst-driven process, using UV light or metal catalyst with an oxidizer such as H2O2 and/or ozone to generate highly reactive hydroxyl radicals, which can attack organic compounds non-selectively. For example, Fenton’s reagent, which is a combination of H2O2 and an iron catalyst, is able to generate free radicals automatically without UV light or heating42. Equation (1) in Figure 17 is the process of conventional hydrogen peroxide releasing reactive species HOO-. Equations (2) and (3) show how the hydroxyl radicals are produced from Fenton’s reagent, and how the ferric iron is reduced back to ferrous ion, indicating Fe2+ can be recycled after treatment.
Figure 17. Production of reactive species in hydrogen peroxide (1), and Fenton’s reagent (2), (3)
satisfactory result was obtained by hypochlorite oxidation, while the best treatment result was obtained with Fenton process, and the performance of ozone and electrochemical oxidation are between the two extremes, as judged by color removal and chemical oxygen demand (COD) removal.
Figure 18. Proposed degradation pathway for the dye RB 171 by ozonation53.
compounds are mainly due to the cleavage of C-S bond and the formation of intermediate SO2 2-anions of sulfoxylic acid, radical ions SO2-, and S2O42- dithionite ions54,55.
Figure 19. Chemical structures of some important reducing agent.
When evaluating the reduction of dyes in wastewater, it is also important to investigate the potential reversal of the reaction upon exposure to oxygen, since color may reappear when the treated wastewater is discharged to the environment. A study was conducted to evaluate the effectiveness of three reducing agents in decolorizing Navy 106 (a mixture of three azo dyes)56. In this study, the reduction process was the chemical pretreatment, followed by aerobic biological treatment. Three reducing agents were evaluated: 225 ppm sodium hydrosulfite, 225 ppm thiourea dioxide, and 150 ppm sodium borohydride. The chemical pretreatments were effective in removing color. However, they were not effective in removing BOD, and did not enhance the biodegradation when used in tandem with aerobic biological treatment.
2.5.1.2 Biological methods
treat wastewater generated from textile dyeing operations. However, the ineffectiveness of aerobic biological treatment in reducing color has caused aesthetic issues. Azo disperse dyes, for example, are highly resistance to biodegradation under aerobic conditions. It has been reported that azo dyes undergo reductive splitting of the azo bond relatively easily under anaerobic microbial conditions, resulting in the formation of aromatic amines. The anaerobic treatment takes place in the absence of oxygen and converts various organic compounds to methane and carbon dioxide57. This process is considered to be microbiologically a nonspecific process, as presented in Figure 20.
Figure 20. Reductive degradation of azo dye under anaerobic condition.
Figure 21. General overview of the fate of azo dyes during anaerobic-aerobic treatment.
dyestuffs undergo anaerobic reduction generating organic amines that are more amenable to aerobic biodegradation than the original dyes is supported by these results.
2.5.1.3 Other methods
There are also other wastewater treatment methods that have been widely discussed, such as physical and physical-chemical wastewater treatment methods. Physical methods may not be dye-specific, but can be used to remove undissolved chemicals and particulate matter present in wastewater. Adsorption, for example, is one of the most effective, economically feasible techniques to remove textile dyes. Carbon-based adsorbent materials have been used for adsorption of various types of dyes, ranging from acid, direct, basic, and reactive to disperse dyes63,64. In general, low adsorption has been observed for acid and reactive dyes with low molecular weight, whereas high adsorption occurs with basic and direct dyes which are usually of higher molecular weight, and medium to high adsorption for disperse dyes which are hydrophobic in nature57. A major disadvantage of activated carbon adsorption is its high price, which calls for regeneration. Carbon adsorption is considered as neither an efficient nor economical decolorization treatment method. Therefore, it is recommended as a finishing and polishing step after a chemical or biological process65. Ion exchange, coagulation-flocculation, and membrane technologies are also reported for textile wastewater treatment66,67. However, they have disadvantages either high cost or secondary salt and sludge formation, which make them not a promising application for commercial treatment.
2.5.2 Decolorization of textiles
chemical agents to decompose the dye structure. There are limited efforts on fiber and fabric decolorization specifically. Hydrogen peroxide was patented to bleach hair fibers68. Reduction clearing of disperse on the surface of polyester fabric may also be considered as a decolorization process. Disperse dyes adsorbed on surfaces are broken down into smaller and more water-soluble fragments by reduction clearing agents, usually made up of sodium dithionite and sodium hydroxide. Oxidative clearing of polyester fabric, is an alternative method to remove disperse dyes from polyester surface. Comparable wash fastness results to conventional reduction clearing and lower chemical oxygen demand values were reported by oxidative clearing process using hydrogen peroxide or ozone as the oxidation agent69.
(Path A in Figure 22) or initial HOCH2SO2- anions (Path B in Figure 22). Considered that the reduction rate of some carbonyl compounds by sodium dithionite is more rapid than that by SFS, Path B seems to be more favored.
Figure 22. Reduction of aromatic aldehyde to alcohol by SFS in aqueous media72.
SFS also serves as an efficient reagent for the reductive dehalogenation of aldehydes and ketones. In Figure 23, a phenacyl halide was reduced in ethanol medium slowly (24 h) at room temperature or rapidly (<1 h) at reflux temperature to achieve the corresponding product73. Addition of SO22- anion to ketone was also proposed as another possible mechanistic pathway. However, the nucleophilic displacement of halide by HOCH2SO2- anion, followed by loss of formaldehyde and SO2, was still more favored, because of the pronounced tendency of α -haloketones to undergo halogen displacement.
Figure 23. Reductive dehalogenation of phenacyl halide in ethanol medium by SFS.
Regarding physical properties, SFS is readily soluble in water, but is not stable in aqueous solution at high temperature. It contains large, transparent, and tubular crystals. It is a heavily hygroscopic substance and should be stored in a dry, cool and dark place, protected from moisture. SFS is odorless or possesses a faint leek smell. The loss of reactivity is indicated if a fishy smell is produced. It liberates toxic gases (H2S and SO2) upon heated, as the equation in Figure 24 shows74. Nevertheless, SFS is a powerful reducing agent, is inexpensive and commercially available, and can be handled without any special precautions, which make it a great candidate for decolorizing polyesters.
Figure 24. SFS decomposition reaction upon heated.
2.6 Recycling method
important action to reduce these impacts. Recycling provides opportunities to reduce oil usage and the quantities of landfilling wastes.
2.6.1 Conventional polymer recycling
for the purpose of sustainability. In their work, post-consumer soft-drink bottles were depolymerized by excess ethylene glycol in the presence of a metal acetate as catalyst. The resulting monomers and oligomers could be used as raw material to synthesize PET. Since then, the research of recycling PET bottles has been achieved significant progress. There are commercial approaches that have been well-established to recycle the PET bottles, either chemically or mechanically. However, recycling technology for dyed PET fabrics is limited, making incineration the predominant method of textile waste processing excluding landfilling. Incineration, which is a way of quaternary recycling, only involves energy recovery and poses potential environmental problems, such as toxic ash emissions. Energy recovery from polymer wastes requires complete or partial oxidation of the material, producing heat, power and/or gaseous fuels, oils and chars. Each method provides a unique set of advantages that make it particularly beneficial for specific locations, applications or requirements.
2.6.2 Fabric reuse
Fabric reuse is different from primary recycling, which is a simply donating and transferring process. It involves chemical decolorization and re-dyeing the fabrics, producing products with new colors. Since polyester is a durable material, it is hard to damage the clothes by normal use. Decolorizing old-fashioned fabric and re-dyeing seem to be a good option to meet the continuously changing fashion markets and extend the life cycles of polyester fabrics. Unfortunately, there is little literature regarding this type effort. When referring to fabric reuse, it is more likely to be quilting, re-purposing, and donating.
conducted to optimize the PET decolorization using Fenton’s reagent, and the optimal conditions involved using FeSO4 (0.18mM), H2O2 (1235mM), in water/acetone mixture (1:1,v/v), at 120°C for 15 min. They found the use of acetone as a co-solvent with water was the key factor in providing efficient PET fabric decolorization. The efficiency of the optimized method was examined for a variety of disperse dyes, including azo dyes (Disperse Orange 30 and Disperse Blue 79), nitrodiphenylamine dyes (Disperse Yellow 42 and Disperse Yellow 86), anthraquinone dyes (Disperse Blue 56 and Disperse Red 60), a quinoline dye (Disperse Yellow 54), and a basic dye (Basic Yellow 28). Result showed that PET fabric dyed by such colorants differ in ease of decolorization by Fenton’s reagent. Disperse Blue 79, Disperse Blue 56, Disperse Red 60 and Disperse Yellow 54 were successfully decolorized using the optimum conditions, while Disperse Orange 30, Disperse Yellow 42 and Disperse Yellow 86 were not fully decolorized using the same method.
(a)
(b)
Figure 26. Color photographs of polyester fabric dyed with synthesized dyes.
2.7 Preliminary study - development of SFS decolorization method
A B
C D
Figure 27. Changes in the UV-visible spectrum of (A) Disperse Blue 56, (B) Disperse Orange 30, (C) Disperse Yellow 42, and (D) Basic Yellow 28 after SFS (25g/L) treatment in
water/acetone (1:1) medium.
In addition, several commercial fabrics were decolorized using SFS in water/acetone (1:1) solution. Kebelka-Munk (K/S) values were measured to characterize color remaining on treated fabrics. In these examples, the treated fabrics possessed only a faint amount of their original color. The color value of each sample was measured before and after treatment, the results of which are summarized in Table 6. The untreated samples were all deeply dyed, which
0 0.5 1 1.5 2 2.5
330 430 530 630 730
Ab so rb an ce Wavelength
0 min 30 min
0 0.5 1 1.5 2 2.5
330 430 530 630 730
Ab so rb an ce Wavelength
0 min 30 min
0 0.5 1 1.5 2 2.5
330 430 530 630 730
Ab so rb an ce Wavelength
0 min 30 min
0 0.5 1 1.5 2 2.5 3
330 430 530 630 730
Ab so rb an ce Wavelength
was reflected in their high K/S values, except for the grey sample. Dyes used for the commercial fabrics were not revealed to us. Results from decolorization of the commercial fabrics were coincident with that from decolorization of disperse dye solutions. After treatment, their colors were reduced dramatically and only a small amount of color remained on the fabric, as shown in Figure 28. The fluorescent yellow sample became slightly grey after SFS reduction. The grey and blue fabrics samples possessed a beige tint. The black fabric was also well decolorized, becoming off-white. Decolorization of the red sample was somewhat less effective than the others, with a red stain left on the treated fabric. The green sample was decolorized efficiently, becoming nearly white.
Table 6. K/S values of commercial PET fabrics before and after SFS (40g/L) treatment in acetone/water (1:1) at 100°C.
Fabric Color K/S Values
Before Treatment After Treatment
Yellow 53.6 1.6
Grey 13.2 1.6
Blue 41.8 2.5
Black 532.6 6.1
Red 240.6 2.8
Green 220.7 1.9
Figure 28. Commercial PET fabrics before and after SFS (40g/L) treatment in acetone/water (1:1) at 100°C.
2.7.1 Effect of treatment conditions on fabric decolorization
2.7.1.1 Treatment time
Having confirmed that disperse dyes could be decolorized by SFS in solution and in PET fibers, the next set of experiments pertained to optimizing the decolorization process using a commercial garment fabric. Figure -(a) shows the effects of SFS treatment time on K/S values of the commercial black fabric, over the 5-60 min timeframe, and Figure 30-(a) shows samples of the treated PET fabrics themselves. It can be seen that longer treatment time gives better decolorization performance. To help establish the lower limit of the treatment time, 5 min and 10 min SFS treatment were considered. However, from the K/S values, it is clear that more
Before After
Before After Before After
Before After
Before After Before After
Yellow Grey Blue
color persisted at both time intervals. In general, the sample treated for 30 min appears to have a comparable decolorization level to the one treated for 60 min.
2.7.1.2 Water to acetone ratio
The treatment procedure was the same as used to investigate the effects of treatment time, except for using baths of different water to acetone ratios, and the temperature was lowered to 110oC. If the reaction vessel was heated to 120oC, the pressure inside beaker led to significant bumping. With this in mind, the treatment temperature was lowered to 110oC.
The effects of water to acetone ratio on the depth of shade (K/S) of decolorized polyester fabric are illustrated in Figure -(b) and Figure 30-(b). The results show that decolorization took place in all media but higher ratios of water to acetone (4:1 and 3:1) had a negative effect on decolorization efficiency. It can be concluded that the higher proportion of water is unfavorable for the extraction of sparingly water soluble disperse dyes from PET fabric to the reducing medium. However, significantly increasing the amount of organic solvent (acetone) reduced decolorization efficiency as well. This is because SFS is soluble in water, but not in acetone. Solubility of reducing agent decreases as acetone content increases, which results in a decrease in decolorization performance. In summary, the most acceptable decolorization resulted when the ratio of water to acetone was 1 to 2.
2.7.1.3 SFS concentration
was reduced by increasing the amount of reducing agent. Then K/S increased as SFS concentration increased further, and reached a peak at 30g/L. Subsequently, K/S value dropped back to a low level when SFS concentration was increased to 40g/L. These results suggest the conversion of initially uncolored products or intermediates to secondary colors followed by secondary color degradation. A large excess of SFS (40g/L or more) does not improve dye degradation. Sufficient decolorization performance can be achieved with concentrations as low as 10 g/L.
2.7.1.4 Temperature
2.7.1.5 Liquor ratio
Figure 29. Effect of (a) treatment time, (b) water to acetone ratio, (c) SFS concentration, (d) Temperature, and (e) liquor ratio on K/S value of black commercial fabrics after
decolorization.
(a)
(b)
Temperature=120°C Water: acetone=1:1 [SFS]=40g/L
Liquor ratio=50:1
Temperature=110°C Time=30min
Figure 29 (continued).
(c)
(d)
Temperature=110°C Water: acetone=1:2 Time=30min
Liquor ratio=50:1
Time=30min
Water: acetone=1:2 [SFS]=10g/L
Figure 29 (continued).
(e)
Temperature=100°C Water: acetone=1:2 [SFS]=10g/L
(a)
(b)
Figure 30. Visualized effect of (a) treatment time, (b) water to acetone ratio, (c) SFS concentration, (d) Temperature, and (e) liquor ratio on K/S value of black commercial fabrics
after decolorization.
5
10 15
20 30
40
50
60
(c)
(d)
(e)
Figure 30 (continued).
g/L
5
10
15
20
25
30
35
40
80 ˚C
90 ˚C
100 ˚C
110 ˚C
2.7.2 Fabric strength assessment
To determine whether fiber degradation occurred when dye PET fabrics were subjected to SFS decolorization at elevated temperature, intrinsic viscosity was measured using an Ubbelohde viscometer and viscosity-average molecular weight was calculated using the Mark-Houwink equation:
[η] = 3.72×10⁻⁴ M0.73
In this investigation, the control was untreated 100% PET warp knit fabric, while the test samples were decolorized PET fabrics that had been dyed by C.I Disperse Orange 30 and C.I Disperse Blue 60. Intrinsic viscosity and molecular weight results from these three fabrics are recorded in Table 7, where it can be seen that these properties were essentially unchanged. Although this analysis did not provide information pertaining to the shapes of the molecular weight distribution, it gave us a general indication that degradation of PET fibers did not occur during SFS treatment.
Table 7. Intrinsic viscosity (IV) Vs viscosity-average molecular weight for control PET fabric and PET fabric after SFS (40g/L) treatment in acetone/water (1:1) at 100 ˚C.
Fabric IV (dL/g) MW
Untreated 0.50 19,400
Decolorized Orange 30 0.50 19,300
2.7.3 Conclusions from preliminary study
3. PRESENT RESEARCH
3.1 Objectives
The present work had following objectives:
(1) Study the recyclability of the decolorization bath and the decolorized fabrics. Solvent-based decolorization bath should be recovered and reused in order to reduce the effluent emission. Decolorized fabrics should be re-dyed as virgin PET fabrics with acceptable color differences.
(2) Characterize the dye compounds in commercial fabrics by UV-vis, TLC, HPLC, and MS.
(3) Investigate the toxicity of the decolorized solution. Azo, anthraquinone, and nitro disperse dyes are decolorized by SFS, and the toxicity data of the remaining solution should be obtained.
(4) Conduct a life cycle assessment of the closed loop recycling process, and compare with the life cycle assessment impacts of virgin PET production system.
3.2 Rational
4. REUSE OF DECOLORIZATION BATH AND DECOLORIZED FABRICS
4.1 Introduction
The worldwide production of polyethylene terephthalate (PET) was around 49 million tons in 2008, havingovertaken cotton since 2002, and a majority (79%) of the PET produced was used in the textile industry 82,83. PET fabrics are extensively used in a wide variety of apparel, home furnishings and automotive products, which find their way to landfills at the end of their useful life84. As a semicrystalline thermoplastic polyester, PET has high mechanical strength and low permeability to gases, which means it has high resistance to atmospheric and biological agents 13. Disposing the slowly degradable PET fabrics in landfills is creating a significant environmental concern 85. In addition, the manufacture of PET is an energy-intensive process, requiring large amounts of crude oil 86. Thus, a one-time use of PET fabric can be regarded as a waste of a valuable polymer derived from non-renewable petroleum resources. Although a fraction of PET bottles are recycled 88, the technology needed to reuse the PET fabrics is limited.
While solvent extraction methods can be used to remove dyes from textiles, the dye concentration inside and outside the fibers will eventually reach a thermodynamic equilibrium. In another words, extraction cannot make the textiles fully colorless, without removing the dyes from the solvent medium continuously. Physical methods, including adsorption using granular activated carbon 98 and membrane filtration99, chemical methods such as bleaching 100, ozonation 101 and Fenton oxidation102, and biological methods 103 have been reported for decolorizing dyes from textile wastewater but normally not from dyed textiles.
The presence of colorful dyes makes PET fabric attractive, but brings about challenges when it comes to recycling. With this in mind, a decolorization method was developed in our previous studies to remove disperse dyes from PET fabric for enhanced recyclability. Sodium formaldehyde sulfoxylate (SFS) was employed as the reducing agent to help remove disperse dyes. The decolorization process was carried out in water/acetone mixture solution since disperse dyes are hydrophobic and cannot be substantially extracted using water as the only solvent. Elevated temperature is required to increase desorption of the dyes by reducing cohesion between polymer chains. The decolorization behavior is strongly influenced by SFS concentration, treatment time, and liquor ratio. By considering the decolorization performance as well as the cost effectiveness, the optimized procedure was found to be water/acetone media (v/v=1:2) at elevated temperature (100˚C) with the liquor ratio of 50:1 using SFS (10g/L) for 30 min. This method was effective for decolorizing a variety range of colorants104.
the re-dyeability of decolorized PET fabrics was assessed. Dyes used in this study included those listed in Table 8.
Table 8. C.I. names, classes, and structures of dyes used in this study.
Color Index Name Chemical Class Molecular Structure
Disperse Orange 30 Azo
Disperse Blue 79 Azo
Disperse Yellow 42 Nitro
Disperse Red 60 Anthraquinone
4.2 Experimental
4.2.1 Material
Dyed commercial polyester knit leisure wear and white cationic dyeable polyester fabric were kindly donated by Nike, Inc. (Beaverton, OR, USA). Reducing agent sodium formaldehyde sulfoxylate dihydrate (SFS) was purchased from Arcos Organics, and HPLC grade acetone was purchased from Fisher Scientific. The disperse dyes and dyeing auxiliaries were obtained from our internal pilot plant inventory. All chemicals were used without further purification.
Br
O2N N
NO2
N
HN
OC2H5
N(CH2CH2OCOCH3)2
COCH3
O
O NH2
OC6H5
4.2.2 Batch fraction distillation
After each fabric decolorization, the treatment bath (47~48 mL of acetone/water) was collected. Lab-scale fractional distillation apparatus was assembled (Figure 31). The bath was transferred to a 100-mL round-bottom flask containing a boiling stone. Heat was applied from a digital hot plate and maintained for a distillation rate of one drop per second. When the liquid stopped boiling, heat was removed and the distillate was re-used in decolorization experiments.
Figure 31. Diagram of experimental device for lab-scale fractional distillation. (1) Digital hot plate, (2) round-bottom flask, (3) condenser used as fractionating column, (4) two-way
adapter, and (5) condenser.
4.2.3 Application of disperse dyes to decolorized fabrics
reduction cleared using sodium dithionite (0.5 g/L) and sodium hydroxide (0.5 g/L), rinsed again with water, and allowed to air-dry.
4.2.4 Decolorization of laboratory-dyed fabrics using acetone distillate
The collected acetone distillate from section 4.2.2 was used to decolorize cationic dyeable PET fabrics that were dyed using Disperse Blue 79, Disperse Yellow 42, and Disperse Red 60 at 1% (o.w.f.). Water and distilled acetone were mixed at the ratio of 1:2. For each run, 1 g of fabric was treated in 50 mL of the solvent medium. SFS (0.5 g) was used as the reducing agent. The bath chamber was sealed and heated to 100 ˚C at rate of 4°C/min, and held for 30 min. The bath was cooled, and fabrics were removed, rinsed with running tap water for 2 min, and allowed to air-dry.
4.2.5 Color evaluation
A calibrated Datacolor Spectraflash 600X Reflectance Spectrophotometer equipped with iMatch software from X-Rite was used to determine the K/S and Whiteness Index values of the PET fabrics. The software was set to use illuminant D65 with the UV light included, and the CIE 10-degree supplemental standard observer. The sample being tested was folded twice and measured two times by rotating the sample at 90 degrees between measurements. The average value was recorded. The K/S value of each sample was calculated by adding the K/S value of each 10 nm from 400 nm to 700 nm as follows:
𝑆𝑢𝑚(𝐾/𝑆) = - (𝐾/𝑆). ./011
4.2.6 Fabric strength evaluation
Burst pressure measurements were performed with a diaphragm bursting tester TruBurst Model 810 machine on commercial black fabrics and decolorized commercial fabrics. Fabrics tested were clamped over a rubber diaphragm by means of an annular clamping ring. Increasing pressure was applied until each fabric failed or the machine reached its limit, and the corresponding pressure was recorded.
4.3 Results and discussion
4.3.1 Solvent recovery and reuse
The decolorization method worked best in an aqueous medium containing acetone due to the hydrophobicity of disperse dyes. Although acetone has been removed from the Toxic Release Inventory (TRI) 105, its discharge into wastewater would still need to be addressed appropriately since acetone is extremely flammable 106. This aspect of the study explored the recovery and reuse of acetone by distilling it from an aqueous mixture to save cost as well as increase sustainability. A condenser was used as a fractionating column. Table 9 lists the yields of recovered acetone from a set of 5 experiments, which shows that 73-90% recovery occurred. The average acetone recovery percentage was 82.0%, as shown in Table 9.
Table 9. Acetone recovery percentage from lab-scale fractional distillation. Batch Decolorization bath
(Water/Acetone=1:2; mL)
Acetone Distillate (mL)
Recovery Percentage
#1 45 27 90.0%
#2 45 24 80.0%
#3 46 27.5 89.7%
#4 43 22 76.7%
#5 47 23 73.4%
The recovered acetone was used to decolorize PET fabrics again. Decolorization performance in recovered and virgin acetone were compared, which was characterized by K/S values. Table 10 results show that the K/S values dropped significantly after SFS decolorization. The difference between the K/S values of PET decolorized in virgin and recovered aqueous acetone are negligible, which means the distillate from fractional distillation can be readily reused. In the case of SFS decolorization, the organic solvent is not required to be extremely pure since it will eventually be mixed with water in the decolorization process.
Table 10. K/S values from lab-dyed cationic dyeable PET fabrics using virgin and recovered acetone for SFS (40g/L) decolorization in water/acetone (1:2) at 100 °C.
Dyes and Shade Depths Used
K/S Values Before
decolorization Virgin Acetone
Recovered Acetone
Disperse Red 60, 1.0% (owf) 48.33 0.24 0.27
Disperse Blue 79, 1.0% (owf) 81.02 1.12 1.04
Disperse Yellow 42, 1.0% (owf) 16.80 0.22 0.30
4.3.2 Re-dyeing decolorized cationic dyeable PET