Laboratory for Quantum Magnetism, EPF Lausanne, Switzerland
3Laboratory for Development and Methods, Paul Scherrer Institute, Villigen PSI, Switzerland 4Toyota Central Research and Development Laboratories, Inc., Nagakute, Aichi, Japan 5Comprehensive Research Organisation for Science and Society, Tokai, Ibaraki, Japan 6Laboratory for Solid State Physics, ETH Z¨urich, Z¨urich, Switzerland
7Institut Laue-Langevin, Grenoble, France
Abstract. The layered transition-metal oxide NaxCoO2has been studied extensively both for its correlated electronic properties
as well as for potential battery applications. It was discovered that high-temperature Na ion vacancy order and dynamics can be very useful to tailor low-temperature properties of members of this compound family. We have studied the Na-ion dynamics on the atomic length-scale in the Na0.7CoO2compound by neutron spectroscopy. The temperature dependence of both the elastic
and the inelastic intensities show steps at TA≈290 K and TB≈400 K. At TAthe step is shown to be connected to low energy
phonons, while at TB the Na ion diffusion suddenly gets fast enough, and the characteristic signal of quasielastic scattering
appears. The current results further elucidate the subtle changes in the Na ion dynamics that have been revealed in our previous neutron diffraction studies [1], intimately connecting structural transformations at TA and TBwith the opening-up of 1D and
2D Na-ion diffusion paths. Finally, the estimated diffusion coefficient above TBwas found to differ from the one measured by
muon-spin relaxation (µ+SR) [2] by about four orders of magnitude. However it might be that the present QENS data rather describe a fast localized prozess than a long range translational diffusion. Within this model the corresponding time scale (/E)
would be in the order of 50 ps.
1. Introduction
The fast development of rechargeable lithium-ion batteries is clearly one of the biggest success stories for modern electrochemistry. However, recently the future for Li-ion technology has been questioned due to the limited re-sources of lithium metal along with its large negative envi-ronmental impact and high cost during extraction from the earth’s crust. As a result, possible replacement candidates based on sodium, that is much more abundant than lithium, are becoming more and more interesting for battery re-searchers [3]. In that context, the NaxCoO2compound is in many ways the Na-analog of the most common Li-ion bat-tery electrode LixCoO2. But, in addition, NaxCoO2is also interesting on its own right. It has a rich phase-diagram displaying superconducting, magnetic, as well as thermo-electric phases that strongly depend on the Na-content (x). Furthermore, the potential landscape from ordered Na-vacancies [4,5] as well as room-temperature Na-dynamics [6,7] have been shown to play a very important role in the formation of the ground state of this material. This has opened up intriguing possibilities for tuning fundamental physical properties [8] by controlling the dynamic processes and through that the self-assembling structure on a sub-nanoscale. Consequently, for both, applied as well
ae-mail:[email protected]
as fundamental sciences, it is very important to understand the Na-diffusion mechanism of the NaxCoO2compound.
Structurally, NaxCoO2 consists of alternating Na and CoO2 layers. Within one unit cell Na can be located at one of the two crystallographic nonequivalent positions: either at Na1, located below and above the Co sites, or at Na2, located at the center of a Co trigonal prism [9]. For certain x values (e.g. x =1/3,1/2 and 0.7) Na ions self-assemble into long-range ordered stable patterns [10], which is recognizable by weak superstructure peaks in the diffraction pattern. In addition, Na ions can rearrange at different temperatures, or undergo an order/disorder transition [11,12].
2. Experimental
Polycrystalline samples of Na0.7CoO2 were prepared at the Paul Scherrer Institute (PSI), Switzerland as described in the Supplementary Material of Medarde et al. [1] according to the “rapid heat-up” technique proposed by Motohashi and co-workers [13]. The appropriated amounts of the starting materials Na2CO3 and Co3O4 (99.99% purity) were put into a pre-heated furnace (790◦C), held 15 h and cooled down to room temperature at 300◦C/h. This procedure was repeated twice. The resulting material was immediately removed from the furnace and stored in an He-filled glove box. Neutron diffraction revealed the
This is an Open Access article distributed under the terms of theCreative Commons Attribution License 4.0, which permits unrestricted use, distribution,
Figure 1. Elastic FWS of two different Na0.7CoO2 samples
measured at IN16 (ILL). Counts from all detectors have been integrated (Q-range of 0.43 to 1.92 ˚A−1). Arrows indicate the phase transition temperatures, which were found previously by means of neutron diffraction [1]. At about these temperatures changes in the spectra are observable. At 0.5 K/min cooling rate the slope of the curve changes at both TA and TB, while at
0.05 K/min cooling rate two separate processes (two steps) are indicated by the plateau above 300 K.
existence of a very small amount of Na2CO3(<0.5% in weight). For the experiments the samples were enclosed in cylindrical, aluminum sample holders and sealed with lead. Elastic fixed window scans (FWS) were performed to get an overview about the dynamics in the system as a function of temperature. In this type of measurement the intensity of the elastically scattered neutrons is measured. This signal is proportional to the portion of static scatterers in the material. Particles which are moving too slow in comparison with the observation time of the spectrometer contribute also to this signal. When the intensity of the elastically scattered neutrons decreases due to thermally activated motion, there is an increase of the neutron scattering intensity at non-zero energy transfer E. If the motion is diffusive, as expected for Na in NaxCoO2(from the diffraction experiment) [1], the quasielastic intensity increases. Therefore, also inelastic FWS were performed at low energy transfer.
The elastic FWS measurements (see Sect. 3.1) have been carried out at the IN16 backscattering spectrometer at the Institute Laue-Langevin (ILL), France with an energy resolution of 0.9µeV. The incident and final neutron wavelength was 6.27 ˚A, corresponding to the backscattering position of the Si analyzer using the (111) reflection. Data has been taken during cooling using a constant temperature rate of 0.5 or 0.05 K/min. At some temperatures complete energy spectra (±15µeV) were also recorded (see Sect.3.2) using the Doppler drive for the monochromator.
For inelastic FWS (see Sect.3.1) the high-resolution inverted time-of-flight (ToF) spectrometer MARS at PSI was used with an energy resolution of ≈13µeV. At characteristic temperatures, i.e., below and above the phase transitions, significantly longer counting time (1– 1.5 day per temperature) allowed for spectral analysis (see Sect. 3.2). Spectra were measured during heating.
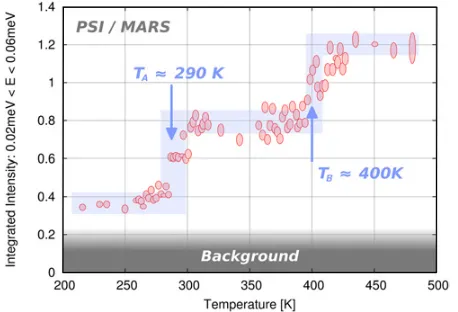
Figure 2. Inelastic FWS (merging several data sets) of
Na0.7CoO2measured at MARS at PSI. Data are integrated over
an energy range of 20 to 60µeV. Steps in the FWS at≈TA
and TB are clearly observable. The blue area is a guide to the
eye. Background level is marked by the gray area. The vertical extension of the points corresponds to the statistical error (the different accuracy is caused by different counting times).
At MARS the scattered neutrons having a wavelength of 6.61 ˚A were filtered by a mica analyzer using the (006) reflection. For the inelastic FWS, part of the spectra was integrated (between 20 and 60µeV).
The phonon density of states (PDOS, see Sect.3.3) was measured at the ToF spectrometer FOCUS at PSI using an incident wavelength of λi =4.5 ˚A and energy resolution
of E =140µeV (at the elastic line). Measurements were performed below and above the phase transitions temperatures TA and TB. Counting times were about 12 hours for each spectrum. The aluminum sample container contributed significantly to the measured signal between 15 and ≈50 meV. Consequently, the empty container has been measured at the same temperatures with similar statistical accuracy as the sample itself to minimize the signal-to-noise ratio after background subtraction. In all experiments vanadium has been used to determine the energy resolution and to correct for the detector efficiency.
3. Results
3.1. Overview of the dynamics: Elastic and inelastic fixed window scans
Figure 3. Quasielastic neutron scattering observed above TBat
the spectrometer MARS at PSI. Intensity of all detectors are integrated. The gray and red areas show the instrument resolution and the QENS signal, respectively.
Figure 4. Energy spectrum of Na0.7CoO2measured at 450 K at
MARS at PSI. Vertical line shows the cut-off of the resolution function used in the convolution. Data at Q=0.95 ˚A−1is shown, which is the most relevant regarding the type of the motion and the value of the diffusion coefficient. Solid and dotted lines represent two acceptable, model free fit of one Lorentzian. The parameters suggest long range translational or localized motion, respectively (see Fig.5). Although the overallχ2is slightly (7%)
higher for the long range translational diffusion, the data quality allows both possibilities.
on the same instrument at several temperatures between 255 and 340 K. Unfortunately the total inelastic signal was only 10% above the background level, so a step in the integrated inelastic scattering is hardly visible. Contrary, at MARS the inelastic FWS showed clear steps around TA and TB(see Fig.2).
3.2. Na+diffusion: Quasielastic neutron Scattering
The energy spectra collected at MARS show clear Quasielastic neutron Scattering (QENS) signal above TB
Figure 5. Width of the fitted Lorentzian function describing
diffusion of Na in Na0.7CoO2 at 450 K. Local fit minima with
similarχ2over a large range of HWHM values are indicated by
the red bars. The best fits (smallestχ2) are shown by the red
points. At Q = 0.95 ˚A−1two acceptable fit results are plotted, which corresponds to two possible diffusion models: long range translational and a localized diffusion. Fickian diffusion with extreme values of DNa=1e−9 and 1e−10 m2/s are shown.
Line broadening corresponds to 50 ps relaxation time is also shown.
(see Fig. 3). The spectra at 280 and at 300 K can be well fitted by a delta function at E =0 and a constant background, convoluted by the instrument resolution.
The QENS signal at 420 and 450 K can be fitted by an elastic line, one Lorentzian and constant background (see Fig.4):
S(Q,E)model = A0(Q)×δ(E)+A1(Q)
×π(Q)(Q)2 +
E2 +bg
where (Q) is the Q dependent line width of the Lorentzian (HWHM). S(Q,E)model was numerically
convoluted with the measured instrument resolution. Above TB a 2D isotropic diffusion on a hexagonal lattice is expected [1]. The two nonequivalent Na sites (Na1 and Na2), with different occupations, should be taken into account together with site blocking effects. Furthermore, since powder sample is used, the model function has to be averaged over all possible particle orientations. A similar model was developed for the diffusion of hydrogen in potassium-intercalated graphite [14].
In our case the fitted line width of a single Lorentzian is only roughly twice as broad as the instrument resolution, therefore the 2D behavior (which is manifested in a singularity at zero energy transfer) can not be resolved [15]. The model function under this circumstances can be approximated by a delta function (i.e. apparent increase of the height of the elastic line), and one Lorentzian (like if it would be a 3D motion, but the obtained 3D diffusion coefficient is 2/3 of the real 2D one). Fitting two components for the two different Na sites would lead to an increased number of free parameters and would overdescribe the data.
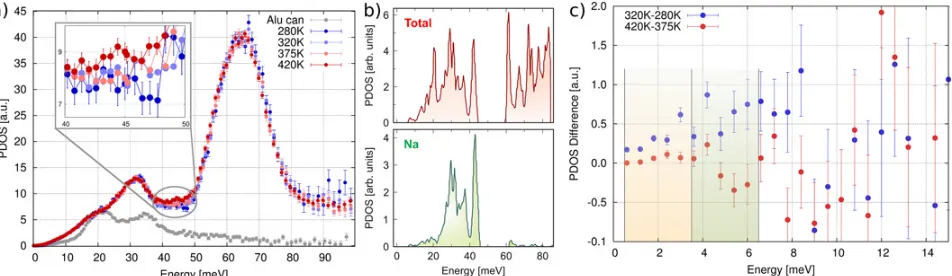
Figure 6. a) PDOS of Na0.7CoO2around the transition temperatures, measured at the spectrometer FOCUS at PSI. Small changes in the
Na PDOS are observed at TAand TB. b) Calculated PDOS (redrawn after [16]). c) Differences in PDOS across the transitions. PDOS at
low energies increases at TA, while remains unchanged by crossing TB.
the line width, depend strongly on the starting parameters. Therefore many starting configurations have been probed manually to obtain a bestχ2 vs. HWHM curve for all Q values. Points at Fig.5 are indicating the broadening for which the lowestχ2 was found, whereas the red bars the range, where the best found χ2 was not more than 2% higher than the minimum. The line broadening seems to be more or less independent of Q, which is a sign for localized motion. The corresponding area of the Lorentzian is smaller for the first two Q values, which further support this interpretation. On the other hand, if the fit is started with an area similar to the ones at high Q, the obtained line broadening (marked with “translational” at Fig.5) is significantly reduced. In doing so the corresponding χ2 is only 7% higher than the minimum. Also the residuals are similar for both fits (see Fig.4), and the fitted curves are very close to each other compared to the scattering of the experimental data points. The data quality for the lowest Q is even worse due to either smaller area or smaller broadening, therefore we have to conclude that the observed QENS signal can be caused either by a long range translational diffusion or by a localized motion.
In the first case we can estimate the magnitude of the diffusion coefficient DNa as 5×10⁻¹⁰m2s−1, which is valid for both 420 and 450 K. The limiting slopes of 1× 10⁻¹⁰ and 1×10⁻⁹m2s−1 in the Fickian approximation are plotted on Fig. 5. This estimated DNa differs four orders of magnitude from the results of our muon-spin relaxation (µ+SR) spectroscopy experiments, where DNa was found to be 3.80×10⁻¹⁰cm2s−1 [2] at a similar temperature. If some kind of localized motion is assumed, the characteristic relaxation timeτ = /E is in the order
of 50 ps.
3.3. Phonons: Inelastic neutron scattering
PDOS was measured at various temperatures to complete the picture of Na+dynamics across the phase transitions: at 280 K (below TA), at 320 and 375 K (between TA and
TB) and at 420 K (above TB). The spectra show a small temperature dependency (see Fig. 6). The two spectra at 320 and 375 K are statistically identical. In the 3 different phases differences are visible between 30 and 50 meV.
These changes are clearly associated with Na vibrations based on the calculated (and neutron weighted) phonon spectra published by Jha et al. [16] (see Fig.6). They also calculated the partial PDOS for both Na1 and Na2 sites. The small changes in the shape are not resolvable with the energy resolution of the instrument. But a small shift of the PDOS is expected for higher Na2 occupation with increasing temperature [1]. We observe higher intensity at higher energies in agreement with the expectation. Na-site occupancy is, however, only one aspect beside the changes in atomic distances and bond angles at TA and TB. We speculate that the observed changes are rather connected to structural changes than to site occupation.
We can additionally see a tiny increase at energies below ≈5 meV at crossing TA (see Fig. 6) (at higher energies the statistical accuracy is not sufficient to detect such small changes). Probably this enhancement is observed as a step both in the elastic and inelastic FWS spectra (see Sect.3.1).
Voneshen et al. [17] calculated significantly higher PDOS between ≈5 and 20 meV for Na0.8CoO2 if Na forms superstructure in comparison to the parent compound Na CoO2. They attributed this excess intensity to a low energy rattling mode, and its coupling to other low energy modes. In this energy range we could not detect any changes, and hence, no sign of different Na ordering in the different structural phases was found.
4. Discussion and conclusions
the observed motion above TB is at the detection limit. Furthermore, µ+SR is model dependent. Although the low Q part of QENS data is model independent (Fickian limit), the data quality is bad. This gives some uncertainties in both cases, but the values definitely differ by magnitudes. In case of LixCoO2, the diffusion coefficients measured by means of nuclear magnetic resonance (NMR) spectroscopy at 400 K are about 4 magnitude less than calculated values [18], while the values obtained fromµ+SR at 300 K agree well with the corresponding calculated values [18]. These discrepancies in the diffusion coefficients indicate that the Na+motion is more complex than thought. One realistic possibility is the presence of a second, fast localized type of motion beside the long range translational diffusion. If the QENS data is described by such type of motion, a relaxation time in the order of 50 ps can be obtained.
This work is based on experiments performed at the MARS and FOCUS spectrometers at the Swiss spallation neutron source SINQ, Paul Scherrer Institute, Villigen, Switzerland and at the IN16 spectrometer at the Institute Laue Langevin, Grenoble, France. JS was supported by MEXT KAKENHI Grant No. 23108003 and JSPS KAKENHI Grant No. 26286084.
[5] D. J. P. Morris et al.: Phys. Rev. B 79 (2009) 100103. [6] T. F. Schulze et al., Phys. Rev. Lett. 100 026407
(2008)
[7] M. Weller et al., Phys. Rev. Lett. 102 056401 (2009) [8] M.-H. Julien et al., Phys. Rev. Lett. 100 096405
(2008)
[9] Y. Wang, Y. Ding and J. Ni, J. Phys.: Cond. Mat. 21 035401 (2009)
[10] H. W. Zandbergen et al., Phys. Rev. B. 70 024101 (2004)
[11] Y. Hinuma, Y.S. Meng, G. Ceder, Phys. Rev. B 77 224111 (2008)
[12] D. Igarashi,Y. Miyazaki, T. Kajitani, K. Yubuta, Phys. Rev. B 78 184112 (2008)
[13] T. Motohashi et al., Appl. Phys. Lett. 79, 1480 (2001) [14] J. Purewal et al., J. Chem. Phys. 137 224704 (2012); http://thesis.library.caltech.edu/5574/ 7/Purewal Thesis Ch5.pdf
[15] R. E. Lechner, Solid State Ionics 77 280-286 (1995) [16] P.K. Jha et al., Physica B 366, 153 (2005)
[17] D. J. Voneshen et al., Nature Materials 12, 1028-1032 (2013)