Comparative vertebrate genomic sequence analysis studies based on Fugu rubripes
Marc Robert Michel Botcherby M.Sc.
A thesis submitted to the University of London for the degree of
Doctor of Philosophy
Department of Molecular Genetics Institute of Ophthalmology University College London
University of London Bath Street London ECIV 9EL
ProQuest Number: U643460
All rights reserved
INFORMATION TO ALL USERS
The quality of this reproduction is dependent upon the quality of the copy submitted.
In the unlikely event that the author did not send a complete manuscript and there are missing pages, these will be noted. Also, if material had to be removed,
a note will indicate the deletion.
uest.
ProQuest U643460
Published by ProQuest LLC(2016). Copyright of the Dissertation is held by the Author.
All rights reserved.
This work is protected against unauthorized copying under Title 17, United States Code. Microform Edition © ProQuest LLC.
ProQuest LLC
789 East Eisenhower Parkway P.O. Box 1346
Abstract
This thesis explores the benefits of the comparative analysis of genomic DNA sequence in three vertebrate species: man, mouse and Fugu rubripes.
The first region studied is the interval around Fibroblast Growth Factor 2 (FGF2). It falls within the candidate mapping interval for Insulin Dependent Diabetes 3 (Idd3) in mouse, in which Spermatogenesis Associated Factor (SPAF), Fibroblast Growth Factor 2 (FGF2) along with NUDT4 (formerly known as the antisense of FGF2, GFG) and a Centrin related sequence are known to be present. The Ensembl entry for the human draft
sequence only contains FGF2. A Fugu cosmid was sequenced to 99.99% accuracy and is shown to contain orthologues to SPAF, FGF2, NUDT4 and a Centrin gene, as well as a novel gene prediction (vader), evolutionarily conserved in mouse and man. Comparison to the available mouse and human genomic sequences indicates the presence of SPAF, FGF2, NUDT4 and a Centrin gene in both the mouse and human FGF2 genomic regions. The second area of study is the conventional Protein Kinase C family (cPKC), which comprises 4 isoenzymes in man: a , p i, P2, and y. A number of approaches are taken to identify the Fugu cPKC homologues: genomic library screening by hybridisation, sequence scanning. Southern Blotting and degenerate PCR. A PKC a orthologue is identified and evidence for the existence of two further P homologues found. These genes are compared to the PKCs found in other species by means of phylogenetic trees. Two overlapping cosmids containing the PKCa orthologue are identified, sequenced to 99.99% accuracy and analysed. Potential regulatory elements are identified. A calcium channel subunit gene (CACNG5) is also found close to Fugu PRKCA, which reflects an association between all cPKCs and CACNG genes. This is interesting both from an evolutionary point of view and in the light of the association between cPKCs and Retinitis pigmentosa.
Declaration
I declare that this thesis submitted for the degree of Doctor of Philosophy is my own composition and save as otherwise stated the data presented herein is my own original work.
Acknowledgements
I would like to thank the succession of people who have, in turn, acted as my supervisors, at the Institute of Ophthalmology, Prof. Shomi Bhattacharya, Dr Mai Al-Maghteth and eventually Dr Eranga Vithana, and at the HGMP Resource Centre, Dr Chris Mundy, then Dr Melody Clark and finally. Dr Greg Elgar. I would like to also thank Drs Sarah Smith and Melody Clark for their support and advice during my period of research and for their constructive criticism of the thesis.
I would also like to thank my colleagues at the HGMP-RC for their support and
understanding as, although this PhD was conducted in my spare time and it always came second to my work, it most certainly has impacted on the investment, both in terms of time and intellectual input, I have been able to made to my job.
L’homme n ’est qu’un roseau, le plus faible de la nature; mais c’est un roseau pensant. Il ne faut pas que l’univers entier s’arme pour l’écraser: une vapeur, une goutte d’eau suffît pour le tuer. Mais quand l’univers l’écraserait, l’homme serait encore plus noble que ce qui le tue, puisqu’il sait qu’il meurt, et l’avantage que l’univers a sur lui, l’univers n’en sait rien.
Man is only a reed, the weakest thing in nature, but he is a thinking reed. The entire universe need not take up arms to crush him: a humor, a drop of water is enough to kill him. But should the universe crush him, man would be even nobler than what kills him, since he knows he is dying and, of the advantage that the universe has over him, the universe knows nothing.
TABLE OF CONTENTS
List of figures and tables List of abbreviations
INTRODUCTION... 1
1-The Human Genome Project (HGP)... 2
1-1 Mapping the genome... 2
1-1-1 The human genetic man... 2
1-1-2 The human physical man... 4
1-2 Sequencing the genome... 5
1-2-1 Four different sequencing approaches... 7
1-2-1-1 Sequencing cDNAs... 7
1-2-1-2 Sequence scanning of genomic clones... 8
1-2-1-3 Full length sequencing from genomic clones... 9
1 -2-1 -4 Whole Genome Shotgun... 10
1-3 The sequence of the human genome... 11
2 - Making sense of the genome sequence... 15
2-1 The transcriptom e... 15
2-1-2 Gene prediction by sequence analysis... 15
2-1-2-1 Exon predictions... 16
2-1 -2-2 Homology searching... 17
2-1-3 Identifying genes by comparative sequence analysis... 19
2-1-3-1 The Fugu model... 20
2-1-3-2 The mouse model... 24
2-2 Gene regulation... 26
2-2-1 Access to the genome... 26
2-2-2 Transcription... 27
2-2-3 Identifying regulatory elements using bioinformatic tools 28 2-2-4 Identifying regulatory elements bv comparative sequence analysis 29 2-3 Understanding the function of genes... 31
3-W hat the future holds... 34
AIMS OF THE PR O JEC T... 36
1 - Analysis of a highly conserved region in Fugu, Mouse and Man 36 2- Study of a gene family... 36
3- Comparative analysis of conventional PKCs in Fugu and man... 37
Chapter 2: Materials and Methods... 38
2-1 : Isolation of cosmid DNA... 38
2-2: ProCipitate purification of cosmid DNA... 39
2-3 : Restriction digests... 39
2-4: Agarose gel electrophoresis... 40
2-5: Alkali transfer Southern blot... 40
2-6: DNA filter hybridisation... 42
2-7: Preparation of random cosmid DNA fi-agments for ligation into Ml 3 or pUC vector... 43
2-8: Ligation and transformation of somicated, end-repaired and size-selected cosmid fragments into vector... 44
2-9: DNA preparation from plasmids... 45
2-10: Sequencing plasmid DNA preparations... 47
2-10-1: Dye terminator sequencing using Big Dyes... 47
2-10-2: Dye primer sequencing using energy transfer (ET) chemistry.... 48
2-10-3: Use of automated sequencers... 49
2-11: Solutions... 50
Chapter Three: Analysis of a highly conserved genetic region in man, mouse and Fugu: FGF2 to SPAF (human 4q25-27)... 51
3-1 Introduction... 51
3-1-1 Genes mapping to the human region... 53
3-1-1-1 Centrin (Caltractin)... 53
3-1-1-2 Basic fibroblast growth factor (FGF2)... 56
3-1-1-3 GFG: antisense transcript of the basic fibroblast growth factor (FGF2)... 56
3-1-1-4 Spermatogenesis associated factor (SPAF)... 57
3-2 M aterials and methods... 58
3-2-1 Sequencing... 58
3-2-2 Sequence analysis... 59
3-2-3 Comparative sequence analysis... 60
3-3 Results... 60
3-3-1 Sequencing... 60
3-3-2 Genomic features of the Cosmid identified using the NIX program. 61 3-3-3 Comparative sequence analysis... 64
3-3-4 Percentage Identity analysis of the three species... 65
3-3-5 Comparison of the Centrin proteins... 68
3-3-6 Comparison of FGF2 proteins... 73
3-3-7 Comparison of the FGF2 antisense protein GFG... 76
3-3-8 Comparison of SPAF proteins... 80
3-3-9-1: Predicted gene 1... 84
3-3-9-2: Predicted gene 2... 86
3-3-9-3: Predicted gene 3... 87
3-3-10 Scanning the region for transcription factors... 93
3-4 Discussion... 96
Chapter Four: The search for conventional Protein Kinase C homologues 101 4-1 Introduction... 101
4-1-1 Protein Kinase C (PKC)... 101
4-1 -2 Evolution of conventional PKCs... 104
4-2 Screening of a genomic library bv hybridization... 109
4-2-1 Materials and methods... 109
4-2-1-1 Hybridisation screening... 109
4-2-1 -2 Confirmation of positive results by Southern blot hybridization... 109
4-2-2 Results... 110
4-2-2-1 Screening the Fugu genomic DNA library by hybridization 110 4-2-2-2 Confirmation by Southern blot... I l l 4-2-2-3 Screening of a cDNA library... 112
4-2-2-4 Discussion... 113
4-3 Sequence scanning experiment... 114
4-3-1 Materials and methods... 114
4-3-2 Results... 115
4-3-3 Discussion... 117
4-4 Screening the library for further positive cosmids... 118
4-4-1 Materials and methods... 118
4-4-2 Results... 118
4-4-3 Discussion... 122
4-5 Use of degenerate PCR to identify further PKCs... 124
4-5-1 Materials and methods... 124
4-5-2 Results... 126
4-5-3 Discussion...137
Chapter 5: Analysis of the Fugu PKCA genomic region... 143
5-1 Introduction... 143
5-2 Results... 144
5-2-1 Genomic sequence... 144
5-2-2 Assignment of the correct paralogues and comparison to whole genome shotgun assembly... 147
5-2-3 Comparative genomic sequence analysis... 162
5-2-3-1 Fugu PKCl gene... 164
5-2-3-2 Eukaryotic Initiation factor... 166
5-2-3-3 Drosophila salivary glue homologue... 168
5-2-3-4 Calcium channel gamma-5 unit (CACNG5)... 170
5-2-3-5 Cytohesin 3 ... 175
5-3 Discussion... 177
Chapter 6: General discussion and future prospects... 185
6-1 Discussion... 185
6-1-1 Comparative analysis of coding regions... 186
6-1 -1 -1 FGF2 syntenic region... 186
6-1-1-2 Distribution of conventional PKC family genes in Fugu rubripes 191 6-1-2 Comparative genomic sequence analysis and regulatory element identification... 198
6-2 Plans for further studies... 200
References:... 202
Appendixl: Submission file for genomic sequence of Cl96N09... 219
LIST OF FIGURES AND TABLES
Figure 3-1 : Alignment of the Centrin family proteins known to date... 55
Figure 3-2: Ethidium bromide stained 0.8% agarose gel of EcoRl (E) and Sacl(S) digests of cosmid 196N09... 61
Figure 3-3: Nix output for cosmid 196N09 displaying the results of exon predictions and Blast homology searches...62
Figure 3-4: Genomic features of cosmid 196N09...64
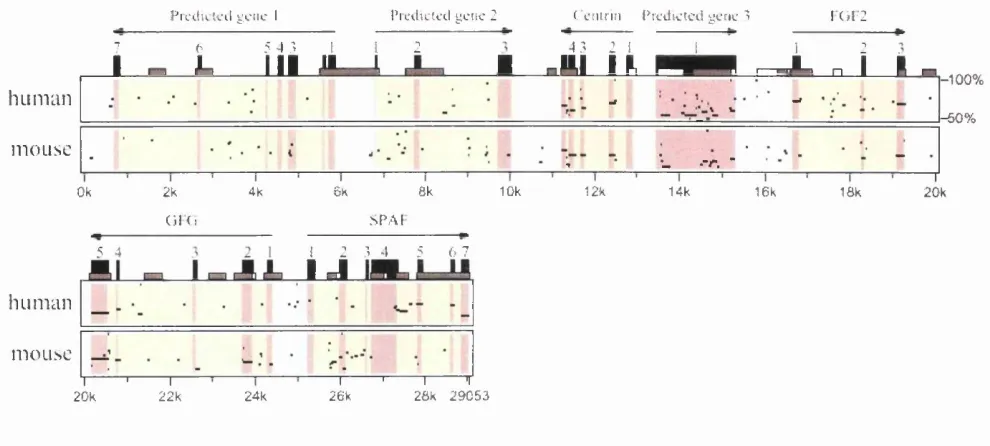
Figure 3-5: Percentage Identity Plot (PIP) comparing the sequence of Fugu cosmid 196N09 to the equivalent human and mouse draft sequences... 66
Figure 3-6: Genomic sequence of the Fugu centrin genomic sequence... 69
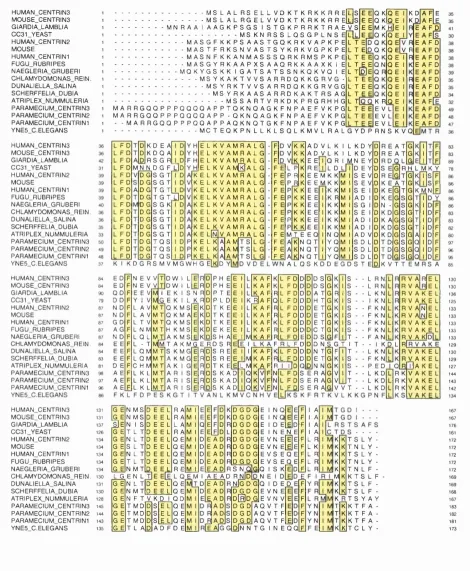
Figure3-7: Alignment of Human Centrin 2 (HsCETN2), the Fugu putative
Centrin {Fugu CEN), Human and Mouse Centrin 1 (HsCETNl and MusCETNl) and C.reinhardtii Centrin (CRCEN)... 70
Figure 3-8: Phylogénie tree of known Centrin proteins... 72
Figure 3-9: est2genome output aligning the mouse cDNA sequence to the Fugu genomic sequence for FGF2... 73
Figure 3-10: Genomic sequence of the Fugu FGF2 genomic sequence... 75
Figure 3-11 : Alignment of FGF2 protein for Man, Fugu rubripes and three strains on mice: A/J, C57black6 and 129... 76
Figure 3-12: Genomic sequence of the Fugu GFG genomic sequence... 77-78
Figure 3-13: Alignment of the human (AAH09842 - nudix (nucleoside diphosphate linked moiety x)-type motif 6), rat (GFG_RAT), Xenopus laevis (GFG_XENLA
and Fugu (ftigu_gfg) GFG sequences using clustalW... 79
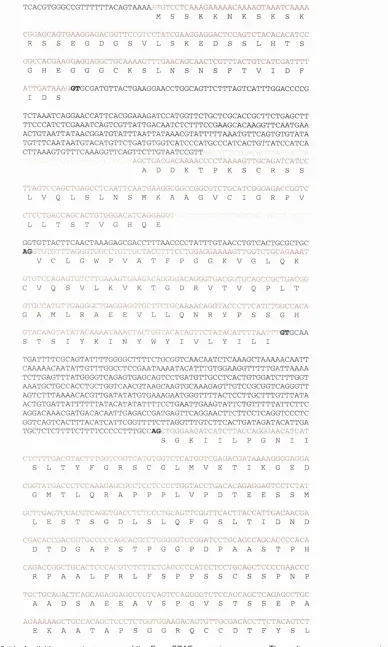
Figure 3-14: Available genomic sequence of the Fugu SPAF genomic sequence.. 82
Figure 3-15: Alignment of the predicted Fugu SPAF transcript to the mouse
amino acid sequence... 83
Figure 3-16: Depiction of the 6 kb region around the gene predicted by Genscan.. 84
Figure 3-18: Alignment of the protein predicted (gene prediction 3) from the Fugu sequence and its T.nigroviridis homologue... 90
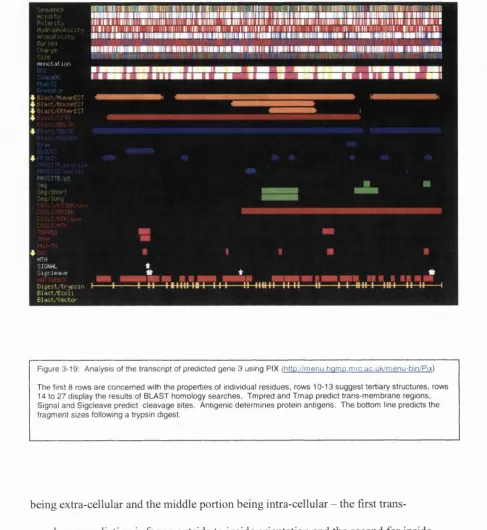
Figure 3-19: Analysis of the transcript of predicted gene 3 using F IX ...91
Figure 3-20: Graphical display showing the transcription factor binding sites predicted byrVista...94
Figure 4-1 : Domain structure of conventional PKC enzymes
(PK C a, p i, P2 andY)... 103
Figure 4-2: Relationship between PKC isotypes from mammalian and non
mammalian species based on the full-length amino acid sequences... 105
Figure 4-4: Restriction digest of the PKC-G positive cosmids... I l l
Figure 4-5 : Result of hybridisation of Southern blot of PKC-G positive cosmid... 112
Figure 4-6: Example of fractionation (C76D01 cosmid)...115
Figure 4-7: Ethidium bromide stained 0.8% agarose gel of the S ad digests of
the 20 clones isolated by screening the Fugu cosmid library with 12B17... 119
Figure 4-8: Schematic description of the alignments of the Fugu sequences to the human PRKCG cDNA sequence... 121
Figure 4-9: Restriction Digests of PKC cosmids and Centrin cosmid... 123
Figure 4-10 : Summary of primers used in degenerate PCR experiments... 128
Figure 4-11 : Ethidium bromide stained agarose gel (0.8%) displaying the results of a degenerate PCR experiment carried out using primers PKCGGF 5 and 6... 129
Fig 4-12: Result of PCR amplification using the PKCDGF5/6 primers on the
bands cut out from the original PCR from genomic and cosmid DNA... 130
Fig4-13: PKC degenerate primers 7 and 8 PCR experiment carried out
at 46°C and 50 °C... 131
Fig 4-14: PCR experiment using primers PKCDGF 9/10 on cosmid 12B17 (C)
and Fugu genomic (G) DNA... 132
Figure 4-16: Phylogénie tree comparing the PKC exon 11 and 12 sequences
generated by degenerate PCR from Fugu genomic DNA to the human PKC 135
Figure 4-17: Stained agarose gel of DG9/10 PCR products on hybridisation
positive cosmids... 136
Figure 4-18: Ethidium bromide stained agarose gel (0.8%) showing Ecorl and BamHl digests of the hybridisation positive and sequence scanning identified
cosmids... 138
Figure 5-1: NIX output of the 123J1-12B17 contig sequence... 145
Figure 5-2: Graphical summary of the features highlighted by NIX... 146
Figure 5-3: Genomic sequence of the Fugu prkcl gene...140-150
Figure 5-4: ClustalW alignment of known PKC proteins and those predicted
from Fugu sequences... 152-155
Figure 5-5: Phylogénie tree of all identified Fugu and mammalian PKC proteins. 157
Figure 5-6: Phylogénie tree of the Fugu and mammalian conventional PKC
proteins... 158
Fig 5-7: Percentage Indentity Plot (PIP) comparing the finished sequence of Fugu contig (cosmids 123j 1 and 12b 17) to the available human, mouse and
tetraodon draft sequences... 164
Figure 5-8: Conserved regulatory element binding sites immediately upstream
of PKC exonl... 166 Fig 5-9: Theatre prediction for P300 binding sites in the PKC upstream region.... 167
Figure 5-10: Genomic sequence of the Fugu eukaryotic initiation factor like
predicted gene... 168
Figure 5-11: : BLAST alignment of the Salivary glue protein SGS-4 precursor
amino acid sequence to the Fugu genomic sequence... 170
Figure 5-12: BLAST alignment of the Voltage-dependent calcium channel
gamma-5 subunit (CCG5) amino acid sequence to the Fugu genomic sequence.. 172
Figure 5-13: Genomic sequence of Fwgw cacgnS... 173
proteins and the cacngS protein predicted from Fugu sequences... 174
Figure 5-15: Phylogénie tree of the Fugu and mammalian calcium channel gamma subunit proteins (cacng)...175
Figure 5-16: BLAST alignment of the Voltage-dependent calcium channel gamma-3 subunit (cacgnS) amino acid sequence to the Fugu genomic sequence of scaffold S001310... 176
Figure 5-17: Screenshot of Ensembl database (www.ensembl.org) of the 19ql3.4 region showing PRKCG and CACNG7... 177
Figure 5-18: BLAST alignment of the Cytohesin 3 amino acid sequence to the Fugu genomic sequence... 179
Table 3-1 : Summary of protein sequence matches found using BLAST... 63
Table 3-2: Result of tBlast X search of Embl Blast databases for predicted gene 1.85 Table 3-3: Result of tBlast X search of Embl Blast databases for predicted gene 2.87 Table 3-4: Result of tBlast X search of Embl Blast databases for predicted gene 3.88 Table 3-5: Summary of the transcription binding site predictions made by rVista. 94 Table 4-1: Distribution of PKC isoenzymes in various species... 107
Table 4-2: reference ID of the Fugu cosmids identified by screening by hybridisation with the human PKCG... 110
Table 4-3: Cosmid subclones with significant database matches...116
Table 4-4: Cosmid subclones with significant database matches... 120
Table 5-1: Association between cPKC genes and Retinitis pigmentosa... 144
Table 5-2: Fugu scaffolds identified by searching the database with human PRKCA, B and G... 148
List of abbreviations
BAG Bacterial artificial chrom osome
cDNA Complementary DNA
EST Expressed sequence tag
HGP Human genom e project
Kb Kilobase
LCR Locus control region
MAR Matrix associated region
Mb M egabase
Mtp Minimum tiling path
ORE Open reading frame
OST Open reading frame sequence tag
PAG P1-derived artificial chrom osome
PGR Polymerase chain reation
PKG Protein Kinase 0
PRKGA Protein Kinase 0 alpha PRKGB Protein Kinase 0 beta PRKGG Protein Kinase 0 gam m a
Rflp Restriction fragment length polymorphism
SAR Scaffold associated region
STS S equence tagged site
YAG Yeast artificial chrom osom e
Introduction
In 2001 the draft DNA sequence of the human genome was determined both by the
large scale government funded program, the Human Genome Project (HGP) and by
the Celera corporation (International human genome sequencing consortium, 2001;
Venter et al, 2001). This represents a tremendous advance for science and, although
the sequences are not yet complete, it will have an enormous impact on the future of
genomics research. The Celera assembly was created by assembling whole genome
shotgun reads as well as publicly available data and is made up of ‘scaffolds’ or
contiguous assemblies o f overlapping sequences and paired sequence reads from 2, 10
and 50 kb plasmid inserts. Those scaffolds therefore contain large gaps yet cover
nearly all the genome. The HGP assembly is made up of mapped genomic clones that
have been fully or draft sequenced as well as whole genome shotgun reads and is also,
in parts, incomplete. The HGP data is made available to the scientific community
freely and as soon as it is available by sites such as that of the Ensembl project
(http://ensembl.org). The Celera database contains the sequence generated by the
corporation as well as the publicly available data. It is private and can be accessed by
paying a subscription fee. Three chromosomes have so far been completed to
accepted international standards, chromosomes 22 (Dunham et al, 1999),
chromosome 21 (Hattori et al, 2000) and chromosome 20 (Deloukas et al, 2001). As a
1-The H um an Genome Project (HGP)
1-1 Mapping the genome
Originally called the Human Genome Mapping Project, this was started in the late
1980s with the ambitious aim to map and then sequence the entire human genome by
2007. The brainchild o f James Watson, this was set up as a worldwide collaboration
under the aegis of the American National Institute o f Health (NIH).
1-1-1 The human genetic man
The first goal o f the project was to produce a genetic map of density o f one marker
per cM.
This was an ambitious target. Comprehensive maps had been achieved by means of
setting up crosses and studying their progeny for a few organisms such as Drosophila
melanogaster but, in order to map the human genome, one was going to have to rely
on human pedigree analysis and relatively few polymorphic markers. In genetic
mapping, use is being made of the fi*equency of recombination between chromosomes
during meiosis. Linked markers will be more likely to be separated by a cross-over
event the more distant they are. In laboratory organisms, it is possible to set up
crosses to specifically study a set o f markers. In human mapping, the genotypes of
members o f a family have to be studied carefully in order to detect recombinations
and statistical analysis employed to determine the relative distance between markers.
Furthermore, in order to derive this information, the markers have to be polymorphic
The first highly polymorphic markers to be recognised in animal genomes were
Restriction Fragment Length Polymorphisms (RFLP). The first human RFLP map
was published in 1987 (Donis-Keller, 1987). It was based on the study o f 21 families,
using 393 RFLPs and 10 additional polymorphic markers. It had an average density
o f one marker every 10 cM.
In order to refine the map, it was necessary to find more frequent markers.
Microsatellites (simple tandem repeats, typically 10-30 copies o f a repeat of 2,3, or 4
bases) quickly became the marker of choice for three main reasons:
■ they are frequent in the human genome - several per Mb
■ they are highly variable - several alleles o f each one being present in the
population as a whole and display a high level o f heterozygosity (the average
heterozygosity of the markers used in the 1996 map was 0.7 - 7 in 10 chance that
an individual will be heterozygous for the marker).
■ they can be efficiently and accurately typed by PCR, being under 300 bp in
length.
The target o f the 1 marker per Mb map was exceeded in 1994 with a map (published
two years later (Dib, 1996) featuring on average one marker per 0.6 Mb. The maps of
chromosomes 1 to 22 were produced from 8 families taken from the Centre d’étude
du polymorphisme humain (CEPH) collection, using 5264 microsatellites. A further
12 families were required to map the X chromosome, due to the paucity of
recombination events between X-linked markers. In total 304 individuals were
1-1-2 The human physical map
The production o f refined physical maps was not far behind.
Using Sequence Tagged Site (STS) screening, as well as other clone fingerprinting
methods, a clone contig map of the entire genome consisting of 33 000 YACs (Yeast
Artificial Chromosome) was published in the early 1990s (Cohen, 1993).
Unfortunately a large proportion of the YACs were found to be chimeric (containing
more than one genomic insert) and its value was therefore limited. A novel mapping
technique, making use of Radiation Hybrid Panels was to supplant it. These panels
are generated by breaking up human chromosomes using radiation and fusing the
resulting fi-agments into a rodent cell line. The resulting hybrid cell lines therefore
contain human DNA fi-agments within their rodent chromosomes. The marker
contents o f the different lines is determined and a matrix created allowing the
positioning of STSs depending on which cells lines are positive by PCR. A map of
200 kb density was generated (Hudson, 1995) and then a 100 kb map (Schuler, 1996)
A radiation hybrid map of the human genome was also generated as a collaboration
between the University o f Cambridge and the Généthon (Giapay et al, 1996). In a
recent analysis, these maps were found to be in broad agreement with the human
sequence map (Wright et al, 2001). An integretated map of the physical and genetic
maps was then generated (Deloukas, 1998) and this was to form the basis for
1-2 Sequencing the genome.
The 25th anniversary discovery o f DNA sequencing should see the completion of the
HGP. 1977 saw the publication, in the same issue of the Proceedings of the National
Academy of Science, USA, of the two principal methods of DNA sequencing: the
chain termination method (Sanger, 1977) and the chemical degradation method
(Maxam and Gilbert, 1977).
The chemical degradation method was the more accessible technique at the time. In
this method, the strands are radiolabelled at one end and then different reactions are
carried out which cleave the DNA molecules at different bases: guanine, cytosine,
adenine or guanine and lastly at cytosine or thymine. The resulting fragments are
separated on a polyacrylamide gel o f 1 base resolution and visualised by
autoradiography. Because only one end of the molecule is labelled, only the fragment
upstream of the cleavage is visible. And if the reaction is only allowed to work
partially, all the families of fragments ending in G will be present. The same will be
true o f A, T and C and therefore the banding pattern will represent the sequence of the
bases in the DNA molecule. All the reagents required were readily available and the
techniques employed were standard laboratory techniques.
The chain termination method relies on synthesising a second DNA strand from a
single stranded template. The nucleotides present in the reaction are a mixture of
deoxynucleotides and dideoxynucleotides, which are chain extension terminators. If
the ratio is set correctly, all the termination events will be represented in the reaction
product and therefore the reaction product is similar to that o f a chemical degradation
more easily available however, the chain termination method established itself as the
method o f choice and still forms the basis o f the Human Genome Sequencing
program. The sequencing revolution came with the advent o f automated sequencers.
These machines rely on fluorescent dye labelled sequencing primers or terminators.
The automated sequencer separates the extension products using a polyacrylamide
slab gel or capillaries and detects them using a complex system of optics. Briefly, a
laser is used to excite the dye and the emission detected either by photomultiplier tube
or a CCD camera. In this way a digital image of the gel is created and this can be
read automatically, without having to dry the gel or expose it to film (Ansorge et al,
1986). The patenting of a method in which four different dyes were used, allowing
the running o f all four reactions pertaining to a sample to be run in the same lane,
improved the capacity o f the machines. Novel enzymes and dyes have improved the
performance o f the technique so that it is possible to read a 1000 bases in one
sequencing experiment. It is also possible to read the sequence directly off large
clones such as BACs or YACs or small genomes such as viral genomes. A great deal
o f confidence was set by these improvements and there was a general belief that, as
one got nearer the deadline, the techniques would be so much more efficient that it
would be possible to complete the task with less effort. This may partly account for
the fact that the sequencing data was not really generated on a large scale until 1996-
1-2-1 Four different sequencing approaches:
Genome-wide sequencing strategies have taken four different routes: cDNAs,
sequence scans o f genomic clones, finished sequence o f genomic clones and whole
genome shotguns.
1 -2-1 -1 Sequencing cDNAs
With the drive forward o f the human physical map, a great deal of STSs were
generated. Sequence tags o f cDNAs (ESTs) are a representation o f the expression of
the genome and are also a 'gene catalogue'. (Adams et al, 1991, 1992, 1993) Patents
were filed for these, on the premise that these would subsequently be assigned
function and be of financial interest (Kerlavage et al, 1993; Venter et al, 1992). The
TIGR corporation formed a private company (HGS) which was to take a very large
scale approach to this and sequenced hundreds of thousands o f ESTs, all o f which
were only available to subscribers (Marshall, 1994; Rowe, 1995).
The IMAGE library is a cDNA library in which all the clones are sequence tagged.
(Lennon, 1996). This is a powerful resource as every clone isolated can be checked
for homology to published databases using programs such as BLAST (Altschul,
1997).
The drawback in using ESTs to study expression is that there is vast over
representation o f some cDNAs while others are missing, large numbers of ESTs in
fact representing the same cDNA where other cDNAs are absent. A great deal o f
Furthermore, full-length cDNA libraries are being generated and the complete,
finished sequences of the cDNAs obtained. Fantom, a large-scale annotation project
o f full-length mouse cDNAs is under way in Japan, for example, at the Riken Institute
(Kawai, 2001). This resource will allow scientists to identify genes and determine
alternative transcripts. Another initiative is concerned with the creation o f full-length,
expression-ready cDNAs (FLEX clones). The inserts are the cDNA sequence, from
methionine to stop, without the 5’ or 3’ untranslated regions (UTR), cloned
recombinationally in a way that allows for the directional and in-frame shuttling of
the gene into an expression vector (http//:www.hip.Harvard.edu).
1-2-1-2 Sequence scanning of genomic clones
A great deal o f information can be derived from partial sequences. A one fold or two
fold coverage o f a clone will be sufficient to identify nearly all the genes and markers
present in a genomic clone. In order to analyse a given gene, a 6-10 fold coverage of
the clone followed is required by editing. Genome scans, however, provide a cost
effective way of analysing genome contents and provide the means for genome
comparisons. The Fugu Landmark Genome Project, for example, scanned 25 Mb
(6%) of the Fugu rubripes genome (Elgar et al, 1999). This successfully
demonstrated the benefits of sequence scanning in comparative genomics, as
1-2-1-3 Full length sequencing from genomic clones
This is the strategy adopted by the HGP. Clones from a physical map were selected
to form a minimal tiling path and sequenced individually. At the beginning this
consisted o f cosmids, but as larger clones became available, BACs and FACs became
the template o f choice. Directed strategies and ordered shotgun strategies have been
devised, but the large sequencing centres have nearly all adopted the random shotgun
approach. In this method, the clone is broken up randomly by sonication or shearing,
the fragments size selected and end repaired before being sub-cloned by blunt-end
ligation. The first vector o f choice was Ml 3, as it naturally produces large amounts
of single-stranded DNA, traditionally the sequencing template o f choice. As cycle
sequencing became more widespread, its greater tolerance o f double-stranded
template made more stable vectors such as plasmids more attractive and now PUC 18
has supplanted M13mpl8 as the shotgun sequencing workhorse. These subclones are
then end-sequenced to provide a relatively deep coverage of the clone (8-12 times
coverage or 10 -15 reads per kb). The reads are then ’assembled’, by which is meant
that overlapping reads are aligned using a computer package or ’assembly engine’
such as Gap4 (Staden, 1998) or Phrap (Gordon et al, 1998). O f course these almost
never cover the whole clone but fall into contiguated assemblies (contigs). These
alignments are edited and experiments designed to link up the various contigs until
the sequence o f the whole clone is arrived at. Various conventions and quality
standards are internationally accepted to provide greater than 99.99% accuracy (less
than 1 error in 10 000 bases), based on the Phred base caller quality values. Phred
base caller and it assigns a quality value for each base 20, corresponding to a 99.99%
confidence value.
1-2-1-4 Whole Genome Shotgun
This method had previously been successfully applied to the sequencing o f viral and
bacterial genomes (Cole et al, 1998). Briefly, the principle o f the method consists in
fragmenting and sub-cloning the entire genome directly into a plasmid library without
carrying out any physical mapping. Sufficient sub-clones are sequenced to give an
adequate depth o f coverage and the whole database o f sequence reads assembled
much in the same way as in a traditional shotgun project.
In 1997, the idea was put forward that it might be possible to apply this method to
entire human chromosomes (Weber et al, 1997; Green, 1997). Much debate was
occasioned as to whether the assembly would be correct or whether the presence o f so
many repeat sequences over such a long stretch o f DNA would render it impossible to
obtain an assembly that would be any more than a crude scribble, an opinion ventured
by the then director of the NIH, Harald Varmus.
The conflict was further fuelled by a fundamental divergence o f opinion as to the
ownership o f data. The genome centres taking part in the HGP are all signatories o f
the Bermuda agreement by which they pledge to make all sequence data publicly
accessible with no delay. The Celera database is available only on subscription. The
first sign o f acceptance of the Celera corporation by the publicly funded bodies was
the partnership between the Lawrence Berkeley National Laboratory and Celera
sequence assembly was based on maps acquired over years of research by publicly
funded scientists worldwide.
Craig Venter was the master o f hubris in this conflict between government
organisations and big corporations yet he seems to have been vindicated and also to
have forced the HGP to bring forward their targets. By June this year the Whole
Human Genome Shotgun was sequenced and the HGP published the draft sequence of
the entire human genome (International human genome sequencing consortium, 2001;
Venter et al, 2001).
1-3 The sequence of the human genome
The current status o f the human genome sequence is that the Human Genome Project
has obtained a 'draft* sequence for the human genome and that the Celera corporation
has finished sequencing the whole human genome shotgun. The HGP draft is on
average 5 bases deep, which enables the identification and location of genes and will
form the basis for fair amount o f analysis and polymorphism detection. The
determination of gene structure and regulation however will necessitate the ftill
sequence allied with a degree of experimentation and comparative analysis.
The total number o f genes in the genome is currently a matter for debate.
Estimates based purely on a gene index o f clustered and filtered ESTs arrive at a
number of human genes to be as high as 120 000 (Liang et al, 2000). Because
clustering ESTs is a difficult task, requiring enormous computing resources, in order
to eliminate clusters which are not really unique, these were matched to the finished
was found to contain 545 genes and 134 pseudogenes (Dunham et al, 1999).
Extrapolating from these figures would give an estimate figure of 37 700 genes in the
human genome. Chromosome 21 represents 1 to 1.5 % o f the genome and contains
127 known genes, 59 pseudogenes and 98 predicted genes (Hattori, 2000), therefore
giving a lower figure of 28 400 genes. In a similar study, 680 assumed genes on
chromosome 22 were found matches to 2 % o f a selected set o f EST clusters (Ewing
and Green, 2000). This was based on the assumption that those 680 correspond to
2% o f all genes, from which a total figure o f 34 000 genes can be extrapolated.
Similarly, comparative sequence analysis of evolutionary conserved regions in known
genes on human chromosome 22 to the teleost Tetraodon nigroviridis gave an
estimate o f 30 000 genes, assuming a uniform rate of conserved regions per true gene
(Roest Crollius et al, 2000). These latter figures are more closely in agreement with
estimates resulting combining de novo computer gene predictions to EST matches.
Matching Genscan gene predictions to EST homology provides an estimated total
gene number of 33 000 (www.ensembl.org). It has been argued, however, that
estimates o f sensitivity and redundancy should be taken into account when computing
gene numbers, and that the total number of genes in the genome should be revised to
60 000 (Bimey E, Genome Based Structure Determination Symposium, June 2000).
In a more recent study aligning transcriptional units to the genome, a prediction of the
genome containing 65 000-75 000 transcriptional units was made (Wright, 2001).
The authors estimate the presence of 854 genes on chromosome 22, which is 25%
more than the previous estimate o f Ewing and Green, but representing only 1.4% (as
opposed to 2%) o f the gene total.
It would seem that the emerging sequence data and refining o f prediction tools is
however, for the complete sequence to be fully annotated in order to know the correct
number of our genes. It would seem, for the present that this number lies between 28
400 and 75 000.
It is interesting, at this stage to introduce a comparison with another organism, which
is currently being annotated, the worm Caenorhabditis elegans . Whereas, in the case
o f the human genome, early estimates of 60 000 to 150 000 genes have been revised
down to around 30 000 in the light of the annotation o f the two finished
chromosomes, the number of genes in C elegans have been revised up from the early
estimates of around 10 000 to 19404 protein genes in Wormbase
(http://www.wormbase.org), now that the finished sequence is available (The C.
elegans sequencing consortium, 1998). In order to test whether this near doubling of
the estimate of gene numbers could be substantiated, an open reading fi'ame sequence
tag (OST) approach was employed, in which it was attempted to amplify a product
from cDNA for 1 222 predicted genes for which no EST had yet been obtained
(Reboul et al, 2001). At least 70% o f the genes studied were verified, although the
predicted intron/exon structure was not always correct, indicating that a conservative
gene number estimate for C. elegans is 17 387. The total gene number is likely to be
even higher, as many small genes, such as those encoding neuropeptides,
antimicrobial peptides and small regulatory proteins such as egl-1 are difficult to
identify (Conradt and Horvitz, 1998). Moreover, this count does not include RNA-
encoding genes, which are difficult to pinpoint in raw sequence, and may total over
1000 in C.g/ggawj (Hodgkin, 2001).
The other consideration is that the gene count of 20 000 for C.elegans seems high, as
complexity o f the organisms. There may be some reasons, however, why the two
counts are not directly comparable.
There is a relative lack of differential splicing in C. elegans, compared to Drosophila
or mammals (Hodgkin, 2001). Whereas 30 000 to 40 000 genes may give rise to 100
000 proteins or more in a mammal, only 4% of genes have been confirmed as
exhibiting alternative splicing in the worm (wormbase: http://www.wormbase.org).
This figure may rise when more C. elegans cDNA sequences are deposited in the
databases, since 40% o f C. elegans genes do not have associated ESTs as o f yet.
Furthermore, human proteins tend to contain more multiple domains than C. elegans
proteins, particularly in the case of transmembrane proteins with large extracellular
regions. Mammalian proteins may therefore be more multifunctional.
Thirdly, many C. elegans genes and small genetic regions seem to have been involved
in local duplication events (The C.elegans sequencing consortium, 1998).
Interestingly, the C. elegans genome displays many examples o f incomplete
redundancy, in which genes share some of their function, yet also display unique
functions. For eample, the Notch-related receptor genes, lin-12 and glp-1 have
distinct postembryonic roles yet share function in embryogenesis (Kimble and
Simpson, 1997).
Finally, there are also gene families which are greatly expanded, such as the nuclear
hormone receptor genes (nhr), for example, which are much more numerous in the
worm than the Drosophila or human genomes (Maglich et al, 2001).
It is clear that the precise number of human genes is going to remain uncertain for a
few years to come. It is also probable, judging from the experience of C. elegans that
computer predictions from the raw sequence will have to be supplemented by ESTs,
2 - M aking sense of the genome sequence
Now that the tour de force of sequencing the human genome is nearing completion,
scientists are facing an even greater challenge: understanding the make up and
function of the genome.
■ which parts o f the sequence constitute the transcriptome?
■ how is transcription regulated?
■ what functions to attribute to its product, the proteome?
2-1 The transcriptome
It is estimated that coding sequence accounts for only around 3% o f the genome. The
great majority of the sequence is intergenic while within a gene, coding exons are
separated by long stretches of intronic sequence. Coding sequences can be identified
by examining the DNA sequence or by performing experiments.
2-1-2 Gene prediction bv sequence analysis
Protein coding genes are made up of open reading frames (ORF). These usually start
with the ATG codon and end with a TAA, TAG or TGA termination codon.
However, looking for ORFs in higher eukaryotic sequences is complicated by the fact
that genes are often split by introns and do not appear as continuous ORFs in the
■ Codon bias: each species has a specific frequency o f codon usage for a given
amino acid. This will be found in real exons, but not in random series o f triplets
■ Exon-intron boundaries: these have distinct sequence features, the upstream
boundary being o f the format: 5’-AG| | GTAAGT-3' in which the GT is
invariably found but the other bases are only the most common. The downstream
boundary is defined as: 5'-YYYYYYNCAG| |-3' (Y denoting C or T and N
denoting any base). Evidently, these motifs are not easy to search for in a
sequence and therefore identification of intron-exon boundaries by analysing the
sequence alone is not going to give the full answer (Freeh et al., 1997).
■ Upstream control sequences: these too have characteristic motifs. Unfortunately
they are not defined enough to make good predictors.
■ CpG islands: these regions of high prevalence of the CG motif are associated
with the upstream region of the majority o f vertebrate genes (Bird, 1986). These
can be identified by computer programs and are a good indicator of the start o f a
gene.
2-1-2-1 Exon predictions
A number o f exon prediction programs have been developed, as HEXON (Solovyev
et al, 1994), MZEF (Zhang, 1997), Genemark (Lukashin and Borodovsky, 1998) or
GRAIL/exons (Uberbacher and Mural, 1991). Other programs attempt to link the
exons together into genes, such as Grailgap2 (Uberbacher et al, 1996), Fgene
(Solovyev et al, 1995) or Genscan (Tiwari et al, 1997). Programs such as Grail use a
neural network to combine a number of test that try to identify patterns characteristic
discrimination method, classifying the sequence on one or more observed sequence
patterns, as used by programs such as HEXON, FGENEH and MZEF.
2-1-2-2 Homology searching:
Homology to already published genomic or cDNA sequences is a powerful gene
identification method. This relies first and foremost on up-to-date, well curated
databases. The first sequences to be collected were o f proteins, in the wake of the
development of protein sequencing methods (Sanger and Tuppy, 1951). This was the
work of Margaret Dayhoff (Dayhoff et al, 1972, 1978) and collaborators at the
National Biomedical Research Foundation (NBRF), resulting in the Protein
Information Resource (FIR). One particularly carefully annotated protein database is
Swissprot.
DNA sequence databases were first assembled at Los Alamos National Laboratory
(LANL) by Walter Goad and colleagues in the GenBank and at the European
Molecular Biology Laboratory (EMBL) in Heidelberg. Genbank is now under the
hospices of the National Center for Biotechnology Information (NCBI).
Searching these extensive databases required fast, efficient similarity searching
programs. One o f those is FASTA (Pearson and Lipman, 1988), which breaks down
the sequences into short words a few characters long, and those words organised into
both sequences, particularly if several words can be joined, the sequences must be
similar in those regions.
An even faster program is BLAST (Altschul et al, 1990), which also prepares a table
o f short sequences for each sequence, but additionally determines which o f these
words are most significant such that they are a good indicator o f similarity in both
sequences and then confines the search to these words. BLAST can search with
protein or nucleic acid sequences. BLASTX will translate a nucleic acid sequence to
search a protein database, TBLASTN searches a translated DNA database with a
protein query sequence and TBLASTX will search translated DNA against translated
DNA.
BLAST is an immensely useful tool, revealing what novel sequences most closely
resemble, thereby aiding in their characterisation. Additionally, by revealing which
discrete sections of alignment between a cDNA and genomic sequence and
positioning them thereby consolidating the results o f the exon predictions.
This latter function is also performed by programs such as est2genome (R. Mott,
unpublished data), Sim4 (Florea et al, 1998) or Procrustes (Gelfand et al, 1996),
which attempt to determine the exon/intron structure o f a gene by aligning the cDNA
sequence to the genomic.
All these programs can be run within NIX (Williams and Hingkamp, unpublished
data) at http://www.hgmp.mrc.ac.uk. NIX is a web-based interface, which runs exon
prediction tools and BLAST homology searches on repeat masked sequence, as well
as CpG island, promoter and polyadenylation site predictions, and is a powerful fi*ont
line gene identification tool. The results are presented in an interactive graphical
To put matters into perspective, however, one should observe that, in the analysis of
the now complete Caenorhabditis elegans genome, around half o f the predicted
genes, originally predicted by GeneFinder have no assigned function or known
homology (The c.elegans sequencing consortium, 1998). Clearly, exon predictions
and homology searches alone are not going to provide all the answers.
2-1-3 Identifying genes bv comparative sequence analvsis
Comparing the genomic sequences o f syntenic regions from different species is a
powerful way to detect genes, by making use can be made o f the high conservation of
coding sequence between species. A number o f genomes have been fully sequenced.
They include Saccharomyces cerevisiae (Goffeau, 1996; The yeast genome directory,
1997), Saccharomycespombe, Caenorhabditis elegans (The c.elegans sequencing
consortium, 1998), Drosophila melanogaster (Adams, 2000) and Arabidopsis
thaliana (Lin, 1999; Mayer, 1999; Salanoubat, 2000; Tabata, 2000; Theologis, 2000).
The mouse genome is also being completely sequenced. Long range comparative
studies had strengthened the case for sequencing the mouse genome in order to assist
gene annotation and regulatory element identification (Hardisson et al, 1997). The
Celera corporation have created an assembly from three different strains on mouse
(129X1/ SvJ, A/J and DBA/2J) while the international mouse genome sequencing
consortium are sequencing the C57BL/6 genome from mapped RPCI-23 and RPCI-24
BAC clones, having first made available 40 million C57BL/6 whole genome shotgun
specific interest are being sequenced from the same libraries by the UK mouse
sequencing consortium. All the publicly available mouse genomid data are being
integrated into mouse Ensembl (http://mouse.ensembl.org).
Interestingly, the Celera corporation report a level o f single nucleotide
polymorphisms o f one every 14 kb within the 129/SvJ strain (Mural, 2001) whereas
none have been found between the C57BL/6 whole genome shotgun and BAC
sequences (North, 2001). The genetic variability among 129 sub-strains has been
documented (Simpson et al, 1997), the view has been expressed, however, that this
reported incidence o f SNPs within a strain seems abnormally high (as expressed by
Eric Lander at the 2001 Genome Sequencing and Biology conference. Cold Spring
Harbor). This may reflect the fact that whole genome shotgun assemblies are at the
mercy o f repeats, some o f which may not yet have been identified and may cause mis-
assemblies.
There is therefore a vast scope for comparative genomic sequence analysis. Fugu
rubripes is one organism which has been extensively used for these studies.
2-1-3-1 The Fugu model:
The Fugu rubripes genome is made up of 400 million bases and therefore 7.5 times
smaller than the human genome (Hinegardner, 1968, Brenner, 1993). Its gene
complement, however, is thought to be very similar to that of higher vertebrates
(Elgar, 1996). The genome contraction was recently confirmed by the analysis o f 199
introns in 22 orthologous genes, showing an eight-fold average size reduction
throughout the genome, particularly in view of the uneven distribution o f genes in the
human genome (Deloukas et al, 1998).
Although its genomic divergence relative to man is great, 400 million years, there are
convincing examples o f conserved synteny and very strong evidence that almost all
genes are conserved. One early example was the identification o f the Fugu orthologue
to the gene responsible for Huntington’s disease, the HD gene (Baxendale et al,
1995). In this case, all 67 exons and the exon/intron boundaries are conserved, the
overall identity o f exons being 69% at the DNA level. The CAG repeat whose
expansion is the cause o f Huntington’s disease is also conserved in Fugu.
In view o f the compact nature its genome, the Fugu model has often been seen as an
aid to positional cloning strategies. One study demonstrated that three genes linked to
FOS in the familial Alzheimer disease focus (AD3) on human chromosome 14q24.3,
have homologues in the Fugu genome adjacent to Fugu cFOS. The three genes FOS,
S31iiil25 and S20il5, are conserved in the same order in the two genome but occupy
600 kb in man whereas they take up 12.4 kb in Fugu rubripes. This highlighted the
utility o f the Fugu model for sequence- based identification of genes in human disease
loci (Trower et al, 1996).
Similarly, the WAGR region (1 lp l3 ) (Wilm’s tumour. Aniridia, Genitourinay
abnormalities and mental Retardation - Francke et al, 1979) shows gene order
conservation and contraction (Miles 1998) . The region contains three genes, W tl
(Wilms tumour), reticulocalbin (Ren) and Paired box protein PAX-6 (Oculorhombin)
or PAX6. W tl and PAX6 are approximately 750kb apart in human and mouse, yet
the equivalent Fugu region is contained within 90 kb and contains the three human
Similarly, a region o f human Xp22.2-p22.1 containing 9 genes in a 600 kb stretch
shows conserved gene order in a 68 kb Fugu interval, with one inversion (Brunner et
al, 1999). In an other example of the compact nature of the Fugu genome, the 148 kb
region around the Fugu wtnl locus contains 15 genes, showing an extremely high
gene density (Gellner and Brenner, 1999).
Gene order is not, however, always preserved. The human region on 9q 34.2-q34.1
(2-4 Mb) containing the Surfeit genes shows extensive rearrangements with regard to
the Fugu genome (Gilley and Fried, 1999). A three species study comparing a human
region on 19pl2-13 (225 kb) containing 7 genes to the equivalent mouse and Fugu
regions found synteny preserved between human and mouse, yet three o f the genes to
be missing from the Fugu region (Clarke et al, 2001).
A novel transcription factor gene, SLP-1, a member o f the stem cell leukaemia (SCL)
gene family was identified by screening the Fugu cosmid library by hybridisation and
sequence scanning (Gottgens, 1998). The full sequence o f the cosmid revealed a
gene organisation similar to that of the other gene family members. Expression
pattern analysis using RT-PCR and Northern Blot confirmed the validity o f the gene
prediction, the expression contrasting with that o f the other gene family members.
Preliminary Southern blot data suggest the presence of a mammalian homologue
(unpublished data), however, the novel gene may not have a mammalian homologue,
as evidence suggests this is sometimes the case (Apparicio et al, 1997). This
controversy arises from observations relating to the HOX cluster genes. These
encode DNA binding proteins that specify fate along the anterior-posterior axis o f
bilateral animals (Krumlauf R., 1994; Kmita-Cunisse M. et a., 1998; Kourakis M. et
al., 1997; Lewis E.B., 1978), the order of the HOX genes reflecting the order they act
HOX cluster and little axial diversity while tetrapods have four clusters and
substantial axial complexity (Garcia-Femandez J. and Holland P.W.H., 1994; Di
Gregorio A. et al., 1995). Tetrapod clusters arose by duplications o f an ancestral
cluster containing 13 genes (Holland P.W.H and Garcia-F emandez J., 1996; Sharman
A. and Holland P.W.H., 1998). Although it is widely assumed that all vertebrates
have four HOX clusters, initial studies of teleosts revealed unexpected HOX genes
(Aparicio S. et al. 1997; Misof B. and Wagner G., 1996; van de Hoeven et al., 1996;
Prince V., 1998); Eiken et al., 1987; Njolstad P.R. et al., 1988; Njolstad P.R. et al.,
1988; Njolstad P.R. et al., 1990; Runstadler J.A., 1991; Sordino P., 1996; Prince V.,
1997). Genetic mapping studies in the zebrafish {Danio rerio) indicate the presence
o f seven HOX clusters. These results, combined with phylogenetic studies suggest
two rounds o f HOX chromosome duplications (possibly whole genome duplications)
before the divergence o f ray-finned and lobe-finned fish lines and one more in ray-
finned fish before teleost radiation. Therefore, in the case o f HOX genes, teleost have
more genes than mammals, despite less complexity in the anterior-posterior axis
(Amores A. et al., 1998).
Studies of gene families have so far not yielded evidence o f large scale duplications in
Fugu, although a large number o f rearrangements is probable (4000-16000 reciprocal
translocations or inversions) (McLisaght, 2000).
The Fugu rubripes Landmark project (Elgar et al, 1999), as mentioned in section
1-2-1-2, provides, as a public resource searchable by keyword or sequence on the world
wide web, a sequence scan covering 6% of the genome
(http://www.hgmp.mrc.ac.uk/Fugu). The high degree of gene conservation
experienced in Fugu, combined with the compactness of the genome, introns are short
by sequence scanning. A far greater proportion o f the genome is coding (17.4 % as
opposed to less than 3 % in man) with a low incidence o f repeats (less than 10 %), the
gene density is higher (every 6-7 kb rather that 80 kb in man).
This resource was used in an attempt to quantify the amount o f conserved synteny
between man and Fugu, a study of gene linkage was carried out, based on sequenced
scanned cosmids bearing more than one gene. An assessment o f conserved synteny
was based on whether genes thus known to be linked in Fugu were also linked in
man. Synteny was found to be conserved for 40-50% of genes (McLysaght, 2000).
The Fugu genome has recently been draft sequenced by the Fugu Genome
Consortium. Indeed, an assembly of a 6-fold whole genome shotgun has recently been
released (25^^ October, 2001). This sequence complements the public resource o f the
Fugu landmark project and is available on the same web site.
Another teleost genome, that o f Tetraodon nigroviridis, is also being sequenced,
currently to a depth o f 4.5 fold coverage as a joint effort by the Genoscope and
Whitehead Institute (Roest-Crollius, Cold Spring Harbor/Welcome Trust
bioinformatic conference, August 2001). As the two organisms are relatively close in
evolutionary terms, useful comparisons will be possible.
2-1-3-2 The mouse model
A number o f comparative genomic sequence analysis have been carried out using the
mouse model. Briefly, they comprise the Btk locus on the mouse and human X
chromosomes (Oeltjen et al, 1997), a gene-rich cluster on human 12pl3 and mouse 6
(Ansari-Lari et al, 1998), the mnd2 region on human 2pl3 (Jang et al, 1999), the
ADA region (Brickner et al, 1999), the T-cell receptor locus (Koop and Hood, 1994)
In a recent mouse comparative study, a comparison of the 600 kb Bare patches (Bpa)/
Striated (Str) region was undertaken (Mallon et al, 2000). The Bare patches and
Striated phenotypes were possible models for two X-linked lethal conditions:
Icontinentia pigmetii and Chondrodysplasia punctata. Comparative analysis
facilitated the identification o f the Bpa and Str gene, Nsdhl (Liu et al, 1999). A
further eight genes were identified in mouse and human sequence, not found
previously by exon trapping or cDNA selection. These include a member of the
melanoma antigen gene family (Magea9), two novel members o f the X-linked
lymphocyte-regulated family (xlr4 and xlr5) and a zinc-finger gene {ZJp275). Mouse
and human sequence comparison analysis identified at least four potential additional
genes on the basis of evolutionary conservation.
Large stretches o f close sequence identity were identified in intergenic regions where
no exons are predicted and no homology detected using BLAST. In order to set
criteria for the study of these evolutionary conserved regions (ECR), the degree of
conservation in coding exons, 5’ UTRs and 3’UTRs was plotted. From these, two
categories were defined, ECRs greater in length than 50 bp and with a percentage
identity greater than 80% and ECRs longer than 50 bp and with a percentage identity
higher than 70%. This filter greatly reduced the noise, with 35 o f the 80% category
and 116 o f the 70% category ECRs detected. O f these, four were potentially
transcribed regions.
Using RT PCR analysis those can be found to be expressed in various tissues and
therefore it can be argued that comparative sequence analysis can help discover novel
2-2 Gene regulation
In order to understand the challenge faced in determining how genes function, it is
useful to revisit how genes are regulated.
2-2-1 Access to the genome
In the non-dividing nucleus, DNA presents itself in the form o f heterochromatin,
tightly packaged in chromatin and inaccessible to DNA binding proteins, and
euchromatin, which is less compact, allowing entry to expression proteins. Telomeres
and centromeres are permanently packaged and sometimes termed constitutive
heterochromatin. Portions of the genome are included in the heterochromatin for part
o f the cell cycle and are thought to contain genes that are active only in some cells for
part o f the cell cycle: this makes up the facultative heterochromatin.
Heterochromatin tends to be concentrated at the edge of the nucleus. Euchromatin is
dispersed throughout the nucleus, and while it is associated with chromatin, it is less
tightly packaged, the DNA forming loops attached to the chromatin fibre via AT-rich
segments known as MARs (matrix asociated regions) or SARs (scaffold associated
regions). (Brown, Genomes). It is thought that the DNA in these loops is readily
accessible to expression proteins and contains active genes. The maintenance of this
structure is, at least for some domains, under the control o f the locus control region
(LCR). Loss o f this function can cause disease, as mutations in the P-globin LCR
gives rise to thalassemia (Wolffe, 1995). The fine structure of chromatin can also
have a marked effect, in that repositioning of nucleosomes can fine tune gene
polymerase (Wade, 1997). One such mechanism is histone acétylation, the other
chromatin remodelling (Cairns, 1998).
MARs and SARs are considered to be an indicator of the presence o f expressed genes.
Although the sequence of only a small number o f such regions has been determined,
several characteristic sequence patterns have been identified. The program MAR-
FINDER (http://www.ncgr.org/MarFinder/) searches for sequences that have a high
representation of such sites in genomic DNA (Singh et al, 1997).
Silencing o f parts o f the genome is also achieved by means o f méthylation o f cytosine
residues. Transposable elements and repetitive sequences are typically
hypermethylated (Bender, 1998). Silencing of one of a pair of genes in genomic
imprinting is also achieved by méthylation (Jaenisch, 1997) as is X inactivation, the
mechanism by which one o f the female X chromosomes is inactivated under the
control o f the Xist gene. Méthylation patterns are preserved in DNA replication in an
enzymatic process known as maintenance méthylation. Housekeeping genes which
are expressed in all tissues have unmethylated CpG islands close to them and tissue
specific genes have unmethylated CpG islands only in the tissues where they are
expressed. It has been shown that méthylation is associated with reduced levels of
histone acétylation and therefore induces chromatin formation in methylated regions.
(Eden, 1998).
2-2-2 Transcription
In eukaryotes there are, in addition to the core promoters, at which site the initiation
In the absence o f an upstream promoter element, assembly of the initiation factor will
take place very inefficiently.
Different genes will be transcribed by different RNA polymerases and each o f the
three eukaryotic polymerases has a different type o f promoter.
RNA polymerases attach to the core promoter directly or via proteins to form the
initiation complex.
Some eukaryotic repressors may compete with transcription activators for the same
binding site but they have not been comprehensively studied in eukaryotes.
Regulation o f transcription factors is achieved either by controlling their synthesis or
their ability to activate or repress transcription. This is achieved either by
extracellular signal compounds entering the cell (direct activation) or binding to cell
surface receptors which transduce the signal to the cell interior (indirect activation).
As the upstream promoter elements and the transcription factor binding sites are not
clearly correlated with the regions exerting transcription control, it is difficult to
identify them. Furthermore, although consensus DNA binding sites for transcription
factors do fall into categories such as CAAT box, GC box for example (Twyman
1998), upstream promoter sequences are far more difficult to characterise and
therefore more difficult to search for in one genomic sequence alone.
It is hoped that comparative sequence analysis strategies can play a role in identifying
them.
2-2-3 Identifying regulatorv elements using bioinformatic tools
A number of programs have been written with the aim to detect Transcription Factor
of initiation o f transcription. Grailll (Uberbacher and Mural, 1991; Uberbacher,
1996) makes use o f neural networks based on scores of characteristic sequence
patterns and composition. The TRANSFAC programs and TRANSFAC database
(Heinemeyer et al, 1999; Klingenhoff et al, 1999) provide search for TF binding site
(Http://www. gsf.de). Marind for making scoring matrices and Matinspector for
searching matches to matrices. A great deal can be learnt from the identification of
conserved non-coding conserved sequences (CNS). Tools such as Dotter
(Sonnhammer and Durbin, 1995) allow for the close comparison o f two genomic
sequences. Being able to visualise conservation in the context o f the annotated
sequence is an obvious advantage, as is the possibility o f aligning multiple sequences.
Two programs are available on the web: PIP (Schwartz et al, 2000)
(http://nog.cse.psu.edu/pipmaker/) and Vista (Dubchak et al, 2000; Mayor et al,
2000)(http://www-gsd.lbl.gov/vista). In addition, the regulatory Vista program
(rVista) (Loots et al, 2001) will combine sequence identity and TRANSFAC search,
as will the Theatre Program (http://www.hgmn.mrc.ac.uk) (Edwards, unpublished
data).
2-2-4 Identifying regulatorv elements bv comparative sequence analvsis
In a large scale comparison of the human and mouse Bruton Tyrosin kinase (BTK)
region, four clusters o f potential transcription factor-binding sites were identified
within evolutionary conserved regions by searching the TRANSFAC database.
Transient expression analysis in relevant cell lines indicated that the conserved
In the three way comparison of the WAGR region, where a megabase o f human, a
megabase o f mouse C57BL/6 and 90 kb of Fugu finished sequence can be aligned,
known regulatory elements can be identified by sequence conservation. The
comparative study o f PAX6 had already yielded such examples (Miles et al, 1998).
Two clusters were found 5 kb upstream of the 5’ end o f the gene, while a third, highly
conserved region in intron 4 was a proposed retinal specific enhancer (Plaza et al,
1995) and a fourth was found in intron 7. The availability o f the mouse sequence and
the extension o f the Fugu sequence reveals the presence o f large stretches o f highly
conserved sequence, including around a 500 bp sequence, corresponding to a known
enhancer, which is conserved at around 95% identity in the mouse and at around 60-
75% in Fugu.
In the search for long range regulatory elements, a different strategy was employed in
the case o f Interleukin 4,13 and 5 (Loots et al, 2000). In a comparison o f a megabase
o f human and mouse genomic sequence, 90 conserved non coding sequences (CNS)
stretching over 100 bp with greater than 70% identity were identified. 15 were
selected for further analysis. Degenerate primers were designed with the view of
assessing their copy number in human and their presence in other vertebrates as well
as chicken and Fugu. 10 were found in at least two further species and 12 appeared to
be unique in human, as confirmed by low stringency Southern blot. The largest CNS
was 401 bp, situated in the intergenic region between IL-4 and IL-13, was amplified
in all species, although bearing no homology in chicken and Fugu. In CNS-l*^®*
transgenic mice studies, it was found that the absence of CNS-1 reduced the
expression of IL-4 by half and IL-13 by two thirds, IL-5 being also affected. This
strategy was therefore successful in identifying a long range regulatory element which