International Journal of Chronic Obstructive Pulmonary Disease
Dovepress
O r I g I n A L r e S e A r C h
open access to scientific and medical research
Open Access Full Text Article
Lung function and blood markers of nutritional
status in non-COPD aging men with smoking
history: A cross-sectional study
nobuyoshi Shiozawa1
Kanae hayashimoto2
etsuji Suzuki5
hiroshi Kikuchi3
Shingo Takata3
Kozo Ashida3
Masutaka Watanabe4
Yasuhiro hosaki6
Fumihiro Mitsunobu1,3
1Department of geriatric Medicine, graduate School of Medicine, Dentistry and Pharmaceutical Sciences, Okayama University, Misasa, Tottori, Japan; 2nutrition Support Service and Divisions of 3Internal Medicine and 4rehabilitation, Okayama University hospital Misasa Medical Center, Misasa, Tottori, Japan; 5Department of epidemiology, graduate School of Medicine, Dentistry and Pharmaceutical Sciences, Okayama University, Okayama, Japan; 6Division of Internal Medicine, hiroshima Teishin hospital, hiroshima, Japan
Correspondence: Fumihiro Mitsunobu Okayama University hospital Misasa Medical Center, 827 Yamada, Misasa, Tohaku, Tottori 682-0192, Japan Tel +81 858431211
Fax +81 858431305
email fumin@cc.okayama-u.ac.jp
Purpose: Cigarette smoking and advanced age are well known as risk factors for chronic obstructive pulmonary disease (COPD), and nutritional abnormalities are important in patients with COPD. However, little is known about the nutritional status in non-COPD aging men with smoking history. We therefore investigated whether reduced lung function is associated with lower blood markers of nutritional status in those men.
Subjects and methods: This association was examined in a cross-sectional study of 65 Japanese male current or former smokers aged 50 to 80 years: 48 without COPD (non-COPD group), divided into tertiles according to forced expiratory volume in one second as percent of forced vital capacity (FEV1/FVC), and 17 with COPD (COPD group).
Results: After adjustment for potential confounders, lower FEV1/FVC was significantly associ-ated with lower red blood cell count (RBCc), hemoglobin, and total protein (TP); not with total energy intake. The difference in adjusted RBCc and TP among the non-COPD group tertiles was greater than that between the bottom tertile in the non-COPD group and the COPD group.
Conclusion: In non-COPD aging men with smoking history, trends toward reduced nutritional status and anemia may independently emerge in blood components along with decreased lung function even before COPD onset.
Keywords: anemia, chronic obstructive pulmonary disease, lung function, nutritional assess-ment, nutritional status, smoking
Introduction
The prevalence of chronic obstructive pulmonary disease (COPD) is increasing with the aging of society.1,2 Cigarette smoking and advanced age are risk factors for COPD,3
which not only decreases individual quality of life (QOL),4 but it also imposes a high
burden of medical cost on the economy.1 Although the Global Initiative for Chronic
Obstructive Lung Disease defines COPD as a preventable and treatable disease,3
prevention is obviously much more important than treatment.
COPD is now recognized as a systemic disease.5 One of the systemic effects of COPD
is the presence of nutritional abnormalities that causes body weight loss.5 Approximately
50% of patients with severe COPD and 10% to 15% of those in the mild to moderate stage suffer body weight loss, possibly due to hypermetabolism.6 Decreases in body weight,7
body mass index (BMI),8,9 and fat-free mass index9 have been reported to be
associ-ated with mortality in patients with COPD. In this context, many clinical studies have investigated the efficacy of nutritional support for patients with COPD, which, however, remains controversial. A meta-analysis by Ferreira et al indicated that nutritional support had no significant effect on anthropometric measures in patients with stable COPD.10
This suggests that nutritional support for COPD patients to maintain healthy body
International Journal of Chronic Obstructive Pulmonary Disease downloaded from https://www.dovepress.com/ by 118.70.13.36 on 22-Aug-2020
For personal use only.
Number of times this article has been viewed
Dovepress
Shiozawa et al
weight and composition is difficult. Moreover, COPD patients tend to have nutrition-related comorbidities such as diabetes and anemia,11 implying that patients with COPD likely have
impaired metabolism or nutritional abnormalities. However, little is known about the association between lung function and nutritional status in those with risk factors for COPD, such as cigarette smoking and advanced age, but not falling under the category of COPD. Knowledge of this association is expected to be useful in the prevention of COPD.
In the present study, we tested the hypothesis that reduced lung function is associated with lower blood markers of nutritional status in non-COPD aging men with smoking history. In addition to an urgent need to prevent COPD, the fact that the cut-off point for COPD – forced expiratory vol-ume in one second (FEV1) as percent of forced vital capacity (FVC) (FEV1/FVC) ,70% – has been used for pragmatic simplicity12 without adequate medical evidence to support
it13 seems to justify the necessity of the present study.
Subjects and methods
Study design
This cross-sectional study examined the association between lung function and blood markers of nutritional status in non-COPD aging men with smoking history. Each eligible subject was asked to visit Okayama University Hospital Misasa Medical Center three times during the study. At the first visit, written informed consent was obtained; at the second visit, anthropometric measurements, blood sampling, and spirometry testing were conducted, followed by distribution of in-home, self-administered questionnaires on diet and lifestyle; and at the third visit, the completed questionnaires were collected and detailed interviews carried out by a registered dietician about their answers. The protocol of the present study was approved by the Ethics Committee of the Graduate School of Medicine, Dentistry and Pharmaceutical Sciences, Okayama University.
Subjects
Male current or former smokers aged 50 to 80 years were recruited in one of the following two ways: recruitment of COPD outpatients at Okayama University Hospital Misasa Medical Center or recruitment of those who had never been diagnosed with COPD and participated in a health promo-tion program in a rural town in Tottori Prefecture, located in the western part of Japan. The exclusion criteria were: 1) those who had been given dietary advice by medical staff (eg, physician or registered dietician) and confirmed that they were in compliance with the advice; 2) those taking
drugs for hyperlipidemia, hyperglycemia, or diabetes; and 3) those who had suffered from a COPD exacerbation within the previous month.
Anthropometric, blood, and lung function
measurements
At the second visit, each subject arrived at Okayama University Hospital Misasa Medical Center between 08:30 and 10:00 AM after overnight fasting. After measurements of height and abdominal circumference at the level of the umbilicus, body weight, BMI, and percent of body muscle were measured with a body composition analyser (DF860K, Yamato Scale Co., Ltd., Akashi, Hyogo, Japan) using the bioelectrical imped-ance analysis method. Then, fasting blood was drawn from an antecubital vein in a sitting position for determining red blood cell count (RBCc), white blood cell count (WBCc), and levels of hemoglobin (Hb), hematocrit, total protein (TP), albumin, triglyceride, total cholesterol (TC), LDL-cholesterol (LDL-c), HDL-cholesterol (HDL-c), glucose, and HbA1c. The concen-trations of the blood components listed above were measured using automatic analysers: XT-2000i (Sysmex America Inc., Mundelein, IL, USA) for RBCc, WBCc, Hb, and hematocrit; and Dimension® Xpand® (Siemens Healthcare Diagnostics
Inc., Deerfield, IL, USA) for TP, albumin, triglyceride, TC, LDL-c, HDL-c, glucose, and HbA1c. Anthropometric mea-surements and blood sampling were conducted by nurses. After blood sampling, spirometry testing was performed by a well-trained clinical technologist to assess FEV1/FVC and predicted forced expiratory volume in one second (FEV1% pred) according to the COPD guidelines of The Japan Respi-ratory Society 2004.14 Subjects never before diagnosed with
COPD underwent spirometry testing without a bronchodilator. Both the subjects with FEV1/FVC , 70% at the first test and COPD outpatients were asked to inhale 200 µg of salbutamol according to pharmacists’ instructions to avoid the effects of airway reversibility; 30 min after inhalation, spirometry testing was performed. Those with FEV1/FVC , 70% after bronchodilator administration were diagnosed with COPD. For subjects who inhaled salbutamol, post-bronchodilator values were used for data analysis.
Dietary assessment
Food and nutrient consumption was calculated using Excel Eiyo-kun FFQg software (version 2.0; Kenpakusha, Tokyo, Japan), a semiquantitative food frequency questionnaire based on the fifth revised and enlarged edition of the Standard Tables of Food Composition in Japan. The respondents were asked about their usual dietary intake per week for
International Journal of Chronic Obstructive Pulmonary Disease downloaded from https://www.dovepress.com/ by 118.70.13.36 on 22-Aug-2020
Dovepress nutritional blood markers in non-COPD aging men with smoking history
the previous month. Dietary interviews were conducted by registered dieticians using food models in order to increase the precision of the dietary intake estimate.
Lifestyle questionnaire
In the lifestyle questionnaire, subjects were asked about their medical history, medication use, smoking status, pack-years, and history of occupational dust exposure. To estimate pack-years as precisely as possible, original graph paper sheets (95 × 140 mm) were prepared with the X-axis indicating age (10 to 85 years, at 5-year intervals) and the Y-axis indi-cating the number of cigarettes smoked per day at each age (0 to 100 cigarettes, at intervals of 10 cigarettes). During the interview, subjects were asked about their graphs, and where necessary, age and the number of cigarettes were corrected. Then, pack-years were calculated from the graph using the trapezoidal method, and the duration of the current period of smoking cessation was obtained.
Statistical analysis
First, subjects were assigned to the COPD group (the refer-ence group) or the non-COPD group, and the non-COPD group was then divided into groups according to FEV1/FVC results so that each group contained approximately the same number of subjects as the COPD group. The subjects’ charac-teristics are presented as means ± standard deviation (SD) or percent. Values of blood test results and dietary intake in each subject group were expressed as adjusted means or geometric means and 95% confidence intervals, using analysis of covari-ance (ANCOVA). Tests for linear trend across subject groups were performed by treating FEV1/FVC as a continuous vari-able in multiple linear regression analyses. In ANCOVAs and multiple linear regression analyses, the following potential confounders were considered and included: age, BMI, percent of body muscle, total energy intake (kcal⋅day−1), pack-years,
pack-years squared, current duration of smoking cessation (years), and history of occupational dust exposure (,1 year or $1 year). Variables that showed an extremely skewed dis-tribution were transformed to natural logarithms (ln) (ln(X) or ln(X + 1)) for data analysis and then back-transformed to the original values. Statistical analysis was performed using SPSS version 16.0 J for Windows (SPSS Inc., Chicago, IL, USA), and a P-value ,0.05 (two-sided) was considered statistically significant.
Results
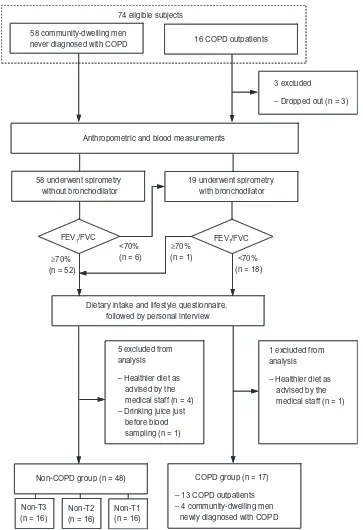
Written informed consent was obtained from 74 men. Of these, 3 dropped out, and 6 were excluded because of their
healthier diet as advised by the medical staff (n = 5), and drinking juice just before blood drawing (n = 1). Therefore, 65 subjects were included in the study (Figure 1).
Of these subjects, 17 were in the COPD group and 48 were in the non-COPD group. The distribution of the disease sever-ity in the COPD group was as follows: 3 men with mild; 9 with moderate; 4 with severe; and 1 with very severe disease. The non-COPD group was divided into tertiles (non-T3, top; non-T2, middle; non-T1, bottom tertile) according to FEV1/ FVC level for data analysis (Table 1).
Table 2 describes each group’s characteristics. The sub-jects with lower FEV1/FVC tended to be older and to have lower height, weight, and BMI. The COPD group apparently had lower body muscle and total energy intake. The non-T1 and COPD groups had a greater number of pack-years and longer histories of occupational dust exposure than the non-T3 and non-T2 groups.
Table 3 shows the blood results for each group adjusted for potential confounders. Lower FEV1/FVC was significantly associated with lower RBCc, Hb, hematocrit, and TP, which are markers of anemia and nutritional status, in all adjusted models. RBCc and TP decreased by approximately 5% to 6% between non-T3 and non-T1; this difference was larger than that observed between the non-T1 and COPD groups. Albumin showed a similar trend to RBCc and TP, but it was not statistically significant after adjustment for all potential confounders, including smoking variables and history of occupational dust exposure. In relation to fat metabolism, LDL-c was significantly lower with decreased FEV1/FVC in all adjusted models. There was a similar decreasing trend for TC, but it was not statistically significant after adjustment for age, BMI, percent of body muscle, and total energy intake. FEV1/FVC showed no association with glucose and HbA1c, which were similar across subject groups.
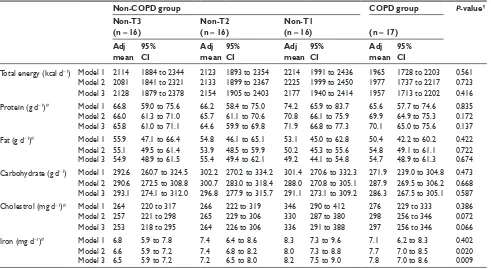
Table 4 shows the adjusted dietary intake for each group. FEV1/FVC was not associated with intake of total energy, protein, fat, or carbohydrate. However, iron intake tended to increase as FEV1/FVC decreases after adjustment for age, BMI, percent of body muscle, and energy intake. More-over, the inverse association of FEV1/FVC with iron intake remained strong after further adjustment for smoking vari-ables and history of occupational dust exposure. Although cholesterol intake showed a similar trend to that of iron, it was not statistically significant.
Discussion
The present study investigated a potential association between lung function and blood markers of nutritional status in male
International Journal of Chronic Obstructive Pulmonary Disease downloaded from https://www.dovepress.com/ by 118.70.13.36 on 22-Aug-2020
Dovepress
Shiozawa et al
current or former smokers. This study was unique in that non-COPD subjects were categorized into three groups based on FEV1/FVC tertiles. In contrast, most previous studies in this field simply compared the COPD group with the non-COPD group without further dividing the subjects with non-COPD into groups. COPD is now defined as a preventable disease;3
therefore, from the perspective of prevention, it is important
to focus on those with risk factors such as smoking history and advanced age but who do not fulfil the COPD diagnostic criteria, especially men with an FEV1/FVC close to 70%.
Our main results were as follows: (1) lower FEV1/FVC was linearly associated with lower RBCc, Hb, hematocrit, TP, and LDL-c after adjustments for all potential confounders; (2) FEV1/FVC was not associated with intake of total energy,
58 community-dwelling men
never diagnosed with COPD 16 COPD outpatients
3 excluded
– Dropped out (n = 3)
Anthropometric and blood measurements
58 underwent spirometry without bronchodilator
FEV1/FVC
Dietary intake and lifestyle questionnaire, followed by personal interview
<70% (n = 6)
≥70% (n = 52)
74 eligible subjects
1 excluded from analysis
– Healthier diet as advised by the medical staff (n = 1)
Non-COPD group (n = 48)
5 excluded from analysis
– Healthier diet as advised by the medical staff (n = 4) – Drinking juice just
before blood sampling (n = 1)
19 underwent spirometry with bronchodilator
FEV1/FVC
≥70%
(n = 1) <70%
(n = 18)
COPD group (n = 17)
– 13 COPD outpatients – 4 community-dwelling men
newly diagnosed with COPD Non-T2
(n = 16)
Non-T1 (n = 16) Non-T3
(n = 16)
Figure 1 Subject flow diagram.
Abbreviations: COPD,chronic obstructive pulmonary disease; FeV1/FVC, forced expiratory volume in one second as percent of forced vital cavity; T, tertile.
International Journal of Chronic Obstructive Pulmonary Disease downloaded from https://www.dovepress.com/ by 118.70.13.36 on 22-Aug-2020
Dovepress nutritional blood markers in non-COPD aging men with smoking history
protein, fat, carbohydrate, or cholesterol. Together, these results support our hypothesis that reduced lung function is associated with reduced nutritional status in non-COPD aging men with smoking history. This suggests that in those men, trends toward reduced nutritional status and anemia may emerge indepen-dently as changes in blood test results, along with decreased lung function, even before the onset of COPD.
TP and albumin are markers of nutritional status.15 In the
present study, FEV1/FVC was linearly associated with TP in all adjusted models, and the decrease in adjusted TP between the non-T3 and non-T1 groups was larger than that between the non-T1 and COPD groups. Nevertheless, FEV1/FVC was not associated with adjusted intake of total energy and nutrients, except iron. To the best of our knowledge, this is the first study to report that decreasing degree of TP in non-COPD aging men with smoking history could be comparable to or greater than that in COPD patients. In contrast to TP, the association between albumin and FEV1/FVC was slight. One possible explanation for this is that albumin is pooled in the extravascular space and is then mobilized to the intravascular space as needed with its
degradation rate decreasing, which allows a relatively constant blood level to be maintained.16–18
COPD has been reported to be associated with anemia,19,20
which is causally related to dyspnoea, reduced exercise capacity,21 and health-related QOL.22 The mechanism of COPD
is believed to be similar to that of other chronic diseases. In patients with chronic diseases, elevated levels of inflammatory cytokines could shorten RBC survival, impair mobilization or utilization of iron, and impair the marrow erythropoietic response.19,23 In the present study, lower FEV
1/FVC was
lin-early associated with lower RBCc, Hb, and hematocrit after adjustments for all potential confounders. In contrast, FEV1/ FVC was inversely associated with adjusted iron intake; sub-jects with a lower FEV1/FVC had a greater iron intake. These findings suggest that RBC dysregulation, in which impaired utilization of iron is implicated, could occur in male current or former smokers as FEV1/FVC decreases even before the onset of COPD. It has been shown that cigarette smoking alters iron homeostasis, greatly increases lung iron concentration, and generates oxidative stress and inflammation,24 which may
increase the iron requirement. A meta-analysis by Gan et al indicated that WBCc may be a useful marker of systemic inflammation in COPD patients.25 Van Hoydonck et al reported
that male current smokers and female current or former smokers had greater iron intake than male former smokers and female never smokers, respectively.26 In the present study,
WBCc and iron intake in the non-T1 and COPD groups were greater than those in the non-T3 and non-T2 groups, implying that there is an association between inflammation and iron requirement in male current or former smokers, even before
Table 2 Subjects’ characteristics
Non-COPD group COPD
group
Non-T3 Non-T2 Non-T1
Subjects (n) 16 16 16 17
Age (yrs) 60 ± 6 60 ± 7 65 ± 6 70 ± 7
height (cm) 169 ± 7 169 ± 3 164 ± 5 165 ± 7
Weight (kg) 69 ± 10 63 ± 7 60 ± 9 60 ± 7
BMI (kg⋅m−2) 24.1 ± 2.2 22.2 ± 2.3 22.2 ± 2.8 22.1 ± 2.7
Body muscle (%) 32 ± 3 33 ± 2 32 ± 3 30 ± 5
Body fat (%) 24 ± 5 21 ± 6 20 ± 7 23 ± 7
Abdominal circumference (cm) 87 ± 6 83 ± 7 82 ± 9 84 ± 8
Total energy intake (kcal⋅d−1) 2137 ± 260 2148 ± 414 2206 ± 545 1927 ± 490 Smoking status
Current smoker (n) 7 (44) 7 (44) 9 (56) 5 (29)
Former smoker (n) 9 (56) 9 (56) 7 (44) 12 (71)
Current duration of smoking cessation in former smokers (yrs)
6.9 ± 5.3 14.4 ± 10.9 8.7 ± 6.7 10.8 ± 9.2
Pack-years 45 ± 13 32 ± 19 53 ± 18 52 ± 32
history of occupational dust exposure $1 year (n) 1 (6) 4 (25) 7 (44) 7 (41)
Notes: Data are presented as mean ± SD, n or n (%).
Abbreviations: BMI, body mass index; COPD, chronic obstructive pulmonary disease; T, tertile.
Table 1 Classification of subjects according to FEV1/FVC
Subjects n FEV1/FVC %
Min to max Mean ± SD
non-COPD group
non-T3 16 78.9 to 85.4 81.5 ± 2.4
non-T2 16 73.5 to 78.7 75.7 ± 1.7
non-T1 16 70.1 to 73.3 71.9 ± 1.1
COPD group 17 31.0 to 67.7 52.4 ± 11.0
Abbreviations: COPD, chronic obstructive pulmonary disease; FeV1/FVC, forced
expiratory volume in one second as percent of forced vital cavity; T, tertile.
International Journal of Chronic Obstructive Pulmonary Disease downloaded from https://www.dovepress.com/ by 118.70.13.36 on 22-Aug-2020
Dovepress
Shiozawa et al
Table 3 Association between FeV1/FVC and adjusted blood components
Non-COPD group COPD group P-value
Non-T3 (n = 16)
Non-T2 (n = 16)
Non-T1
(n = 16) (n = 17)
Adj mean
95% CI
Adj mean
95% CI
Adj mean
95% CI
Adj mean
95% CI
rBC (106⋅µl−1) Model 1 4.94 4.77 to 5.10 4.81 4.65 to 4.98 4.64 4.48 to 4.80 4.52 4.36 to 4.69 ,0.001 Model 2 4.93 4.76 to 5.09 4.83 4.67 to 4.99 4.62 4.47 to 4.78 4.54 4.37 to 4.70 ,0.001 Model 3 4.96 4.79 to 5.13 4.80 4.63 to 4.97 4.64 4.48 to 4.80 4.52 4.35 to 4.69 ,0.001 WBC (103⋅µl−1) Model 1 5.77 4.92 to 6.61 5.39 4.54 to 6.23 6.63 5.81 to 7.45 6.69 5.82 to 7.56 0.075
Model 2 5.66 4.78 to 6.54 5.41 4.55 to 6.26 6.73 5.90 to 7.56 6.68 5.79 to 7.57 0.051 Model 3 5.66 4.77 to 6.55 5.54 4.65 to 6.43 6.68 5.83 to 7.52 6.60 5.72 to 7.48 0.081 hb (g⋅dl−1) Model 1 15.2 14.8 to 15.7 15.0 14.6 to 15.4 14.9 14.5 to 15.3 14.3 13.9 to 14.8 0.014 Model 2 15.2 14.8 to 15.7 15.0 14.6 to 15.5 14.9 14.5 to 15.3 14.3 13.9 to 14.8 0.013 Model 3 15.4 14.9 to 15.8 15.0 14.5 to 15.5 14.9 14.4 to 15.3 14.2 13.8 to 14.7 0.003 hematocrit (%) Model 1 46.7 45.4 to 47.9 46.2 44.9 to 47.4 45.7 44.5 to 46.9 44.0 42.7 to 45.3 0.008 Model 2 46.7 45.4 to 48.0 46.2 45.0 to 47.5 45.6 44.4 to 46.8 44.0 42.7 to 45.3 0.008 Model 3 47.1 45.7 to 48.4 46.2 44.9 to 47.5 45.5 44.3 to 46.8 43.8 42.5 to 45.1 0.002 TP (g⋅dl−1) Model 1 7.9 7.7 to 8.1 7.7 7.4 to 7.9 7.5 7.3 to 7.7 7.4 7.2 to 7.6 ,0.001
Model 2 7.9 7.7 to 8.1 7.7 7.5 to 7.9 7.5 7.3 to 7.7 7.4 7.1 to 7.6 ,0.001 Model 3 7.9 7.7 to 8.2 7.7 7.5 to 7.9 7.5 7.3 to 7.7 7.3 7.1 to 7.6 ,0.001 Albumin (g⋅dl−1)# Model 1 4.2 4.0 to 4.3 4.1 4.0 to 4.2 4.1 4.0 to 4.2 4.0 3.8 to 4.1 0.032
Model 2 4.2 4.0 to 4.3 4.1 4.0 to 4.2 4.1 3.9 to 4.2 4.0 3.8 to 4.1 0.036 Model 3 4.2 4.0 to 4.3 4.1 4.0 to 4.3 4.1 3.9 to 4.2 4.0 3.8 to 4.1 0.066 Trigryceride (mg⋅dl−1)# Model 1 154 122 to 195 108 85 to 137 120 96 to 151 115 90 to 147 0.139 Model 2 141 112 to 178 111 89 to 139 121 97 to 150 121 96 to 153 0.462 Model 3 143 114 to 180 112 89 to 140 121 97 to 150 119 95 to 149 0.366 TC (mg⋅dl−1) Model 1 219 204 to 235 205 190 to 221 190 175 to 206 198 182 to 214 0.040 Model 2 220 203 to 236 204 189 to 221 190 174 to 206 199 182 to 215 0.053 Model 3 220 203 to 238 208 190 to 225 187 171 to 203 198 181 to 215 0.045 LDL-c (mg⋅dl−1) Model 1 140 125 to 155 121 106 to 136 102 87 to 117 114 98 to 130 0.011 Model 2 139 123 to 155 121 106 to 137 102 87 to 118 114 98 to 130 0.021 Model 3 139 123 to 155 127 110 to 143 97 82 to 113 114 97 to 130 0.015 hDL-c (mg⋅dl−1) Model 1 49 44 to 55 56 50 to 62 58 53 to 64 52 46 to 58 0.379
Model 2 52 46 to 58 55 49 to 60 57 52 to 63 52 46 to 57 0.862
Model 3 52 46 to 58 53 47 to 59 58 53 to 64 52 46 to 58 0.749
glucose (mg⋅dl−1) Model 1 102 96 to 107 101 96 to 106 103 98 to 108 101 96 to 107 0.956 Model 2 100 95 to 106 102 97 to 107 104 99 to 109 101 96 to 107 0.637 Model 3 100 94 to 106 101 96 to 107 104 99 to 109 102 96 to 107 0.597 hbA1c (%)# Model 1 5.4 5.2 to 5.5 5.3 5.2 to 5.5 5.3 5.2 to 5.5 5.4 5.3 to 5.6 0.797 Model 2 5.4 5.2 to 5.5 5.3 5.2 to 5.5 5.3 5.2 to 5.5 5.4 5.2 to 5.6 0.718 Model 3 5.4 5.2 to 5.5 5.3 5.2 to 5.5 5.3 5.2 to 5.5 5.4 5.2 to 5.6 0.762
Notes: Model 1, adjusted for age; Model 2, adjusted for age, body mass index, percent of body muscle, and total energy intake; Model 3, adjusted for all variables in Model 2 plus pack-years, pack-years squared, current-duration of smoking cessation, and history of occupational dust exposure $1 year; #log transformed for data analysis to improve normality,
and back transformed to present data; ¶test for linear trend across groups was performed by treating FeV
1/FVC as a continuous variable in multiple linear regression analysis.
Abbreviations: Adj, adjusted; COPD, chronic obstructive pulmonary disease; CI, confidence interval; FEV1/FVC, forced expiratory volume in one second as percent of forced
vital cavity; hb, hemoglobin; hDL-c, hDL-cholesterol; LDL-c, LDL-cholesterol; rBC, red blood cell; T, tertile; TC, total cholesterol; TP, total protein; WBC, white blood cell.
the onset of COPD. In the present study, the levels of anemia markers in each subject group were all within the normal range, which can be explained as follows: first, the prevalence of anemia is actually not very high, even in COPD patients. In a cross-sectional study by John et al,20 the prevalence of
anemia in COPD patients was 13%, and that in a retrospective study by Cote et al21 was 17%. Second, three-fourths of the
subjects in the present study were in the non-COPD group.
Further studies focusing on associations between FEV1/FVC and serum iron, transferrin, ferritin, transferrin receptor, and inflammatory cytokines in male current or former smokers with non-COPD are needed.
Although several previous studies have reported an associa-tion between lung funcassocia-tion and diabetes,27 most used FEV
1 or
FVC, not FEV1/FVC, as markers of lung function, which seems to be insufficient to evaluate whether chronic airflow obstruction
International Journal of Chronic Obstructive Pulmonary Disease downloaded from https://www.dovepress.com/ by 118.70.13.36 on 22-Aug-2020
Dovepress nutritional blood markers in non-COPD aging men with smoking history
Table 4 Association between FeV1/FVC and adjusted dietary intake
Non-COPD group COPD group P-value
Non-T3 (n = 16)
Non-T2 (n = 16)
Non-T1
(n = 16) (n = 17)
Adj mean
95% CI
Adj mean
95% CI
Adj mean
95% CI
Adj mean
95% CI
Total energy (kcal⋅d−1) Model 1 2114 1884 to 2344 2123 1893 to 2354 2214 1991 to 2436 1965 1728 to 2203 0.561 Model 2 2081 1841 to 2321 2133 1899 to 2367 2225 1999 to 2450 1977 1737 to 2217 0.723 Model 3 2128 1879 to 2378 2154 1905 to 2403 2177 1940 to 2414 1957 1713 to 2202 0.416 Protein (g⋅d−1)# Model 1 66.8 59.0 to 75.6 66.2 58.4 to 75.0 74.2 65.9 to 83.7 65.6 57.7 to 74.6 0.835 Model 2 66.0 61.3 to 71.0 65.7 61.1 to 70.6 70.8 66.1 to 75.9 69.9 64.9 to 75.3 0.172 Model 3 65.8 61.0 to 71.1 64.6 59.9 to 69.8 71.9 66.8 to 77.3 70.1 65.0 to 75.6 0.137 Fat (g⋅d−1)# Model 1 55.9 47.1 to 66.4 54.8 46.1 to 65.1 53.1 45.0 to 62.8 50.4 42.2 to 60.2 0.422 Model 2 55.1 49.5 to 61.4 53.9 48.5 to 59.9 50.2 45.3 to 55.6 54.8 49.1 to 61.1 0.722 Model 3 54.9 48.9 to 61.5 55.4 49.4 to 62.1 49.2 44.1 to 54.8 54.7 48.9 to 61.3 0.674 Carbohydrate (g⋅d−1) Model 1 292.6 260.7 to 324.5 302.2 270.2 to 334.2 301.4 270.6 to 332.3 271.9 239.0 to 304.8 0.473 Model 2 290.6 272.5 to 308.8 300.7 283.0 to 318.4 288.0 270.8 to 305.1 287.9 269.5 to 306.2 0.668 Model 3 293.1 274.1 to 312.0 296.8 277.9 to 315.7 291.1 273.1 to 309.2 286.3 267.5 to 305.1 0.587 Cholestrol (mg⋅d−1)# Model 1 264 220 to 317 266 222 to 319 346 290 to 412 276 229 to 333 0.386 Model 2 257 221 to 298 265 229 to 306 330 287 to 380 298 256 to 346 0.072 Model 3 253 218 to 295 264 226 to 306 336 291 to 388 297 256 to 346 0.066 Iron (mg⋅d−1)# Model 1 6.8 5.9 to 7.8 7.4 6.4 to 8.6 8.3 7.3 to 9.6 7.1 6.2 to 8.3 0.402 Model 2 6.6 5.9 to 7.2 7.4 6.8 to 8.2 8.0 7.3 to 8.8 7.7 7.0 to 8.5 0.020 Model 3 6.5 5.9 to 7.2 7.2 6.5 to 8.0 8.2 7.5 to 9.0 7.8 7.0 to 8.6 0.009
Notes: Model 1, adjusted for age; Model 2, adjusted for age, body mass index, percent of body muscle, and total energy intake (except for analysis of total energy intake); Model 3, adjusted for all variables in Model 2 plus pack-years, pack-years squared, current-duration of smoking cessation, and history of occupational dust exposure $1 year;
#log transformed for data analysis to improve normality, and back transformed to present data; ¶test for linear trend across groups was performed by treating FeV 1/FVC as
a continuous variable in multiple linear regression analysis.
Abbreviations: Adj, adjusted; CI, confidence interval; COPD, chronic obstructive pulmonary disease; FEV1/FVC, forced expiratory volume in one second as percent of
forced vital cavity; T, tertile.
is related to glucose metabolism. In the present study, FEV1/ FVC was not associated with glucose or HbA1c, suggesting that chronic airflow obstruction is not independently associated with glucose control. The present result was consistent with that of a large prospective study by Ford et al,28 in which FEV
1, FVC,
and FEV1% pred were significantly negatively associated with the incidence of diabetes, whereas FEV1/FVC was not. In the present study, subjects who took drugs for hyperglycemia or diabetes were excluded so that medication use did not mask impaired glucose control, which may also result in the disas-sociation of FEV1/FVC with glucose and HbA1c.
The present study had several limitations. First, we cannot completely rule out the possibility of chance due to relatively small sample size. In spite of the relatively small sample size, however, it was noted that lower FEV1/FVC was significantly associated with lower TP and Hb, and future studies are warranted to confirm these results in larger samples. Second, while it is essential to consider physical activity for nutritional assessment, the data on physical activity was not available in the present study; this may somewhat confound associations between FEV1/FVC and nutritional markers. Although it has been reported that men with COPD have elevated resting energy expenditure29,30 or daily activity energy expenditure,31,32
most subjects had relatively high FEV1/FVC, and it is less likely that the present findings are fully explained by the resid-ual confounding. Although it remains unknown whether energy expenditure tended to be elevated among men whose FEV1/ FVC fell close to 70%, future studies should aim to reduce the confounding due to physical activity by measuring resting energy expenditure and daily activity energy expenditure.
In summary, the present study shows that lower FEV1/ FVC is independently linearly associated with lower blood markers of nutritional status and anemia. The present results suggest that, in non-COPD aging men with smoking history, slight but significant trends toward reduced nutritional status and anemia may emerge along with decreased lung function even before the onset of COPD. Further studies are needed to examine the mechanism by which disease progression occurs in current or former smokers with non-COPD.
Acknowledgments
We would like to thank the staff at Okayama University Hospital Misasa Medical Center and subjects for participating in the present study, and A Maeda and S Asakura (Division of Health and Welfare, Misasa town office, Tottori, Japan) for recruitment of subjects and excellent cooperation.
International Journal of Chronic Obstructive Pulmonary Disease downloaded from https://www.dovepress.com/ by 118.70.13.36 on 22-Aug-2020
International Journal of COPD
Publish your work in this journal
Submit your manuscript here: http://www.dovepress.com/international-journal-of-copd-journal
The International Journal of COPD is an international, peer-reviewed journal of therapeutics and pharmacology focusing on concise rapid reporting of clinical studies and reviews in COPD. Special focus is given to the pathophysiological processes underlying the disease, intervention programs, patient focused education, and self management protocols.
This journal is indexed on PubMed Central, MedLine and CAS. The manuscript management system is completely online and includes a very quick and fair peer-review system, which is all easy to use. Visit http://www.dovepress.com/testimonials.php to read real quotes from published authors.
Dovepress
Dovepress
Shiozawa et al
Disclosure
The authors report no conflicts of interest in this work.
References
1. Nishimura S, Zaher C. Cost impact of COPD in Japan: opportunities and challenges? Respirology. 2004;9(4):466–473.
2. Feenstra TL, van Genugten ML, Hoogenveen RT, Wouters EF, Rutten-van Mölken MP. The impact of aging and smoking on the future burden of chronic obstructive pulmonary disease: A model analysis in the Netherlands. Am J Respir Crit Care Med. 2001;164(4):590–596. 3. Global Initiative for Chronic Obstructive Lung Disease. Global strategy
for the diagnosis, management, and prevention of chronic obstructive pulmonary disease [guideline on the Internet]; p. 16 [updated December, 2009; cited January 8, 2010]. Available from: http://www.goldcopd. com. Accessed January 15, 2010.
4. Carrasco Garrido P, de Miguel Díez J, Rejas Gutiérrez J, et al. Negative impact of chronic obstructive pulmonary disease on the health-related quality of life of patients. Results of the EPIDEPOC study. Health Qual Life Outcomes. 2006;4:31.
5. Agustí AG, Noguera A, Sauleda J, Sala E, Pons J, Busquets X. Sys-temic effects of chronic obstructive pulmonary disease. Eur Respir J. 2003;21(2):347–360.
6. Creutzberg EC, Schols AM, Bothmer-Quaedvlieg FC, Wouters EF. Prevalence of an elevated resting energy expenditure in patients with chronic obstructive pulmonary disease in relation to body composition and lung function. Eur J Clin Nutr. 1998;52(6):396–401.
7. Prescott E, Almdal T, Mikkelsen KL, Tofteng CL, Vestbo J, Lange P. Prognostic value of weight change in chronic obstructive pulmonary disease: results from the Copenhagen City Heart Study. Eur Respir J. 2002;20(3):539–544.
8. Landbo C, Prescott E, Lange P, Vestbo J, Almdal TP. Prognostic value of nutritional status in chronic obstructive pulmonary disease. Am J Respir Crit Care Med. 1999;160(6):1856–1861.
9. Vestbo J, Prescott E, Almdal T, et al. Body mass, fat-free body mass, and prognosis in patients with chronic obstructive pulmonary disease from a random population sample: findings from the Copenhagen City Heart Study. Am J Respir Crit Care Med. 2006;173(1):79–83. 10. Ferreira IM, Brooks D, Lacasse Y, Goldstein RS, White J. Nutritional
supplementation for stable chronic obstructive pulmonary disease.
Cochrane Database Syst Rev. 2005;(2):CD000998.
11. Barnes PJ, Celli BR. Systemic manifestations and comorbidities of COPD. Eur Respir J. 2009;33(5):1165–1185.
12. Mannino DM, Sonia Buist A, Vollmer WM. Chronic obstructive pulmo-nary disease in the adult: what defines abnormal lung function? Thorax. 2007;62(3):237–241.
13. Swanney MP, Ruppel G, Enright PL, et al. Using the lower limit of normal for the FEV1/FVC reduces the misclassification of airway obstruction. Thorax. 2008;63(12):1046–1051.
14. Committee for the Second Edition of the COPD Guidelines of The Japanese Respiratory Society. Guidelines for the Diagnosis and Treat-ment of COPD. 2nd ed. Pocket Guide. [guideline on the Internet]; pp. 6–7 [updated July 9, 2009; cited December 20, 2009]. Available from: http://www.jrs.or.jp/quicklink/glsm/guideline/nopass_pdf/ copd_summary_e.pdf. Accessed January 7, 2010.
15. Mazolewski P, Turner JF, Baker M, Kurtz T, Little AG. The impact of nutritional status on the outcome of lung volume reduction surgery: A prospective study. Chest. 1999;116(3):693–696.
16. James WP, Hay AM. Albumin metabolism: Effect of the nutritional state and the dietary protein intake. J Clin Invest. 1968:47(9):1958–1972. 17. Omran ML, Morley JE. Assessment of protein energy
malnutri-tion in older persons, Part II: Laboratory evaluamalnutri-tion. Nutrition. 2000;16(2):131–140.
18. Nehra V. Nutritional disorders. In: Hauser SC, Pardi DS, Poterucha JJ, editors. Mayo Clinic Gastroenterology and Hepatology Board Review. Rochester, Minnesota: Mayo Clinic Scientific Press; 2003: 107–110. 19. Similowski T, Agustí A, MacNee W, Schönhofer B. The potential
impact of anemia of chronic disease in COPD. Eur Respir J. 2006;27(2):390–396.
20. John M, Hoernig S, Doehner W, Okonko DD, Witt C, Anker SD. Anemia and inflammation in COPD. Chest. 2005;127(3):825–829.
21. Cote C, Zilberberg MD, Mody SH, Dordelly LJ, Celli B. Haemoglobin level and its clinical impact in a cohort of patients with COPD. Eur Respir J. 2007;29(5):923–929.
22. Krishnan G, Grant BJ, Muti PC, et al. Association between anemia and quality of life in population sample of individuals with chronic obstructive pulmonary disease. BMC Pulm Med. 2006;6:23. 23. Eisenstaedt R, Penninx BW, Woodman RC. Anemia in the elderly:
Current understanding and emerging concepts. Blood Rev. 2006;20(4):213–226.
24. Ghio AJ. Disruption of iron homeostasis and lung disease. Biochim Biophys Acta. 2009;1790(7):731–739.
25. Gan WQ, Man SF, Senthilselvan A, Sin DD. Association between chronic obstructive pulmonary disease and systemic inflammation: a systematic review and a meta-analysis. Thorax. 2004; 59(7):574–580. 26. Van Hoydonck PG, Temme EH, Schouten EG. Serum bilirubin con-centration in a Belgian population: the association with smoking status and type of cigarettes. Int J Epidemiol. 2001;30(6):1465–1472. 27. Lawlor DA, Ebrahim S, Smith GD. Associations of measures of
lung function with insulin resistance and Type 2 diabetes: findings from the British Women’s Heart and Health Study. Diabetologia. 2004;47(2):195–203.
28. Ford ES, Mannino DM. Prospective association between lung function and the incidence of diabetes. Diabetes Care. 2004;27(12):2966–2970. 29. Schols AM, Fredrix EW, Soeters PB, Westerterp KR, Wouters EF.
Rest-ing energy expenditure in patients with chronic obstructive pulmonary disease. Am J Clin Nutr. 1991;54(6):983–987.
30. Sergi G, Coin A, Marin S, et al. Body composition and resting energy expenditure in elderly male patients with chronic obstructive pulmonary disease. Respir Med. 2006;100(11):1918–1924.
31. Baarends EM, Schols AM, Pannemans DL, Westerterp KR, Wouters EF. Total free living energy expenditure in patients with severe chronic obstructive pulmonary disease. Am J Respir Crit Care Med. 1997;155(2):549–554.
32. Jeng C, Chang W, Wai PM, Chou CL. Comparison of oxygen con-sumption in performing daily activities between patients with chronic obstructive pulmonary disease and a healthy population. Heart Lung. 2003;32(2):121–130.
International Journal of Chronic Obstructive Pulmonary Disease downloaded from https://www.dovepress.com/ by 118.70.13.36 on 22-Aug-2020