Forward-backward multiplicity correlations in proton-proton
col-lisions from several GeV to LHC energies
L. Bravina1,a, J. Bleibel2,3, R. Emaus1, and E. Zabrodin1,4,5
1Department of Physics, University of Oslo, PB 1048 Blindern, N-0316 Oslo, Norway 2Max-Planck-Institut für Intelligente Systeme, Heisenbergstr. 3, D-70569 Stuttgart, Germany
3Institut für Augewandte Physik, Universität Tübingen, Auf der Morgenstelle 10, D-72076 Tübingen,
Ger-many
4Skobeltsyn Institute of Nuclear Physics, Moscow State University, RU-119991 Moscow, Russia
5National Research Nuclear University "MEPhI" (Moscow Engineering Physics Institute), Kashirskoe
high-way 31, Moscow, RU-115409, Russia
Abstract. Forward-backward multiplicity correlations inppcollisions at LHC energies are studied with the quark-gluon string model. Comparison with experimental data and with model calculations for lower energies is performed. The model correctly reproduces the linear slope of the correlations,�nB(nF)� = a+bcorrnF, in the whole energy inter-val. Positive correlations arise because of mixing of sub-processes with different mean multiplicities. The increase ofbcorrwith rising collision energy is linked to the increase of the variety of sub-processes going via the soft and hard multi-Pomeron exchanges.
For the events with fixed amount of Pomerons the correlation slopebcorris shown to be essentially zero.
1 Introduction
The first observation of significant positive correlations between the multiplicity of charged particles emitted in forward and backward hemispheres in ¯ppcollisions at ISR energies was considered as evi-dence of long range correlations between the “clusters" of fragmenting system [1]. This phenomenon has attracted a lot of attention, see e.g. [2–8] and references therein. Positive forward-backward (FB) correlations in multiplicity were found in hadronic interactions at energies from several GeV to
√s
=1.8 TeV [9–12]. In contrast, no significant FB correlations were observed ine+e−annihilation
at energies up to √s=93 GeV [13] and 133 GeV [14].
It appeared soon that the FB multiplicity correlations possessed the following properties:
- the linear dependence of the averaged multiplicity of charged particles emitted in forward (or backward) hemisphere on the multiplicity of charged particles emitted in the opposite hemisphere, i.e.,
�nB(nF)�=a+bcorrnF . (1)
0 2 4 6 8 10 12 1.8
2.2 2.6 3.0 3.4
3.8 (a)
0 2 4 6 8 10 12
(b) QGSM
Experimental: nondiffractive inelastic
nB
nF
Figure 1. (a): Dependence�nF�(nB) of charged particles in inelastic (solid circles) and nondiffractive (open circles) ¯ppcollisions at 32 GeV/c. Solid curve denotes the QGSM calculations.(b): The same as(a)but forpp interactions at 32 GeV/c.
The slope parameterbcorris defined as
bcorr= �(nF− �nF�)(nB− �nB�)�
�(nF− �nF�)2��(nB− �nB�)2�1/2 , (2)
wherenF andnBrepresent multiplicities of charged particles in forward and backward hemispheres,
respectively.
- the correlations reveal positive slopebcorrfor particles from the central region|xF|<0.1, whereas for particles from the fragmentation regions|xF|>0.1 the slope is consistent with zero
- the strength of the correlations increases with rising collision energy
- for events with very high particle multiplicity the correlation strength is weakened.
On a phenomenological level these features were explained by mixture of emitting clusters with different mean multiplicity [4]. To provide a linear dependence given by Eq. (1) the clusters should
obey the Poisson distribution [8].
We would like to present here our study of forward-backward multiplicity correlations within the quark-gluon string model (QGSM) [15] and its Monte Carlo version [16, 17]. The details of the model can be found in these Proceedings in [18]. QGSM was successfully applied for the description of FB correlations inppand ¯ppcollisions atplab =32 GeV/c[10], and recently in ppcollisions at LHC
energies 900 GeV≤ √s≤13 TeV [19]. Results of the both studies are presented below.
2 FB correlations in
pp
and
pp
¯
interactions at intermediate energies
In [10] the FB multiplicity correlations were studied in bothppand ¯ppcollisions atplab=32 GeV/c.
The experiments were carried out on the big bubble chamber “Mirabelle" (ITEP, Serpukhov). Figure 1 shows the�nF�(nB) dependence of charged particles measured in inelastic and in nondiffractiveppand
¯
ppinteractions. Calculations of QGSM are plotted onto the experimental results as well. The model
0 2 4 6 8 10 12 1.8
2.2 2.6 3.0 3.4
3.8 (a)
0 2 4 6 8 10 12
(b) QGSM
Experimental: nondiffractive inelastic
nB
nF
Figure 1. (a): Dependence�nF�(nB) of charged particles in inelastic (solid circles) and nondiffractive (open circles) ¯ppcollisions at 32 GeV/c. Solid curve denotes the QGSM calculations.(b): The same as(a)but forpp interactions at 32 GeV/c.
The slope parameterbcorris defined as
bcorr = �(nF− �nF�)(nB− �nB�)�
�(nF− �nF�)2��(nB− �nB�)2�1/2 , (2)
wherenF andnBrepresent multiplicities of charged particles in forward and backward hemispheres,
respectively.
- the correlations reveal positive slopebcorrfor particles from the central region|xF|<0.1, whereas for particles from the fragmentation regions|xF|>0.1 the slope is consistent with zero
- the strength of the correlations increases with rising collision energy
- for events with very high particle multiplicity the correlation strength is weakened.
On a phenomenological level these features were explained by mixture of emitting clusters with different mean multiplicity [4]. To provide a linear dependence given by Eq. (1) the clusters should
obey the Poisson distribution [8].
We would like to present here our study of forward-backward multiplicity correlations within the quark-gluon string model (QGSM) [15] and its Monte Carlo version [16, 17]. The details of the model can be found in these Proceedings in [18]. QGSM was successfully applied for the description of FB correlations inppand ¯ppcollisions at plab =32 GeV/c[10], and recently inppcollisions at LHC
energies 900 GeV≤ √s≤13 TeV [19]. Results of the both studies are presented below.
2 FB correlations in
pp
and
pp
¯
interactions at intermediate energies
In [10] the FB multiplicity correlations were studied in bothppand ¯ppcollisions atplab =32 GeV/c.
The experiments were carried out on the big bubble chamber “Mirabelle" (ITEP, Serpukhov). Figure 1 shows the�nF�(nB) dependence of charged particles measured in inelastic and in nondiffractiveppand
¯
ppinteractions. Calculations of QGSM are plotted onto the experimental results as well. The model
correctly reproduces the data. One can see that the slopebcorr of the distributions in ¯ppcollisions is steeper than that in ppcollisions. For both reactions, the FB multiplicity correlations seem to be stronger in inelastic collisions compared to non-single diffractive (NSD) ones.
(a) (b) (c)
(d) (e) (f)
(g) (h) (i)
Figure 2. Diagrams taken into account in QGSM in the modeling of ¯ppandppinteractions at intermediate energies: (a) planar, (b) cylinder, (c) undeveloped cylin-der, (d) binary, (e)-(f) single diffraction with low-mass and high-mass excitation, (g)-(j) annihilation diagrams.
2.2 2.6
3.0 (a)
cylindrical
1.6 2.0 2.4
(b) undeveloped cylinder
0.8 1.2 1.6
(c) diffraction diagrams
3.4 3.8 4.2
(d) annihilation
0 2 4 6 8 10
1.8 2.2 2.6
(e) planar
nB
nF
Figure 3.Dependencies�nF�(nB) for individual mech-anisms of ¯ppinteractions at 32 GeV/cin the QGSM: cylinder diagrams (a), undeveloped cylinder diagrams (b), diffraction diagrams (c), annihilation diagrams (d), and planar diagrams (e).
Table 1.Slope parametersbcorrof the forward-backward correlations in inelastic and NSDppand ¯ppcollisions at 32 GeV/c.
Reaction pp pp¯
non-single diffraction 0.070±0.009 0.177±0.010
inelastic 0.098±0.006 0.192±0.007
inelastic,|xF|<0.1 0.237±0.007 0.175±0.006 inelastic,|xF|>0.1 0.013±0.006 -0.073±0.006
0 10 20 30 0
5 10 15
<nB (nF
)>
0 20 40 60
0 10 20 30
0 20 40 60 80
0 20 40
UA5 data
0 20 40 60 80
0 20 40
0 20 40 60 80
nF 0
20 40 60
<nB (nF
)>
UA5 data
0 20 40 60 80 100 nF 0
20 40 60 80
0 20 40 60 80 100 nF 0
20 40 60 80
0 50 100 150
nF 0
50 100 150
20 GeV 200 GeV 546 GeV 630 GeV
900 GeV 1800 GeV 2360 GeV 14000 GeV
Figure 4.Dependencies�nB�(nF) for rapidity interval 0≤η≤4 in NSDppcollisions at 20 GeV≤ √s≤14 TeV. Data for 546 GeV and 900 GeV (from [3]) are shown by full squares.
For better understanding of the reason why the FB correlations in ¯ppcollisions are stronger at this energy than the FB correlations inppcollisions, we plot in Fig. 2 the set of diagrams employed in QGSM for treatment of both types of collisions at intermediate energies. Obviously, the variety of sub-processes in ¯ppinteractions is richer compared to that inpp ones, because, e.g., the planar
diagrams (a) and annihilation diagrams (g)-(i) are absent inppprocesses. Since more sub-processes
with different mean multiplicities contribute to particle production in ¯ppcollisions, the correlation
slope is steeper, i.e. bpp¯
corr >bcorr. Similarly, because of the lack of single dipp ffraction diagrams the
correlation strength in non-single diffractive (NSD) processes is smaller compared to that in inelastic
ones. Figure 3 displays the FB correlations for different sub-processes shown in Fig. 2, namely,
cylinder diagram, undeveloped cylinder, single diffraction, ¯ppannihilation and planar diagram. Only
the planar sub-processes demonstrate weak positive FB correlations, whereas the correlation slopes for cylinder and diffractive diagrams are slightly negative.
The cross section of annihilation process drops rapidly with rising energy of the collisions. There-fore, the slopes of FB multiplicity correlations inppand ¯ppinteractions become similar after some collision energy threshold. The strength of the correlations continues to increase, as shown in Fig. 4. Here QGSM calculations of FB correlations inppinteractions are displayed for energies ranging from
√s
=20 GeV to √s=14 TeV. Comparison with the UA5 data on ¯ppcollisions at √s=546 GeV and
multiplic-0 10 20 30 0 5 10 15 <nB (nF )>
0 20 40 60
0 10 20 30
0 20 40 60 80
0 20 40
UA5 data
0 20 40 60 80
0 20 40
0 20 40 60 80
nF 0 20 40 60 <nB (nF )> UA5 data
0 20 40 60 80 100 nF 0 20 40 60 80
0 20 40 60 80 100 nF 0 20 40 60 80
0 50 100 150
nF 0
50 100 150
20 GeV 200 GeV 546 GeV 630 GeV
900 GeV 1800 GeV 2360 GeV 14000 GeV
Figure 4.Dependencies�nB�(nF) for rapidity interval 0≤η≤4 in NSDppcollisions at 20 GeV≤ √s≤14 TeV. Data for 546 GeV and 900 GeV (from [3]) are shown by full squares.
For better understanding of the reason why the FB correlations in ¯ppcollisions are stronger at this energy than the FB correlations inppcollisions, we plot in Fig. 2 the set of diagrams employed in QGSM for treatment of both types of collisions at intermediate energies. Obviously, the variety of sub-processes in ¯ppinteractions is richer compared to that in ppones, because, e.g., the planar
diagrams (a) and annihilation diagrams (g)-(i) are absent inppprocesses. Since more sub-processes
with different mean multiplicities contribute to particle production in ¯ppcollisions, the correlation
slope is steeper, i.e. bpp¯
corr > bcorr. Similarly, because of the lack of single dipp ffraction diagrams the
correlation strength in non-single diffractive (NSD) processes is smaller compared to that in inelastic
ones. Figure 3 displays the FB correlations for different sub-processes shown in Fig. 2, namely,
cylinder diagram, undeveloped cylinder, single diffraction, ¯ppannihilation and planar diagram. Only
the planar sub-processes demonstrate weak positive FB correlations, whereas the correlation slopes for cylinder and diffractive diagrams are slightly negative.
The cross section of annihilation process drops rapidly with rising energy of the collisions. There-fore, the slopes of FB multiplicity correlations inppand ¯ppinteractions become similar after some collision energy threshold. The strength of the correlations continues to increase, as shown in Fig. 4. Here QGSM calculations of FB correlations inppinteractions are displayed for energies ranging from
√s
=20 GeV to √s=14 TeV. Comparison with the UA5 data on ¯ppcollisions at √s=546 GeV and
900 GeV [3, 11] demonstrates a good agreement between the model calculations and the experimental data. For all reactions the slope of the FB correlations remains almost linear. We have mentioned al-ready the vanishing of annihilation diagrams, as well as other so-called pre-asymptotic diagrams, with the increase of collision energy. However, the only reason of enlargement of the correlation strength bcorr in the model is the rise of the variety of different sub-processes with different mean
multiplic-(a) (b)
(c) (d)
(e) (f) (g)
Figure 5. Diagrams taken into account in QGSM in the modeling ofppinteractions at ultrarelativistic en-ergies: (a) multi-Pomeron exchange, (b) (semi)hard gluon-gluon interaction and soft Pomeron exchange, (c)-(d) single diffraction with high-mass and low-mass excitation, (e)-(f) double diffraction with low-mass and high-mass excitation, (g) central diffraction.
10-5 10-4 10-3 10-2 10-1 1
0 5 10 15
Figure 6.Average numbers of soft (dotted curves) and hard (solid curves) Pomerons per event inppcollisions at√s=0.9, 2.76, 7, and 13 TeV, respectively.
ity. These sub-processes and their role in formation of FB multiplicity correlations at ultra-relativistic energies are discussed in 3.
3 FB correlations at LHC energies
The set of diagrams describing the pp interactions at ultra-relativistic energies is shown in Fig.5.
The first two diagrams represent (a) the soft (multi)Pomeronexchanges and (b) processes going via
the formation of hard Pomerons. Other diagrams deal with the processes of single diffraction, (c)
and (d), and double diffraction, (e)-(g). The main contribution to particle multiplicity comes from
the processes with soft and hard Pomeron exchanges. Their numbers increase with rising collision
energy, as it can be seen in Fig. 6. This figure displays the relative amounts of soft and hard Pomerons
in a single pp-event at energies √s = 900 GeV, 2.76 TeV, 7 TeV and 13 TeV, respectively. At
√s = 900 GeV the number of soft Pomerons exceeds the number of hard Pomerons by factor 4,
whereas at √s = 13 TeV their ratio drops to 1.4. As it follows from Fig. 6, the maximum number
of both soft and hard Pomerons in a single event gradually increases with collision energy. The variety of sub-processes containing all possible combinations of soft and hard Pomerons becomes
more extensive. Since these processes have different mean multiplicities of produced hadrons, the
0 25 50 75 100 125 150 175 200 225 250
0 25 50 75 100 125 150 175 200 225 250
Figure 7. Forward-backward multiplicity correlations in NSDppcollisions at √s=0.9, 2.76, 7, and 13 TeV.
0 20 40 60 80 100 120 140
0 20 40 60 80 100 120
Figure 8. Dependence of average multiplicity�nB�on nF(solid circles) in NSDppcollisions at√s=7 TeV in QGSM. Curves indicate�nB(nF)�distributions for sub-events with only soft Pomerons,Ns_Pom=0,1, . . . ,7.
Figure 8 displays the�nB�(nF) dependencies calculated in QGSM forppevents at √s =7 TeV
which proceed only via the soft Pomeron exchanges. The FB correlations for the sub-processes with
fixed amount of soft Pomerons, varying from 1 to 7, are also plotted in Fig. 8. It is worth noting that FB correlations within each of the selected sample of events have zero slope, although the charged particle multiplicity measured on event-by-event basis changes from few hadrons up to one hundred. Not all topologies contribute to event with very small and very big multiplicity. This circumstance leads to reduction of the correlation strength in both multiplicity intervals.
At LHC energies the FB correlations in pp interactions were studied by the ALICE [21] and
ATLAS [22] Collaborations. The analysis is performed in terms of gaps in pseudorapidity,ηgap,
between the hadrons in forward and backward hemispheres, and widths of pseudorapidity bins,δη.
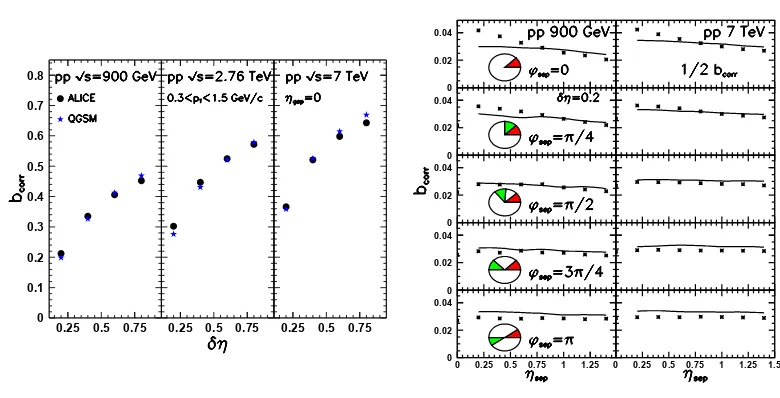
Figure 9 presents the comparison of model calculations of thebcorras a function ofδηat zero rapidity
gap with the ALICE data for √s = 900 GeV, 2.76 TeV and 7 TeV. The slopebcorr increases with
broadening ofδηfor all three energies. Note, that the strength of FB correlations drops with rising midrapidity gap [19].
ALICE Collaboration has also studied the FB correlations between different azimuthal sectors.
Parameters of the study are as follows. The azimuthal angle of the sectors isϕ=π/4 and the width of the bin isδη=0.2. The data obtained forppinteractions at 900 GeV and 7 TeV are shown in Fig. 10
in comparison with the QGSM calculations. The correlations at √s=7 TeV are twice stronger than
that at 900 GeV; other characteristics are pretty similar.
4 Conclusions
0 25 50 75 100 125 150 175 200 225 250
0 25 50 75 100 125 150 175 200 225 250
Figure 7. Forward-backward multiplicity correlations in NSDppcollisions at√s=0.9, 2.76, 7, and 13 TeV.
0 20 40 60 80 100 120 140
0 20 40 60 80 100 120
Figure 8. Dependence of average multiplicity�nB�on nF(solid circles) in NSDppcollisions at√s=7 TeV in QGSM. Curves indicate�nB(nF)�distributions for sub-events with only soft Pomerons,Ns_Pom=0,1, . . . ,7.
Figure 8 displays the�nB�(nF) dependencies calculated in QGSM forppevents at √s =7 TeV
which proceed only via the soft Pomeron exchanges. The FB correlations for the sub-processes with
fixed amount of soft Pomerons, varying from 1 to 7, are also plotted in Fig. 8. It is worth noting that FB correlations within each of the selected sample of events have zero slope, although the charged particle multiplicity measured on event-by-event basis changes from few hadrons up to one hundred. Not all topologies contribute to event with very small and very big multiplicity. This circumstance leads to reduction of the correlation strength in both multiplicity intervals.
At LHC energies the FB correlations in pp interactions were studied by the ALICE [21] and
ATLAS [22] Collaborations. The analysis is performed in terms of gaps in pseudorapidity,ηgap,
between the hadrons in forward and backward hemispheres, and widths of pseudorapidity bins,δη.
Figure 9 presents the comparison of model calculations of thebcorras a function ofδηat zero rapidity
gap with the ALICE data for √s = 900 GeV, 2.76 TeV and 7 TeV. The slopebcorr increases with
broadening ofδηfor all three energies. Note, that the strength of FB correlations drops with rising midrapidity gap [19].
ALICE Collaboration has also studied the FB correlations between different azimuthal sectors.
Parameters of the study are as follows. The azimuthal angle of the sectors isϕ=π/4 and the width of the bin isδη=0.2. The data obtained forppinteractions at 900 GeV and 7 TeV are shown in Fig. 10
in comparison with the QGSM calculations. The correlations at √s=7 TeV are twice stronger than
that at 900 GeV; other characteristics are pretty similar.
4 Conclusions
We apply the quark-gluon string model, based on Reggeon Field Theory, for the description of forward-backward multiplicity correlations in proton-proton collisions at ultrarelativistic energies. It
0 0.1 0.2 0.3 0.4 0.5 0.6 0.7 0.8
0.25 0.5 0.75 0.25 0.5 0.75 0.25 0.5 0.75
Figure 9. FB correlation parameterbcorratηgap = 0
in four rapidity bins:δη=0.2,0.4,0.6,0.8 inpp
colli-sions at √s=900 GeV, 2.76 TeV, 7 TeV and 13 TeV. Stars and circles denote the model calculations and the ALICE data from [21], respectively.
0 0.02 0.04 0 0.02 0.04 0 0.02 0.04 0 0.02 0.04 0 0.02 0.04
0 0.25 0.5 0.75 1 1.25 0 0.25 0.5 0.75 1 1.25 1.5
Figure 10. FB correlation parameter bcorr for az-imuthally separated sectors ofϕ = π/4 as a function of midrapidity gap at fixedδη = 0.2 in ppcollisions
at √s=900 GeV (left) and 7 TeV (right). Results for 7 TeV are reduced by factor 2. Lines and asterisks de-note the model calculations and the data from [21], re-spectively.
is shown that positive FB correlations arise in QGSM because of addition of different sub-processes
with different mean multiplicities. For the individual sub-processes, their�nB�(nF) distributions are
remarkably flat, although the event-by-event multiplicitycan vary from few particles up to more than one hundred.
At c.m. energies about 10 GeV the number of diagrams describing ¯ppcollisions is larger than that forppinteractions. Therefore, FB correlations are stronger in ¯ppcase. At c.m. energies higher than 100 GeV the sets of diagrams for ¯ppandppcollisions are similar. The further rise of the correlation strength occurs due to increasing number of soft and hard Pomerons allowed for a single event.
The correlation dependence is linear, �nB�(nF) = a +bcorrnF, for ¯ppand pp collisions at all
energies in question. However, for low and for very high multiplicitiesnF the slopesbcorrare not so steep. Finally, the FB correlations take place mainly in the region|xF|<0.1, whereas for|xF|>0.1 the correlations are almost absent.
Acknowledgements
Fruitful discussions with M. Bleicher, L. Csernai and V. Vechernin are gratefully acknowledged. L.B.
acknowl-edges financial support of the Alexander von Humboldt Foundation. J.B. thanks the German Research Foundation
(DFG) for the financial support through the Project BL 1286/2-1.
References
[2] K. Alpgaardet al., UA5 Collab., Phys. Lett. B123, 361(1983) [3] G.G. Alneret al., UA5 Collab., Phys. Rep.154, 247 (1987) [4] T.T. Chou, C.N. Yang, Phys. Lett. B135, 175 (1984)
[5] A. Capella, A. Krzywicki, Phys. Rev. D18, 4120 (1978)
[6] A. Capella, J.Tran Thanh Van, Z. Phys. C18, 85 (1983) [7] J. Dias de Deus, Phys. Lett. B100, 177 (1981)
[8] M.A. Braun, C. Pajares, V.V. Vechernin, Phys. Lett. B493, 54 (2000) [9] E.G. Booset al., Phys. Scripta15, 305 (1977)
[10] L.V. Bravinaet al., Sov. J. Nucl. Phys.50, 245 (1989) [11] R.E. Ansorgeet al., UA5 Collab., Z. Phys. C37, 191 (1988) [12] T. Alexopouloset al., E735 Collab., Phys. Lett. B353, 155 (1995)
[13] W. Braunschweiget al., TASSO Collab., Z. Phys. C45, 193 (1989)
[14] R. Akerset al., OPAL Collab., Phys. Lett. B320, 417 (1994) [15] A.B. Kaidalov, Phys. Lett. B116, 459 (1982);
A.B. Kaidalov and K.A. Ter-Martirosyan, Phys. Lett. B117, 247 (1982)
[16] N.S. Amelin, L.V. Bravina, Sov. J. Nucl. Phys.51, 133 (1990)
[17] J. Bleibel, L.V. Bravina, E.E. Zabrodin, Phys. Rev. D93, 114012 (2016) [18] E.E. Zabrodinet al., these Proceedings.
[19] L.V. Bravina, J. Bleibel, E.E. Zabrodin, Phys. Lett. B (submitted). [20] G. J. Alneret al., UA5 Collab., Phys. Rep.154, 247 (1987)
[21] J. Adamet al., ALICE Collab., J. High Energy Phys.JHEP05, 097 (2015)


![Figure 4. Dependencies �nB�(nF) for rapidity interval 0 ≤ η ≤ 4 in NSD pp collisions at 20 GeV≤ √s ≤ 14 TeV.Data for 546 GeV and 900 GeV (from [3]) are shown by full squares.](https://thumb-us.123doks.com/thumbv2/123dok_us/8069592.1345771/4.482.91.394.81.299/figure-dependencies-rapidity-interval-collisions-data-shown-squares.webp)