Test Facility for High-Speed Probe Calibration
Tomáš Jelínek1, *, Erik Flídr1, Martin Němec1, Jan Šimák1 1
VZLU – Czech Aerospace Research Centre, Beranových 130, 199 05 Prague, Czech Republic
Abstract: A new test facility was built up as a part of a closed-loop transonic wind tunnel in VZLU´s High-speed Aerodynamics Department. The wind tunnel is driven by a twelve stage radial compressor and Mach and Reynolds numbers can be changed by the compressor speed and by the total pressure in the wind tunnel loop by a set of vacuum pumps, respectively. The facility consists of an axisymmetric subsonic nozzle with an exit diameter de = 100 mm. The subsonic nozzle is designed for regimes up to M = 1 at the nozzle outlet. At the nozzle inlet there is a set of a honeycomb and screens to ensure the flow stream laminar at the outlet of the nozzle. The subsonic nozzle can be supplemented with a transonic slotted nozzle or a supersonic rigid nozzle for transonic and supersonic outlet Mach numbers. The probe is fixed in a probe manipulator situated downstream of the nozzle and it ensures a set of two perpendicular angles in a wide range (±90°). The outlet flow field was measured through in several axial distances downstream the subsonic nozzle outlet. The total pressure and static pressure was measured in the centreline and the total pressure distribution in the vertical and horizontal plane was measured as well. Total pressure fluctuations in the nozzle centreline were detected by a FRAP probe. From the initial flow measurement in a wide range of Mach numbers the best location for probe calibration was chosen. The flow field was found to be suitable for probe calibration.
1
Introduction
The main activity of High-speed Aerodynamics Department is providing aerodynamics measurement of flow fields in different applications in High-speed wind tunnels. The primary focus is on turbomachinery applications.
Pneumatic probes are still a wide-range tool when the flow field is studied in turbomachinery application. They are used in the measurements in linear cascades and in whole turbine stages as well. The probes used for the measurements are VZLU´s in-house products and it is necessary to calibrate each probe before it is used for the measurement due to manufacture inaccuracies.
For turbomachinery applications two types of probes by means of fixation related to the flow direction are usually used:
i) Probes fixed “axially”. The measured flow inlet is parallel with the fixation probe axis. This type of probes is used in linear blade testing.
ii) Probes fixed “radially”. The measured flow is perpendicular to the fixation probe axis (“L” probes). This type of probes is used in full stage turbine testing.
For this purpose the probe manipulator had to be done to provide the stereo-metric angle measurement for both types of probes.
The probe calibrations were usually realized in transonic and supersonic test sections of intermittent in-draft wind tunnels which are available in the department.
The quality of the flow was suitable but to provide a wide range calibration (in several Mach numbers and lots of stereo-metric angels) was quite time-consuming and expensive in consequence.
Moreover, the fixing of the probe to the test section side wall requires a special calibration rig to provide rotation in the second angle and also a slot in the test section wall. This brings issues with sealing and with precision of static pressure reading.
Then the key requirements were put together to design a new calibration facility:
The calibration facility will be implemented as a test section to the VZLU´s high-speed closed loop wind tunnel.
The outlet diameter of the subsonic nozzle was going to be 100 mm to ensure large enough area of a stable flow. This requirement comes from the experience with the calibration facility using the outlet diameter 50 mm [1].
The facility should cover the Mach number range Me = 0.2 – 2.0 for probe calibration,
The facility must allow the calibration of both types of probes in stereo-metric angle and move the probe downstream in axial direction from the nozzle outlet.
2
Test Facility
another advantage: it allows changing the Reynolds number independently on Mach number in some range.
2.1 Closed-loop Wind Tunnel
The new facility is implemented as a test section of a closed-loop aerodynamic wind tunnel. The level of pressure in the wind tunnel is maintained by a system of vacuum pumps and the desired air mass flow rate is then provided by means of a twelve-stage radial compressor driven by a 1.3 MW electric motor.
The air temperature and humidity are controlled by inter-stage heat exchangers and a condenser dryer, respectively. The pressure in the wind tunnel can be varying from 100 kPa to 10 kPa of absolute pressure. The maximum mass flow given by the compressor is 7 kg∙s-1 and the maximum pressure ratio is 8.
2.2 Concept of the facility
The concept of the facility (Fig. 1) is based on the axisymmetric subsonic nozzle with an exit diameter de = 100 mm. The nozzle leads to an axisymmetric calibration chamber of inner diameter 800 mm. At the nozzle inlet there is a set of a honeycomb (the cell diameter 6 mm, length 45 mm, sheeting 0.075 mm) and screens (wire diameter 0.23 mm, mesh 1.4 mm) to keep the flow stream laminar at the outlet of the nozzle.
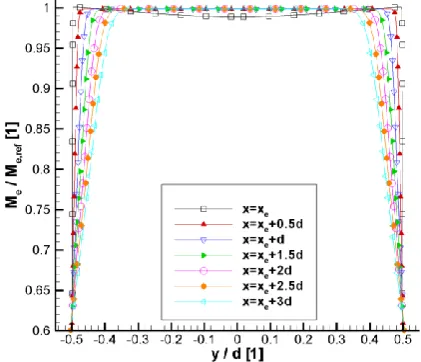
The subsonic nozzle can be supplemented with a transonic slotted nozzle or a supersonic rigid nozzle for transonic and supersonic outlet Mach numbers. The facility is connected to the wind tunnel at the exit of the chamber with a pipe of diameter 500 mm (Fig. 2).
The calibrated probe is fixed in a probe manipulator situated downstream of the nozzle and it ensures a set of stereo-metric angles in a wide range (±90°) for various kinds of probes and allows a movement of the probe downstream from the subsonic nozzle outlet to the distance x / de = 3.
The relevant data of the facility are summarized in Table 1.
Fig. 1.The sketch of the calibration facility concept.
To ensure the quality of the flow on the best level the presence of the total pressure probe behind the screens is unacceptable. The pressure reading is therefore obtained by static pressure taps on the inner surface. Due to the large contraction of the subsonic nozzle the flow behind the screens reaches 8 m∙s-1 for the highest outlet velocity
(Me = 1) and the difference of the total and static pressure for this velocity is about 40 Pa.
This pressure must be therefore corrected during the probe calibration. Correction can be defined as:
p0ref = cp pi, (1)
where cp is the correction coefficient obtained from the facility calibration and pi is the measured pressure at the nozzle inlet. Note that the cp is Mach number dependent.
The relation between the total pressure at the nozzle inlet and the static pressure reading for all subsonic regimes was measured by an axial total pressure probe at the initial measuring campaign.
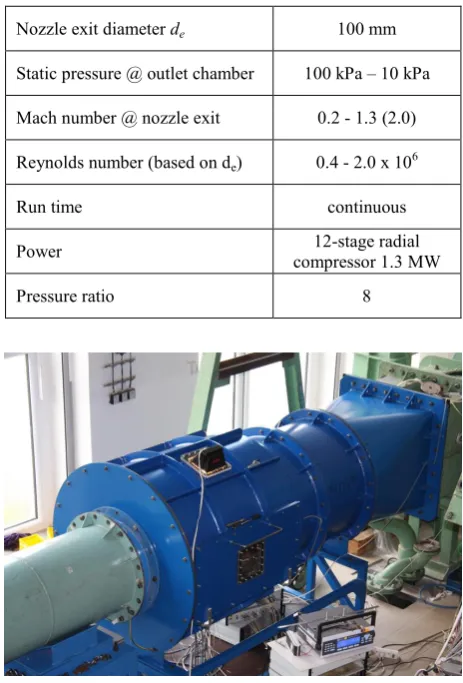
Table 1. Calibration facility main data.
Nozzle exit diameter de 100 mm
Static pressure @ outlet chamber 100 kPa – 10 kPa
Mach number @ nozzle exit 0.2 - 1.3 (2.0)
Reynolds number (based on de) 0.4 - 2.0 x 10⁶
Run time continuous
Power compressor 1.3 MW 12-stage radial
Pressure ratio 8
Fig. 2.The facility implemented to the wind tunnel loop.
2.3 Subsonic nozzle
An axisymmetric convergent nozzle is used for the subsonic outlet flow. The shape of the nozzle is defined by the fifth-degree polynomial function [2]:
d(x) = di − (di − de) [6(x/L) 5
possibility of flow separation and thus spoils the flow uniformity.
According to numerical results, the expected inlet maximal velocity is about 8 m/s. Due to the high compression ratio CR = 25 and the resulting favourable pressure gradient, the boundary layer could be considered as laminar.
The mass flow rate trough the nozzle outlet can be calculated as:
𝑚̇
𝑒= ∫
𝑢
𝑎𝑥𝑖𝑎𝑙𝑑𝐴
𝐴(3)
where ρ is the fluid density, uaxial is the fluid velocity in the axial direction and A is the cross-section of the nozzle outlet. As can be seen in Fig. 3 velocity profile at the nozzle outlet is almost uniform and so in the first approximation the mass flow rate can be obtained from the measurement of the total pressure at the nozzle axis. From the balances of mass fluxes velocity at the nozzle inlet can be determined as:
𝑣
𝑖𝑛=
𝐴
𝑚
̇
𝑒𝑖𝑛
𝑖𝑛 (4)Results obtained from this approach agree well with results obtained by numerical calculation [3], made during the nozzle designing.
The non-uniformity of the jet on the nozzle exit, measured as a standard deviation of the Mach number, is below 0.5%. The decrease is quite rapid further downstream, after the distance 0.3 de the non-uniformity reaches values near 10% of the initial values.
The width of the homogeneous core (i.e. the area where the axial velocity is almost the same as the nozzle exit velocity and the transverse velocity is zero) decreases linearly with increasing distance, in the case of Me = 0.5 the width is 64 mm after 300mm downstream of the nozzle. It is thus wide and long enough to accommodate various probes.
Fig. 3. Mach number across the nozzle exit from CFD
(Me = 0.9).
2.4 Supersonic nozzle
To obtain a supersonic free jet, a classical theory of a convergent-divergent nozzle was used. In the convergent section, a subsonic flow is accelerated to reach the speed of sound in the throat (denoted by a subscript t), which is the narrowest part of the nozzle. The sonic flow is further expanded in the divergent section to reach the demanded exit Mach number. According to the theory, the outflow Mach number is related to the nozzle exit and throat diameters by the formula:
𝑑𝑡2
𝑑𝑒2= 𝑀𝑒[
2
+ 1(1 +
− 1
2 𝑀𝑒2)]
−2(+1−1)
(5)
where κ is specific heats ratio.
The convergent part influences the shape of the sonic line and plays no other significant role so the subsonic shape described earlier is used for all regimes. The divergent part of the nozzle must be precisely shaped to suppress reflections of expansion waves. The right shape for each design Mach number is obtained by the method of characteristics (MOC) for axisymmetric flow [3]. Because the boundary layer decreases the efficient cross section, the resulting shape from the MOC is corrected by the estimated displacement thickness.
It is worth to mention, that the nozzle shape for low supersonic velocities places excessive demands on the precision of manufacturing. For example, the nozzle designed for Mach 1.3 has exit diameter de = 103.77 mm with the divergent nozzle length of 107.4 mm. The nozzle for Mach 1.2 has exit diameter de = 101.93 mm. Thus any small inaccuracy can lead to creation of expansion or compression waves and thus spoil the homogeneity of the free jet.
Another way to obtain a free jet with low supersonic velocities is to replace the divergent section with a single slotted nozzle.
2.5 Transonic slotted nozzle
A convergent nozzle can also be used to get a supersonic free jet. When the pressure ratio exceeds a critical value, the flow is choked with pe > pchamber and the expansion to the space of the calibration chamber accelerates the flow to a supersonic regime. However, the jet pattern corresponds to a typical under-expanded nozzle flow with regions of expansion and compression.
If we can control the process of expansion, the resulting jet will be smooth enough to allow the calibration. This is achieved by an extension with a transonic slotted nozzle which takes a form of a tube with constant diameter and properly shaped slots.
The slot width plays the same role as a Laval nozzle shape. It allows a controlled expansion with cancelling of expansion waves and provides a parallel flow on the nozzle exit. There are many ways how to determine the right slot shape.
Mach angle evaluated locally on the axis. The flow rates along the axis and wall are evaluated and used to estimate the mass flow rate ṁ(x) through the nozzle cross sections along the nozzle length. The change of the nozzle mass flow Δṁ determines the local slot mass flow Δṁslot = Δṁ / cd, corrected by an estimate of a local discharge coefficient cd. Knowing that the isentropic flow rate ρvslot through the slot is given by the wall pressure (calculated from the wall Mach number) and the ambient pressure, we can evaluate the local slot width hslot = Δṁslot / ρvslot.
Another way is to utilize the method for the Laval nozzle design. From the net of characteristics calculated by MOC, we can evaluate the Mach number on a cylinder surface with a constant radius and the local mass flow through this restricted space. The following steps are the same as in the previous method.
The resulting theoretical slot shape must be adjusted to meet the manufacturing capability, namely the minimum width or the slot opening on the nozzle exit. The shape of one slot of a 12-slotted nozzle obtained by the first method and designed for Mach 1.3 is shown in Fig. 3.
Fig. 4. Shape of manufactured slot (black) determined by the first method, another shape calculated by the second method (blue dashed) and with modified opening (blue solid).
3
Initial Measuring of flow quality
3.1 Setting of the facility
For the initial measuring of the flow quality the facility was supplemented with another probe manipulator which ensures the moving of the probe in plane y-z.
Several kinds of probes were used for the initial measurement to get information about the flow:
Total steady pressure probe used for traversing in planes y-z (x).
Static pressure probe used in centreline.
Fast Response Aerodynamic Probe (FRAP) for total pressure measurement in centreline.
FRAP probe for total pressure reading in plane y-z.
The static pressure probe for the centreline measurement was design according to the general recommendations to static pressure measurements in transonic flow [4]. The probe was a tube of a diameter d = 4 mm with a conical tip. Four static pressure taps were circumferentially equally distributed at the distance 27d from the tip of the probe.
The FRAP probes were designed with the Kulite XCS-062 transducer in the tip of the probe.
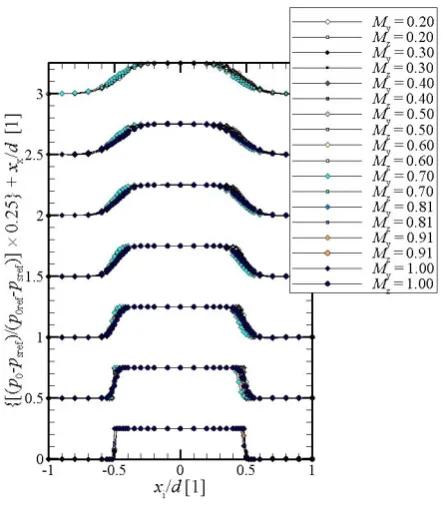
Fig. 5. Cp0 coefficient distribution in y-z planes in several axial distances x/dedownstream of the subsonic nozzle exit.
Fig. 6. Mach number distribution in the nozzle centreline determined from the static pressure measurement.
3.2 Subsonic flow
Measurements across the jet were performed in several axial distances downstream the subsonic nozzle outlet down to the distance x/de = 3 (Fig. 5). This measurement illustrates the width of the jet core downstream the nozzle and the propagation of the shear layer outside the core flow.
The most suitable position for the subsonic probe calibration was chosen at x/de = 0.5.
Total pressure fluctuations:
The total pressure fluctuations in the nozzle centreline and in two axis across the flow was detected by FRAP probes. The fluctuations are defined as a standard deviation (STD) of the total pressure signals obtained by the probe.
In Fig. 7 it can be observed that at the centreline the fluctuation of the flow increased with the Mach number up to 4% related to dynamic pressure q defined as:
q = 0.5 ps M
2, (6)
The same trend is seen in Fig. 8 on the centreline. At the edge of the jet the fluctuations of total pressure rise due to vortex structures forming in the sheer layer.
Fig. 7. Distribution of STD(p0)/q detected by FRAP probe in centerline at distance x/de= 1.0.
Fig. 8. Distribution of STD(p0)/q detected by FRAP probe across of the free stream at distance x/de= 1.0.
3.3 Supersonic flow
As the supersonic rigid convergent-divergent nozzles were not manufactured at the time when the initial measurement was performed, the transonic and supersonic experiments were done with a slotted nozzle created by a 3D printer. The nozzle was manufactured according the initial design for the nozzle outlet Mach number 1.3, using the slot defined in Fig. 4.
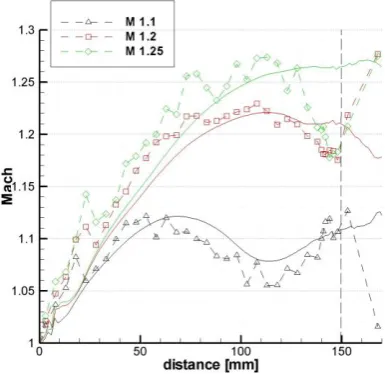
In Fig. 9 the comparison of expansion in transonic slotted nozzle given by the numerical prediction and by the experiment is shown. The experimental results don’t
meet the CFD prediction. For higher outlet Mach number the expansion doesn’t reach the desired value. It is probably due to not precisely manufactured shape of slots given by the 3D printing method.
A distribution of the total pressure across the free jet is shown in Fig. 10. The total pressure keep constant across the outlet diameter, at the edge of the jet rapidly decrease down to the pressure in the chamber. At the center a total pressure drop was detected.
The quality of supersonic flow needs to be improved. This is the part of the future work.
Fig. 9. Distribution of Mach number in the centerline of transonic slotted nozzle.
Fig. 10. Distribution of P0p/Po across the flow at transonic nozzle outlet. x/de = 0.05.
4
Aero-acoustic noise
The jet flow is always bounded with a noise and aero-acoustic issues which implicate increased vibrations. It is caused by the sheer layer when the flow exits the nozzle outlet.
shown in [5] the frequency peak of the noise generated by jets is within frequency range 0.1 - 1 kHz. This frequency may resonate with the facility structures. When the jet enters the outlet pipe it can cause huge vibrations of the whole facility.
To reduce this unpleasant behaviour it is necessary to shatter the vortex structures and streamline the flow as soon as it is possible. Therefor it was necessary to insert a rectifier right behind the outlet chamber.
5
Calibration of probes
After the initial measurement of flow quality was carried out, three probes used for linear blade cascade measurement were calibrated:
Five-hole conical probe Needle probe NP 2 Needle probe NP 3
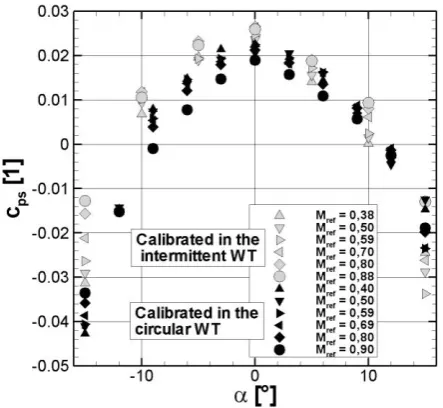
Demonstration of the probe calibration is shown on the probe NP 2. This probe was already calibrated in the intermittent WT and the results obtained in both facilities are compared here. The pressure coefficients of the probe are used for the comparison and they are defined as follows:
Cp0 = (p0,ref-p1)/(p1-ps), (7) Cps = (ps-ps,ref)/(p1-ps), (8)
Cpα = (p2-p3)/(p1-ps), (9)
where p is pressure, and index 0,ref is the reference total pressure, s,ref is the reference static pressure, 1, 2, 3 and s are the pressures measured by the probe.
Fig. 11. Comparison of pressure coefficients cps obtained from
calibration in intermittent and circular WT.
In Fig. 11 the comparison of the static pressure coefficient obtained from the calibration in both WTs is shown as an example. As can be seen the values obtained from the measurements on the new facility have lower values. It can be caused by the procedure of the coefficients evaluation. Corrections on the measured
data are applied in the intermittent WT, while in the new facility these corrections were not defined yet.
6
Conclusions
The new test facility for high-speed calibration of probes was successfully designed and realized.
The initial measurement shows the suitable quality of the flow for wide range of calibration. The most suitable position for probes calibration in subsonic regimes was chosen at x/de = 0.5. The calibration of a five-hole probe and needle probes was carried out in the facility and the probe calibration matrix was established.
Using the facility the calibration process was significantly speed up compared to previous procedures making the use of the intermittent in-draft wind tunnels to several hours instead of days. It was the major requirements at the beginning of the new facility project.
The aero-acoustic issues occurred when the facility was firstly used. The issues were caused by the free jet stream entering the outlet pipe. This issue was suppressed using the rectifier behind the outlet chamber.
For the supersonic regimes the 3D printed transonic slotted nozzle was manufactured and the supersonic flow was measured.
The further works will focus on the improvement in transonic and supersonic ability of the facility´s flow. The rigid supersonic nozzle is planned to be manufactured for Mach number higher than 1.4 as well as the improvement of transonic slotted nozzle.
Acknowledgements: The work was supported by the Long-term Framework Advancement Plan provided by the Ministry of Industry And Trade of the Czech Republic.
References
1. Gieß P. A., Rehder H. J., Kost F., Proceedings of the 15th Symposium on Measuring Techniques in Transonic and Supersonic Flow in Cascades and Turbomachines, (2000)
2. Bell J., Mehta R., Tech. rep. NASA-CR-177488, NASA, (1988).
3. Simak J., Proc. Conf. Experimental Fluid Mechanics, pp. 1-8, (2017).
4. Bryer D. W., Pankhurst R. C.: Pressure-probe methods for determining wind speed and flow direction, pp. 17-26, (1971)