Highlights from T2K
Anna Dabrowska on behalf of the T2K collaboration1,a
1H. Niewodniczanski Institute of Nuclear Physics PAN, Cracow, Poland
Abstract.T2K is a long-baseline neutrino experiment designed to measure neutrino os-cillations parameters. A high-intensity beam of muon neutrinos produced at the J-PARC accelerator complex is sent towards the near detector facility (the ND280 and INGRID detectors, located 280 m away from the neutrino source) and the far detector, Super-Kamiokande (295 km away). The change in the measured intensity and the composition of the neutrino beam between the near and far detectors are used to provide information on the oscillation parameters. T2K has delivered the world’s best measurement of the
θ23angle by observing muon neutrino disappearance. It was also the first experiment to observe electron neutrino appearance (2013) with a significance of 7.3σ, to measure the associatedθ13mixing angle, and to provide the first hint of a non-zeroδCPphase. The
first running of anti-neutrinos in the T2K experiment shows a clear dip below 1 GeV, as expected for an oscillation signal. The T2K experiment is also capable of providing in-formation on neutrino-nucleon cross sections at energies around 1 GeV, thanks to a large amount of target material present in the near detector facility.
A summary of the recent oscillation measurements as well as selected cross section re-sults are presented.
1 Introduction
The investigation of the neutrino properties in the past two decades conducted by numerous exper-iments dedicated to this subject has led to extraordinary results. The unique feature of neutrinos is that they can change or “oscillate” from one type to another as they travel over long distances. In 1998 Super-Kamiokande, as the first experiment, measured oscillations of neutrinos generated in the Earth’s atmosphere [1]. Next the oscillations of neutrinos coming from the Sun were measured by the SNO experiment in 2001 [2]. The discovery of neutrino oscillations revealed that the neutrinos have finite mass, so we expect that the weak eigenstates are different from the mass eigenstates, in analogy to the quark system. The neutrino mixing is described by a 3x3 unitary matrix, called the Pontecorvo-Maki-Nakagawa-Sakata (PMNS) matrix [3]. Oscillation probabilities depend on three mixing angles (θ13,θ12,θ23), two independent mass splittings (|Δm2|) and one complex CP phase (δCP) which should
be determined experimentally.
Since that time, various neutrino experiments (Super-Kamiokande, K2K, KamLAND, MINOS, T2K, ICARUS, OPERA, Daya Bay, RENO) have been involved in determining the above parameters, describing the phenomenon of the neutrino oscillations. Despite the fact that the values of three mixing angles and two mass splittings are now known, they need to be determined with a better precision in
particular to check whether there is the maximal mixing in the atmospheric sector. Also, there still remain open questions such as: value of theδCPdescribing the CP violation in neutrino sector, and the mass hierarchy in the neutrino mass eigenstates.
2 T2K experiment
T2K is a long-baseline neutrino experiment designed to measure neutrino oscillations parameters. The main goal of T2K is to study and compareνμtoνeand ¯νμto ¯νetransitions in order to measureθ13 and exploreδcp, CP violation in the lepton sector. T2K is also designed for precision measurement of
νμand ¯νμdisappearance to exploreθ23(¯θ23) andΔm223(Δm¯223) parameters, i.e to test the CPT theorem or new non-standardνinteractions with matter. The cross section measurements in the near and far detectors are additional purposes of the T2K experiment.
The T2K experiment [4] is located in Japan. A high-intensity beam of muon neutrinos produced at the J-PARC accelerator complex is sent towards the near detector facility (the ND280 and INGRID detectors, located 280 m away from the neutrino source) and the far detector, Super-Kamiokande (295 km away). The change in the measured intensity and the composition of the neutrino beam between the near and far detectors are used to provide information on the oscillation parameters. The beam is produced by the conventional method. The protons accelerated to 30 GeV hit a graphite target, producing hadrons including pions and kaons. Charged hadrons are then focused by a set of three electromagnetic horns and sent to a decay tunnel where the pions and kaons decay in flight, producing neutrinos (or anti-neutrinos by the reversing current in magnetic horns).
T2K was the first long-baseline experiment using the off-axis beam technique: the far detector, similar to the near ND280 detector, is located in the direction making a 2.5 degrees angle with the beam axis. Despite some reduction in the neutrino flux passing through the far detector, a big advan-tage is a kinematic focusing of the off-axis beam around the energy corresponding to the maximum of the oscillation probability, which is about 600 MeV. The use of an off-axis neutrino beam, also re-duces the background forνeappearance in the far detector by reducing the high energy tail which has a relatively large intrinsicνecomponent of the beam. Finally, the dominant interaction mode at these energies is the charged current quasi-elastic (CCQE) one, which allows for the reconstruction of the neutrino energy at the far detector. Additional significant processes are: CCQE-like multi-nucleon in-teraction, charged current single pion production (CCπ), neutral current single pion production (NCπ). For a precise measurement of oscillation parameters, T2K is equipped with two near detectors [4]: ND280 and INGRID. Short descriptions of the near and far detectors are included in the below sub-sections.
2.1 INGRID on-axis near detector
The on-axis detector INGRID [5] is used to monitor the beam rate, its direction and stability. It consists of 16 1m×1m×1mcubic modules. Each module is a "sandwich" of 11 scintillator layers and 10 iron layers. They are surrounded by four veto planes. The modules are arranged as follows: seven horizontally, seven vertically, and two off-diagonally (Figure 1 left). Neutrinos are counted in the detector by reconstructing muons from neutrino charged current interactions. The profile and direction of the neutrino beam are obtained by the use of registered charged current interactions in each module.
2.2 ND280 off-axis near detector
Figure 1.The INGRID on axis near detector (left) and the ND280 offaxis near detector (right) [4]
of several sub-detectors: Pi-Zero Detector (P0D) and Tracker as the inner detectors, both surrounded by the electromagnetic calorimeter (ECAL) and then by the Side Muon Range Detector (SMRD). All detector components except the SMRD are placed inside a 0.2 T magnetic field produced by the recycled magnet from the UA1 experiment. The P0D subdetector, placed upstream inside the magnet is a "sandwich" of scintillator planes, lead and brass plates, and a water target. It is customized for the measurement of neutralπ0production. Gamma rays fromπ0decay are converted to electromagnetic showers in the lead plates, and are recorded in the scintillator detectors. In the downstream of the P0D, two Fine Grained Detectors (FGDs) separated by three Time Projection Chambers (TPCs) are placed. The TPCs can measure the momentum of leptons from the curvature of the track in the magnetic field. The momentum resolution for muons is better than 10 % at 1 GeV. The FGDs consist of scintillator bars. They provide the target material for neutrino interactions and are optimized for detecting the proton recoils. By combining the TPCs and FGDs, the energy spectrum ofνμ can
be precisely measured based on CCQE (Charged Current Quasi-Elastic) neutrino interactions. The FGDs and TPCs form the so-called Tracker system, where theνμandνeenergy spectra are measured
by reconstructing the lepton momentum and by separating electrons from muons using dE/dx. The other detector components, SMRD and ECAL, are installed in the area outside of the P0D and Tracker. The inner part of the detector is surrounded by an electromagnetic calorimeter which can tag escaping electrons and positrons fromπ0decays. Additionally, the outermost SMRD detector (scintillator slabs installed in the magnet yoke) is used to detect muons escaping the inner volume and to tag cosmic ray muons.
2.3 Super-Kamiokande far detector
inner detector. SK started its operation in 1996. Apart from having its own rich physics program, SK is also used as the far detector of the T2K experiment. It has an excellent ability to separate between theνeandνμinteractions, which is critical to the study of the appearance of electron neutrinos in a muon neutrino beam. It was verified that the probability of theμ/e misidentification is less than 1 % [7]. The lack of a magnetic field in the far detector makes it impossible to separate betweenνand ¯ν. The events are synchronized with the beamline with the use of a dedicated GPS system.
3 Analysis strategy
To measure the oscillation parameters, the observed number of neutrino interactions at the far detector is compared with the predicted one. The values of the oscillation parameters are then estimated using a maximum likelihood fit. The neutrino flux is predicted by simulating the hadronic interactions in the target, and the propagation and decay of the secondary particles. This simulation is tuned to the experimental results of the CERN NA61 experiment [8]. Neutrino interactions are simulated based on models with constraints from external data using the NEUT neutrino interaction generator [9]. Systematic uncertainties are incorporated in each step: flux prediction, neutrino interactions and cross sections, and the response of the detectors. Systematic uncertainties for the far detector are evaluated using atmospheric neutrino data and aπ0control sample.
) θ Muon cos( Events 1000 2000
3000 CC0π-like Sample
Nominal MC Fitted MC Data ) θ Muon cos(
0.6 0.7 0.8 0.9 1
Data/Sim.
0.8 1 1.2
<
Muon Momentum (MeV/c)
Events 0 1000 2000 3000 -like Sample π CC0 Nominal MC Fitted MC Data
Muon Momentum (MeV/c)
0 1 2 3 4 5
Data/Sim. 0.81 1.2 > ) θ Muon cos( Events 0 500
1000 CC1π+-like Sample Nominal MC Fitted MC Data ) θ Muon cos(
0.6 0.7 0.8 0.9 1
Data/Sim.
0.8 1 1.2
<
Muon Momentum (MeV/c)
Events
0 100 200 300
400 CC1π+-like Sample
Nominal MC Fitted MC Data
Muon Momentum (MeV/c)
0 1 2 3 4 5
Data/Sim.
0.81
1.2
>
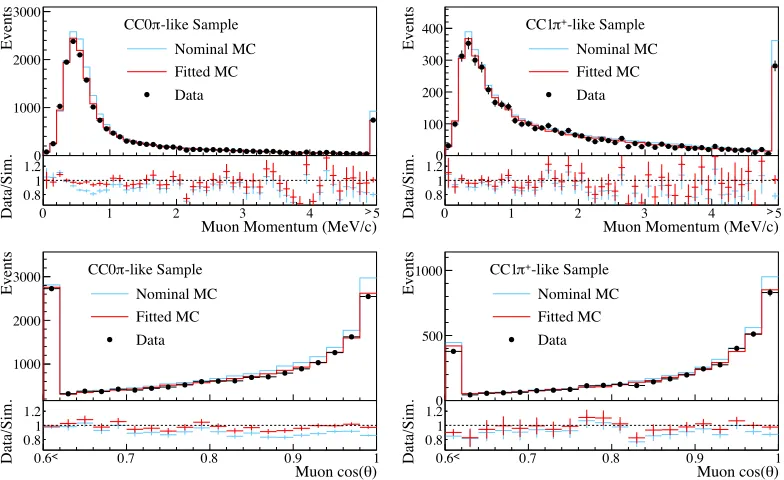
Figure 2.Muon momentum (top) and angle distribution (bottom) for the CC0π-like sample (left) and CC1π-like sample (right) selected in ND280. These are compared to the simulation, broken down into the different reaction types, with all systematic parameters set to their nominal values [10].
and far detectors, not all of these uncertainties can be constrained using ND280). The analyses pre-sented in this article were done based on 6.6×10²⁰protons on target for the total neutrino sample and 4.04×10²⁰ protons on target for the anti-neutrino sample, respectively. In the ND280 analysis the exclusive sub-samples are selected, based on track topologies in the Tracker of the ND280 detector, to constrain the cross section components: CCQE (CC0πsub-sample), CC resonant single pion cross-section parameters (CC1πsub-sample) and CC multi pions, dominated by deep inelastic processes (CCother sub-sample) for neutrino mode [10]. Because of lower statistics in the anti-neutrino mode, the ND280 fits were done only for two sub-samples : CC1-Track and CC>1 Track to make constrains for CCQE and CCnQE (Charged Current non Quasi Elasic) interactions.
ν
E
-1
10 1 10
Flux Parameter Valueμ
ν
SK
0.8 0.9 1 1.1 1.2 1.3 1.4 1.5
constraint
μ ν
Uncertainty before ND
constraint
μ ν
Uncertainty after ND
)
2
(GeV/c QE A
M
)
2
(GeV/c RES A
M x1QE x2QE xQE3 x1CC1/ x2CC1/
0
/
NC1
x
Cross section Parameter Value 0.6 0.8 1 1.2 1.4 1.6
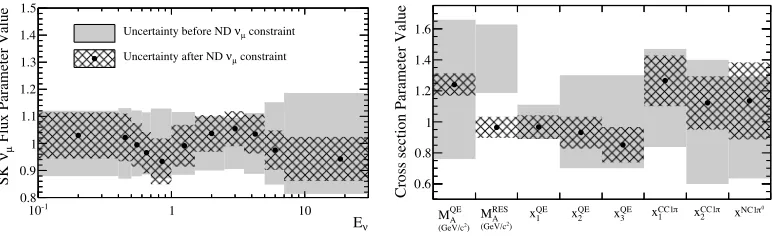
Figure 3.Prior and fitted values and uncertainties for the SKνμflux parameters (left) and cross-section param-eters (right) constrained by the near detector analysis for the oscillation analyses. Uncertainties are calculated as the square root of the diagonal elements of the relevant covariance matrix. The value ofMAQEandMRESA are given in units ofGeV/c2, and all the other parameters are multiplicative corrections [10].
For each defined sub-sample in the data and Monte Carlo, the two-dimensional plots of muon momentum and angle are prepared. Then the fit which varies the parameters related to neutrino energy spectrum and cross sections is performed to obtain the best agreement between the data and simulation. By fitting MC to the near detector data, new flux and cross-section parameters can be obtained. After the parameters adjustments, the agreements turn out to be excellent, as can be seen in Figure 2. The parameters adjusted in the ND280 analysis are also applied in the SK analysis. The uncertainties in these parameters are in general smaller than those for the prior values, as can be seen in Figure 3. The measurements done at the near detector significantly improve the experimental ability to predict the neutrino event rates and spectra at the far detector (Figure 4). The uncertainties in the predicted number of electron-like events decreases from 25 % to 6.3 %, and from 23.4 % to 7.4 % for muon-like events, respectively.
4 Oscillation analysis of joint electron neutrino appearance and muon
neutrino disappearance channels
Figure 4. Total error envelopes for the reconstructed energy distributions ofνμCC (left) and νe CC (right)
candidate events, using typical oscillation parameter values, with and without the ND280 constraint applied [10].
independent joint analyses were performed in T2K, and they gave consistent results. Some of them are presented below.
For the muon-like events observed at SK, fits of the rate and the reconstructed energy spectrum of the muon candidate events were done. For the electron-like events, fits of the rate and the two-dimensional distribution of the momentum and angle with the beam direction of the particle recon-structed as an electron in the event were performed (the method used in the previous T2K electron appearance analysis [12]). The point estimates of the oscillation parameters are found by minimizing the negative log-likelihood :
χ2=−2lnL(θ,g, x
s, s)
whereθrepresents the vector of the PMNS oscillation parameters,gis a vector containing the values of the systematic parameters constrained by the near detector,xsare the cross-section parameters not constrained by the near detector andsare the SK detector systematic parameters [10].
The profiledΔχ2of each oscillation parameter was obtained by minimizing the negative log-likelihood with respect to the systematic parameters and other three oscillation parameters using MINUIT.
Table 1.Point estimates of the oscillation parameters for the joint three-flavor oscillation frequentist analysis, for the normal hierarchy (NH) and inverted hierarchy (IH) [10].
MH Δm2
32(10−3eV2/c4) sin 2θ
23 sin2θ13 δCP Δχ2
NH 2.51 0.524 0.0422 1.91 0.01
IH 2.49 0.523 0.0491 1.01 0.00
23 θ 2
sin 0.3 0.35 0.4 0.45 0.5 0.55 0.6 0.65 0.7
)
4
/c
2
eV
-3
(10
2
m
Δ
2 2.2 2.4 2.6 2.8 3
Normal Hierarchy Inverted Hierarchy
13 θ 2
sin
0 0.02 0.04 0.06 0.08 0.1
CP
δ
-3 -2 -1 0 1 2 3
Normal Hierarchy
Inverted Hierarchy
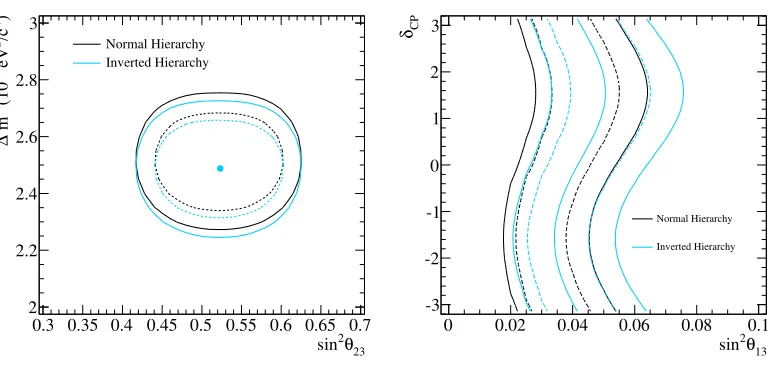
Figure 5.The 68% (dashed) and 90% (solid) C.L. regions, from the analysis without reactor data, with different mass hierarchy assumptions, usingΔχ2with respect to the best-fit point which comes from the inverted hierarchy obtained for the atmospheric parameters (left). The right plot shows one-dimensional confidence intervals in sin2θ
13for different values ofδCP[10].
disappearance, and the difference inχ2 between the solutions for each mass hierarchy is negligible. Figure 5 presents the 68% and 90% C.L. regions for the two mass hierarchy assumptions in the two two-dimensional oscillation parameter spaces (sin2θ23,Δm232) and (sin
2θ
13,δCP), constructed using constantΔχ2 with respect to the inverted hierarchy best-fit point. The value of sin2θ
23 =0.524+−00..057059 (0.523+0.055
−0.065) in the normal (inverted) mass hierarchy scenario obtained in the T2K analysis is the world’s most precise value till now.
Table 2.Point estimates of the oscillation parameters for the joint three-flavor oscillation frequentist analysis combined with the results from reactor experiments, for the normal hierarchy (NH) and inverted hierarchy
(IH) [10].
MH Δm2
32(10−3eV2/c4) sin 2θ
23 sin2θ13 δCP Δχ2
NH 2.51 0.527 0.0248 -1.55 0.00
IH 2.48 0.533 0.0252 -1.56 0.86
The point estimates for the oscillation parameters when the reactor measurements are included in the likelihood function are given in Table 2. The estimate for sin2θ13 is smaller than the result obtained with T2K data only, shown in Table 1. The likelihood is maximal for normal mass hierarchy and forδCP=-π/2, where the appearance probability is largest.
) 4 /c 2 eV -3 (10 32 2 m Δ 2.2 2.4 2.6 2.8 3 3.2
MINOS joint OA SK joint OA
T2K joint OA
23 θ 2
sin 0.3 0.35 0.4 0.45 0.5 0.55 0.6 0.65 0.7
) 4 /c 2 eV -3 (10 32 2 m Δ -3 -2.8 -2.6 -2.4 -2.2 -2
MINOS joint OA
SK joint OA
T2K joint OA
)
π
(
CP δ
-1 -0.5 0 0.5 1
2 χΔ 0 1 2 3 4 5 6 7 Normal Hierarchy Inverted Hierarchy (NH) 2 χ Δ
FC 90 % critical (IH) 2
χ Δ
FC 90 % critical
excluded at 90% CL
excluded at 90% CL
Figure 6.The 68% (dashed) and 90% (solid) C.L. regions for normal (top left) and inverted (bottom left) mass hierarchy combined with the results from reactor experiments in the (sin2θ
23,Δm2) space compared to the results from the Super- Kamiokande [14] and MINOS [15] experiments. ProfiledΔχ2as a function ofδ
CPwith the
results of the criticalΔχ2 values for the normal and inverted hierarchies for the joint fit with reactor constraint, with the excluded regions found overlaid (right) [10].
boundaries of 90% C.L. intervals obtained with the Feldman-Cousins approach [17] for both mass hierarchies are presented also in Figure 6 (right). The figure shows that the excluded regions forδCP at the 90% C.L are: δCP =(0.15; 0.83)πfor normal hierarchy andδCP=(-0.08; 1.09)πfor inverted hierarchy respectively. The normal hierarchy appears to be favored. Using a Bayesian approach, we can compare different models by looking at the posterior probabilities of different combinations of octant of sin2θ23 and mass hierarchies. The T2K data combined with the results of the reactor experiments for sin2θ13weakly favor the normal hierarchy and the octant sin2θ23>0.5.
5 First results from anti-neutrino running
The first preliminary result of ¯νμdisappearance and ¯νeappearance analysis is presented here. In the
anti-neutrino beam the data collected untill June 2015, which corresponds to 4.04×10²⁰ POT, have been used. The applied procedure, which includes the event selection and calculation of the expected Monte Carlo events, is the same as that for neutrino analysis. From Monte Carlo simulations for a no-oscillation scenario 103.6 muon-like events are expected in the SK detector, but only 34 muon-like events were observed.
Energy (GeV)
μ ν
Reconstructed
0 0.5 1 1.5 2 2.5 3 3.5 4 4.5 5
Events/bin 5 10 15 20 25 30 35 40 45 50 No oscillation Best fit spectra Data PRELIMINARY ) 23 θ ( 2
) or sin
23 θ
(
2
sin
0.2 0.3 0.4 0.5 0.6 0.7 0.8
) 2 | (eV 32 2 m Δ
| or |
32 2 m Δ | 1.5 2 2.5 3 3.5 4 4.5 5 -3 10 ×
disappearance 90% CL
ν
T2K
disappearance 90% CL
ν
T2K
disappearance 90% CL
ν MINOS best fit ν T2K best fit ν T2K MINOS best fit
PRELIMINARY
Figure 7. Distribution of reconstructed neutrino energy for 34 muon-like events observed in 4.04×10²⁰POT anti-neutrino beam data (left). Contours ofνmode and ¯νmode, also for MINOS ¯νresults (right)
.
The result of the best-fit oscillation parameters for normal mass hierarchy is : Δm¯232=2.50+−00..3210−3eV2
¯
θ23=0.46+0.14
−0.06
No differences can be observed in the best-fit parameters for normal and inverted hierarchy. The results obtained here are consistent with other experiments: MINOS [20] for anti-neutrino beam and T2K neutrino beam. The comparison is shown in Figure 7 (right). The reduction of the total uncer-tainty on the muon anti-neutrino disappearance results is not big and passes from 14.4% without the ND280 fit to 11.6% with the use of the ND280 fit results.
In the analysis of ¯νeappearance, the selection criteria for ¯νcandidates in the far detector are the same as those for neutrino beam data. As a result, only three events remain as potential candidates of the ¯νappearance signal. The lack of a field in the far detector makes the separation betweenνand ¯ν impossible. The background events include: electron-like events coming from interactions in the far detector, neutrinos from oscillations: νμ→ νe, misidentifiedνμ(or ¯νμ), and originalνe(or ¯νe) from
decays of muons in the T2K beam.
Table 3.Expected number of events in SK detector with actual 4.04×10²⁰POT for normal hierarchy.
Expected events (NH) δCP=−π/2 δCP=0 δCP= +π/2 Signal ¯νμ→ν¯e 1.961 2.636 3.288
Backgroundνμ→νe 0.592 0.505 0.389 Background NC 0.349 0.349 0.349 Background other 0.826 0.826 0.826
Total 3.73 4.32 4.85
Table 4.Expected number of events in SK detector with actual 4.04×10²⁰POT for inverted hierarchy.
Expected events (IH) δCP=−π/2 δCP=0 δCP= +π/2 Signal ¯νμ→ν¯e 2.481 3.254 3.939
Backgroundνμ→νe 0.531 0.423 0.341 Background NC 0.349 0.349 0.349 Background other 0.821 0.821 0.821
Total 4.18 4.85 5.45
The collected statistics are insufficient to confirm or exclude ¯νeappearance in the T2K experiment.
6 Other analyses - cross section measurements
Before the T2K experiment started to collect data, only few measurements of theνcross section in the range energy of the few hundreds of MeV had been performed. The T2K program of theνcross section measurements on various nuclei is very important from the point of view of the oscillation analyses. As was shown in Section 3, the reduction of systematic uncertainties associated with neu-trino interaction cross section measurement and constraints on cross section parameters allow for a more precise prediction of the number of events from neutrino interactions expected in the far detector.
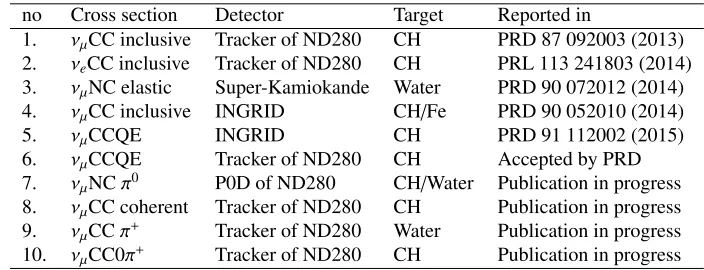
Table 5.List of neutrino cross section measurements in the T2K experiment
no Cross section Detector Target Reported in
1. νμCC inclusive Tracker of ND280 CH PRD 87 092003 (2013) 2. νeCC inclusive Tracker of ND280 CH PRL 113 241803 (2014) 3. νμNC elastic Super-Kamiokande Water PRD 90 072012 (2014) 4. νμCC inclusive INGRID CH/Fe PRD 90 052010 (2014)
5. νμCCQE INGRID CH PRD 91 112002 (2015)
6. νμCCQE Tracker of ND280 CH Accepted by PRD
7. νμNCπ0 P0D of ND280 CH/Water Publication in progress
8. νμCC coherent Tracker of ND280 CH Publication in progress
9. νμCCπ+ Tracker of ND280 Water Publication in progress
10. νμCC0π+ Tracker of ND280 CH Publication in progress
The information about the already published or ready for publicationνcross section measurements made in both far and near detectors on Hydrocarbon, Iron, Oxygen and Carbon and for different processes is summarized in Table 5.
7 Conclusions
The T2K collaboration has presented updated results of neutrino oscillation analysis based on accu-mulated 6.6×10²⁰POT neutrino beam data and 4.04×10²⁰ POT anti-neutrino beam data collected until June 2015.
The T2K experiment has delivered the currently most precise measurement of the angle θ23, sin2θ23=0.524+−00..057059 (0.523+
0.055
−0.065) in the normal (inverted) mass hierarchy scenario.
In the ¯νμdisappearance analysis, 34 ¯νμcandidates are found where 103.6 events are expected for
no oscillation. The constraints on oscillation parameters,Δm¯232 and ¯θ23, are consistent with the re-sults from the MINOS experiment andΔm232andθ23parameters from T2K. The present ¯νeappearance analysis (three electron-like events found) is statistically limited and cannot strongly favor the appear-ance hypothesis in comparison with background-only hypothesis. Therefore more anti-neutrino data is needed.
It should be also added, that the cross sections of neutrino interactions measured in the near and far T2K detectors are extremely important from the point of view of the oscillation analyses presented in this paper.
Acknowledgements
This work was partially supported by the Polish National Science Centre, projects number 2011/01/M/ST2/02578 and 2014/14/M/ST2/0085
References
[1] Y.Fukuda at al., Phys. Rev. Lett.81, 1562–1567 (1998) [2] Q.R.Ahmad et al., Phys. Rev. Lett.87(7), 071301 (2001) [3] B.Pontecorvo, J. Exp. Theoret. Phys.34, 247 ( 1958)
Z.Maki, M.Nakagawa and S.Sakata, Prog. Theor. Phys.28, 870, (1962) [4] K.Abe et al., Nucl. Instr. Meth. A659, 106 (2011)
[5] K.Abe et al., Nucl. Instrum. Meth. A694,211-223 (2012) [6] S.Fukuda et al., Nucl. Instrum. Meth. A501, 418 (2003) [7] S.Kasuga et al., Phys. Lett. B374,238 (1996)
[8] N.Abgrall et al., Nucl. Instrum. Meth .A701, 99 (2013). [9] Y.Hayato, Acta Phys. Polon. B40, 2477 (2009)
[10] K.Abe et al., Phys. Rev. D91, 072010 (2015) [11] K.Abe et al.,Phys. Rev. Lett.112, 18 181801 (2014) [12] K.Abe et al., Phys. Rev. Lett.112, 061802 (2014) [13] J.Beringer et al., Phys. Rev. D86, 010001 (2012) [14] A.Himmel, AIP Conf. Proc.1604, 345 (2014) [15] P.Adamson et al., Phys. Rev. Lett.112, 191801 (2014) [16] J.Beringer et al., (Particle Data Group with 2013 update see:
http://pdg.lbl.gov/2013/pdg2013.html) Phys. Rev.D86, 010001 (2012) [17] G.J.Feldman and R. D. Cousins, Phys. Rev. D57, 3873 (1998) [18] K.Abe et al., Phys. Rev. D90, 052010 (2014)
![Figure 1. The INGRID on axis near detector (left) and the ND280 off axis near detector (right) [4]](https://thumb-us.123doks.com/thumbv2/123dok_us/8153821.1359939/3.482.45.440.73.283/figure-ingrid-axis-near-detector-left-detector-right.webp)
![Figure 4. Total error envelopes for the reconstructed energy distributions of νμ CC (left) and νe CC (right)candidate events, using typical oscillation parameter values, with and without the ND280 constraint applied [10].](https://thumb-us.123doks.com/thumbv2/123dok_us/8153821.1359939/6.482.46.436.86.273/figure-envelopes-reconstructed-distributions-candidate-oscillation-parameter-constraint.webp)
![Figure 6. The 68% (dashed) and 90% (solid) C.L. regions for normal (top left) and inverted (bottom left) massfrom the Super- Kamiokande [14] and MINOS [15] experiments](https://thumb-us.123doks.com/thumbv2/123dok_us/8153821.1359939/8.482.90.396.82.273/figure-dashed-regions-normal-inverted-massfrom-kamiokande-experiments.webp)