a
Alexey Vinokurov: [email protected]
Experimental study of precessing vortex core in two-phase flow
Alexey Vinokurov1,2,a, Sergey Shtork1,2 and Sergey Alekseenko1,2
1
Novosibirsk State University, Novosibirsk, Russia
2
Kutateladze Institute of Thermophysics, SB RAS, Novosibirsk, Russia
Abstract. The work is devoted to the study of a precessing vortex core (PVC) in a swirling gas-liquid flow in an axisymmetric hydrodynamic chamber. The influence of the dispersed gas phase on the frequency of PVC precession and on the pressure in the hydrodynamic chamber is considered, and a correlation of the changes in these characteristics depending on gas content variation is demonstrated. The effect of flow swirling on the precession of the vortex core is shown. Experimental data for the two-phase flow are compared with the case of single-phase system.
1 Introduction
The study of swirling gas-liquid flows is an important scientific task of the modern fluid dynamics both from the point of view of fundamental science, and in connection with their extensive use in technical applications. One of the most interesting and little-studied phenomena is the formation of unsteady vortex structures, in particular, the precessing vortex core (PVC) in multiphase flows [1]. The unsteadiness, turbulence and multi-phase character make such phenomena extremely complex for mathematical modeling. For the development of the theory of vortex dynamics and improvement of numerical methods in CFD applied to swirling dispersed flows new detailed experimental data are necessary [2].
The study of unsteady vortex phenomena in multiphase flows is, in addition, important from the point of view of the objectives of hydraulic power industry. So, at a non-optimal mode of the generator operation, when the flow swirling is incompletely removed, behind the water wheel of the hydro turbine the PVC occurs and generates powerful pressure pulsations. The syntony of the frequency of vortex precession and the proper frequency of the hydropower plant elements causes resonance and can lead to emergency situations. One of the methods to control the frequency of PVC precession and to reduce pressure pulsations is adding the dispersed gas phase to the flow of water [3,4].
Another application of the results of the study of multi-phase swirling flows is associated with the development of techniques for multiphase flow metering, which is an important task for the petroleum and chemical industry [5]
It should be noted that at present in the literature, there are practically no experimental data, obtained on the basis of the systematic studies of the effect of the dispersed gas phase on PVC characteristics in a gas-liquid flow. This work is intended to fill in this gap.
2 Experimental setup
2.1 Hydrodynamic loop
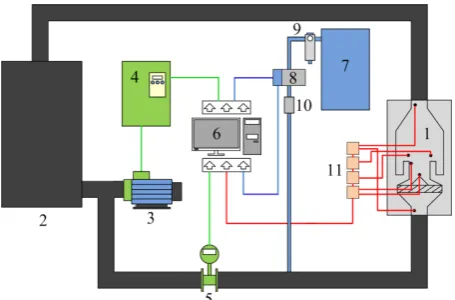
Experimental stand (figure 1) is a closed hydrodynamic loop [6], consisting of a work area in the form of an axisymmetric vortex chamber (1) and a water tank (2) with a capacity of 600 liters, connected by a system of polyethylene pipes with 40 mm diameter. Fluid head is created by a pump (3), which electric motor is connected to the power supply through the frequency converter Vesper E2-8300-030H (4) that enables changes in the fluid flow rate in the loop. For flow measurement the vortex ultrasonic flow meter Metran-300PR (5) is used. Frequency converter and flow meter are connected via the PID controller OWEN TRM210 and form a control circuit with back-coupling, capable to maintain the flow rate specified by the computer (6).
The gas is supplied to the hydrodynamic loop from the air receiver (7). The air enters directly into the pipe through the built-in fitting. Control and measurement of the air flow are performed using the gas flow rate controls (8), connected to the computer. The used devices are Eltochpribor RRG-12 (0-0.36 m3/h) and Bronkhorst F-202AV (0.36-3 m3/h). Therefore, the PC can control both the liquid flow and gas flow rates, creating a gas-liquid stream with the required ratio of the phases. Also on the air circuit there are a fine filter of 5 m (9) and a return valve (10), preventing the ingress of water from the hydrodynamic loop. To measure the integral characteristics of the flow in the working area, the line of pressure sensors is mounted (11). Their signals through analog-to-digital converter (ADC) are transmitted to a PC, where they undergo processing and analysis.
C
Owned by the authors, published by EDP Sciences, 2015
Fig. 1. Scheme of hydrodynamic loop
2.2 Vortical chamber
As a working area the axisymmetric cylindrical vortex chamber made of plexiglass is used (figure 2). At the entrance to the working section, the flow is swirled in the vane swirler (1). Then through a nozzle with diameter D = 40 mm (2) it enters the cylindrical chamber with a diameter D* and height H = D* = 104 mm. Because of the sudden expansion the decay of the vortex occurs, leading to PVC formation. At the chamber output there is a crossbar (3) that prevents the formation of the secondary vortex structures. To create different configurations of the swirling flow the interchangeable swirlers with different swirl numbers S = 0.53/0.87/1.33 are used. S refers to the geometric parameter of swirl [7], defined as:
3
2 1 2
, 3
1
h
h d
d
S tg
d d
φ
ª § · º − « ¨© ¸¹ »
« »
=
« § · » − « ¨© ¸¹ »
¬ ¼
(1)
where d is the diameter of the swirler, dh is the diameter
of the not-go central part, and $ is a slope angle of the vanes.
2.3 Measuring equipment
To measure the integral characteristics of the flow in the working area the line of pressure sensors is mounted. Above the nozzle 2 piezo-sensors of pressure Piezoelectric - 014MT (P1 and P2) are set diametrically
opposite each other to measure the frequency of precession. Such positioning allows registering pressure pulsations caused by PVC in antiphase and reducing the background noise, subtracting one signal from another. In addition, to measure characteristic differential pressure in the chamber 2 differential strain sensors BD Sensors DMD 331 are used. One of them measures total pressure drop in the chamber dP1, and the second
measures the difference between the vortex center and the periphery of the dP2. Time of measurements for each
flow configuration is 120 s, for which PVC manages to make about 5000 rpm.
To measure velocities in the case of single-phase flow the laser Doppler anemometer LAD-06 was used. Due to high requirements for the medium transparency, the measurements were carried out on an air stand at gas flow rate Qgas = 30 m3/h. As a working area the vortex
chamber (figure 2) with the removed side walls was used; after the nozzle (2) the flow went out in a free space. As tracers the drops of paraffin oil produced by the aerosol generator were used.
To visualize the flow pattern high-speed shooting with a speed of 1000 fps was used.
Fig. 2. Vortical chamber
3 Results
3.1 One-phase flow
Before considering the vortex precession in the two-phase flow, analyze the structure of the flow in the stream of clean fluid. Figure 3 shows the oscillograms of pressure pulsation taken by piezo-sensors, mounted diametrically opposite each other near the nozzle exit (figure 2). It can be seen that the pulsations on both sensors are periodic, besides they are registered in antiphase. The minimum points correspond to the passage near the PVC sensor, on which axis there is a reduced pressure.
To determine the frequency of precession fast Fourier transform (FFT) was used. Below there are the spectrum of the signal from one sensor (figure 4a) and the spectrum of the difference signal (figure 4b). In addition to increasing the amplitude, which is important in case of weak pulsations, the use of the differential signal allows removing the background noise, detected by the sensors in the same phase.
Fig. 4. Spectra of signal from one sensor (a) and differential signal (b)
Fig. 5. Dependence of frequency of precession on liquid flow rate (a); dependence of St on Re (b)
Figure 5a presents the dependences of the precession frequency f on the liquid flow rate Qliquid for the swirlers
with different parameters of swirl S. The obvious is a pronounced linear dependence. At that an increase in swirl parameter of the swirler leads to an increased frequency of precession. Figure 5b shows the same dependence in the dimensionless parameters - Stroukhal number St = fD/U0 on the Reynolds number Re = U0D/%,
where f is the frequency of precession, D is the nozzle diameter, U0 is the average axial velocity in the nozzle,
and % is kinematic viscosity of water. When Re > 8·104, Stroukhal number takes a constant value, i.e. there is a self-similar vortex flow relative to the Reynolds number. This means that it is possible to extrapolate the frequency of the vortex precession to the larger scales and fluid flow rates.
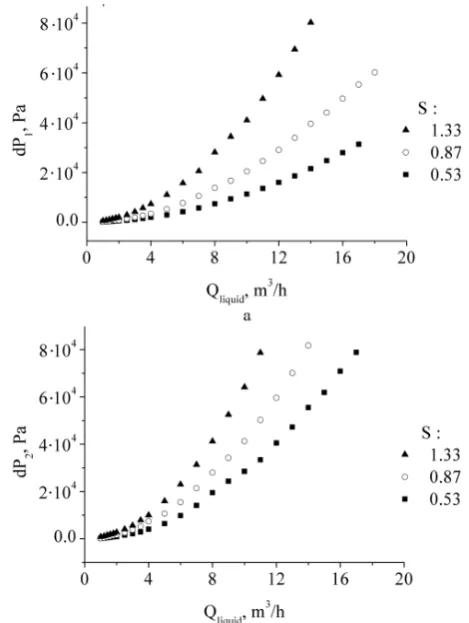
Using differential piezo-sensors the characteristic differential pressures in the chamber were measured, namely, the full differential pressure dP1 associated with
the intensity of the processes of vortex formation, and the differential pressure between the vortex center and the periphery dP2, characterizing the suction force of the
vortex. Figure 6 shows the dependences of dP1 (a) and
dP2 (b) on the liquid flow rate. Both curves have a
quadratic form; an increase in swirling parameters leads to increased pressure drops.
To fully understand the structure of the flow it is necessary to know the spatial distribution of the velocities in the flow. Using a laser Doppler anemometer
LAD-06 the velocity fields over the nozzle were measured on the air stand. The swirler with swirling parameter S = 0.87 was used. Figure 7a presents a vector field of an average velocity in the plane of the vertical section. On the chart, the length of the arrow is proportional to the velocity modulus (maximum value is 13 m/s). Figure 7b shows a field of the averaged axial velocity. The height above the nozzle L and the distance from the symmetry axis r are normalized by the radius of the nozzle R = 20 mm. After exiting the nozzle the flow expands, and along the central axis an extensive zone of recirculation is observed.
Fig. 7. Fields of time-averaged velocity above the nozzle in vertical section of chamber: velocity vector (a) and axial
velocity (b).
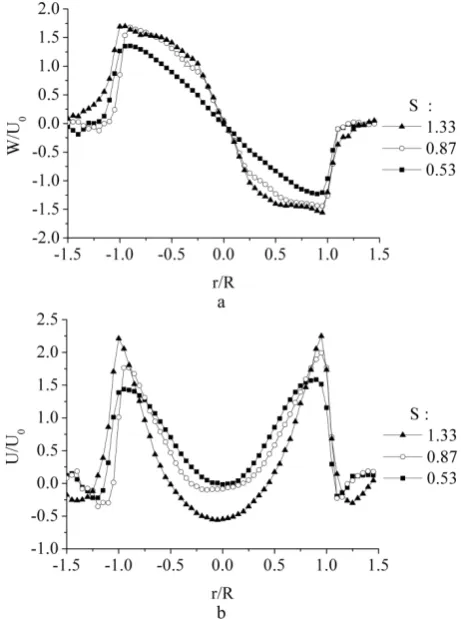
In addition, in the horizontal plane at a height of 1 mm above the nozzle the researchers measured the radial profiles, averaged over time of tangential velocity W (figure 8a) and the axial velocity U (figure 8b), obtained when using the swirlers with different parameters of swirl S. The velocities are normalized by the average flow rate in the nozzle U0, and the distance from the
central axis r is normalized by the radius of the nozzle R. The velocity profiles have the form typical for the swirling flows and are symmetrical relative to the central axis. The time-averaged tangential velocity (figure 8a) has a linear profile at the smallest swirl parameter S = 0.53, which corresponds to the case of solid-state rotation. Increase in the swirl parameter leads to a distortion of the line profile and its steeper slope in the central region of the flow. The profile of the time-averaged axial velocity (figure 8b) is also symmetric relative to the center. In the vicinity of the central axis there is the stagnation zone (S = 0.53 and 0.87), or the zone of recirculation (S = 1.33); the higher the swirl value the broader this zone. For this reason, the flow is pressed to the walls of the nozzle, near which there are the maxima of the time-averaged axial velocity.
Fig. 8. Time-averaged velocity components for different S: a – tangential velocity, b – axial velocity.
Thus, the study of the swirling single-phase flow in the axisymmetrical vortex chamber has confirmed the presence of a non-stationary periodic vortex structure, namely PVC, existing under different conditions of swirling. The velocity profiles have shown that over the nozzle there is the central recirculation zone, and the axial flow inside the nozzle is pressed to its walls.
3.2 Two-phase flow
To obtain the two-phase gas-liquid flow air was supplied in the liquid flow through the fitting (figure 1). The dispersion of the gas phase was not controlled; however, the analysis of the video has showed that at low flow rates of gas in a direct two-phase flow air formed the bubbles with a diameter of 1-3 mm. The study of the vortex precession in the gas-liquid flow was carried out using the swirler with swirl parameter S = 0.87.
Fig. 9. Instant picture of the flow in the vortex chamber, showing the occurrence of air core along the vortex axis.
Adding gas significantly affects the pressure pulsations in the chamber. Figure 10 shows the spectra of the pressure pulsations detected by the piezo-sensor P1
(see figure 2). The liquid flow rate Qliquid = 8 m3/h, the
gas flow rate Qgas = 0, 0.1 and 2.8 m3/h (volumetric gas
content & = Qgas/(Qgas + Qliquid) is equal to 0, 1% and
25%, respectively). On all spectra we observe a pronounced peak corresponding to the frequency of PVC precession. At that, the appearance of gas leads to a change in the precession frequency: at low gas content it decreases and at a large one increases. Also one can see that at high gas flow rate there is a decrease in the amplitude of the pulsations and the blurring of the peak. In addition, the increase in the gas content leads to an increase in the low-frequency noise.
Fig. 10. Spectra of pressure pulsations above the nozzle for different gas flow rates.
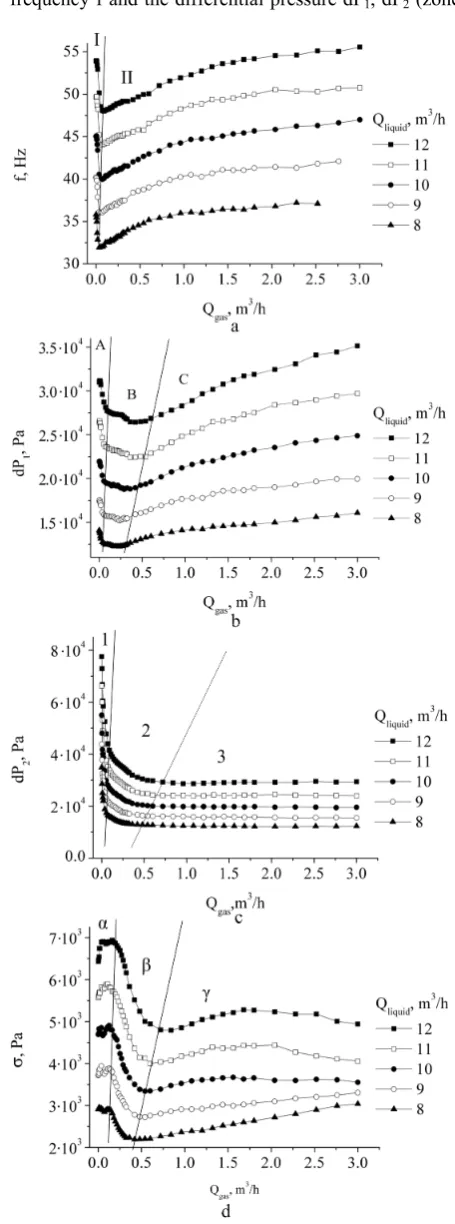
In figure 11 there are the dependences of the time-averaged main measured characteristics of the flow on the liquid flow rate. Here each curve corresponds to a particular flow rate. From figure 11a it is apparent that the appearance of gas in the flow leads to a sharp drop in the frequency of precession (zone I), and a further increase in gas content leads to an increase in frequency (zone II). In the graph of dependence of the total pressure difference dP1 on the gas flow rate (figure 11b),
there are 3 distinctive zones: a sharp decrease of the differential pressure (A), a relatively smooth decrease (B) and the zone of monotone increase (C). The pressure difference between the vortex center and the periphery dP2 (figure 11c) also undergoes a sharp decline with the
advent of gas (zone 1), then there is the area of a weak reduction (zone 2) and the stagnation area (zone 3). It should be noted that the areas of a sharp drop in the frequency f and the differential pressure dP1, dP2 (zones
Fig. 11. Dependence of flow characteristics on gas flow rate for different liquid flow rates: frequency of precession (a); pressure drop dP1 (b); pressure drop dP2 (c); pressure pulsations
I, A and 1, respectively) coincide. Figure 11d shows the dependence of mean-square values of the pressure pulsations above the nozzle, recorded by the piezo-sensor P2 (figure 2), on the gas flow rate. When gas
appears in the flow a slight increase of pressure pulsations is observed (zone <). Then there is the area of reducing pulsations associated with the suppression of PVC (zone &). Further increase of pressure pulsations (zone ?) is associated with an increase in low-frequency noise caused by gas bubbles (see figure 10). The zone ? of pressure pulsation growth coincides with the zone 3 of stagnation of differential pressure dP2.
Fig. 12. Diagram Eu/St
As it has been already shown, the changes in the flow characteristics with an increase in gas flow rate correlate among themselves. So the consistency of changes in the precession frequency f and full differential pressure dP1 is
confirmed from the chart Eu/St (figure 12), where the Euler number Eu=2·dP1/Kliquid·U02, the Strouhal St=f·D/U0,
Kliquid - liquid density, and U0- average flow velocity of
liquid in the nozzle. Each curve corresponds to a fixed fluid flow rate, and each point complies with the gas flow rate. Zones I-A, II-B and II-C are consistent with the corresponding areas in figures 11a and 11b; it is seen that the areas of the sharp fall in the precession frequency f and a sharp decrease of the differential pressure dP1
coincide. The curves have the form of loops and begin at the point of zero gas. At increasing gas flow they make a full turn counterclockwise, again crossing the gas zero point. One can see that in dimensionless coordinates, determined on the parameters of the liquid phase, the dependences for different fluid flow rates are well generalized.
Figure 13 shows the dependences of the precession frequency f (a) and differential pressure dP2 (b) on the gas
flow rate in the region of low gas content, obtained when using the swirlers with swirl parameters S = 0.87 (white markers) and S = 0.53 (black markers). It is seen that the swirl parameter has a major impact both on the values of the precession frequency and differential pressure, and on the type of dependence. When S = 0.87 decrease in the frequency of precession and the pressure drop are observed almost immediately, whereas if S = 0.53 the jump down occurs at much higher gas flow rates. This is
probably due to the fact that at a low value of swirl parameter gas separation is not that efficient.
Fig. 13. Dependences of frequency of precession f (a) and pressure drop dP2 (b) on gas flow rate for different swirl
numbers and liquid flow rates.
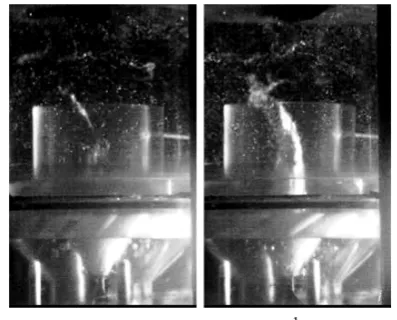
Figure 14 shows instantaneous pictures of the flow, taken by high speed camera in the mode Qliquid = 6 m3/h,
Qgas = 0.001 m3/h with the use of swirlers with swirl
parameters S = 0.53 (figure 14a) and S = 0.87 (figure 14b). When S = 0.87 we observe the formation of expressed gas cavity of constant diameter, which is in contact with the end face of the swirler. Lesser swirling S = 0.53 does not allow an air core to form at such a low gas content. The increase of gas flow rate leads to an increase in the size of a vortex core, which eventually contacts an end face of the swirler, where the pressure tap is located. This is what causes a sharp pressure jump at higher gas flow rates than in the case of S = 0.87.
Fig. 14. Instant pictures of the flow at Qliquid = 6 m3/h, Qgas = 0.005 m3/h. For a flow swirling the swirlers with swirl
parameters S = 0.53 (a) and S = 0.87 (b) are used.
4 Conclusions
Experimental results have showed that due to the sudden expansion of the swirling flow in an axisymmetric vortex chamber the precessing vortex core appears. The frequency of precession in a single-phase flow is linearly dependent on the phase flow rate. The obtained velocity fields show that due to the strong flow swirl over the nozzle there is the central recirculation zone, and the axial flow is pressed against the walls of the nozzle.
The emergence of a dispersed gas phase in the flow significantly affects its performance. In the case of strong flow swirling (swirl parameter S = 0.87 ~ 1) the effective separation of the phases is observed; under the action of centrifugal forces the gas bubbles accumulate along the vortex axis, forming an air core. Apparently, it is the formation of gas cavity in the chamber and its evolution with increasing gas flow rate that determines the behavior of the basic characteristics of the flow. When gas appears in the flow the vortex core abruptly transforms from the form of a concentrated vortex to a ring whirl with a gas cavity in the center. The formation of a less intense vortex which is broader in the transverse size requires less energy, which leads to lower hydrodynamic resistance of the chamber and, as a consequence, the full differential pressure dP1. However, an increase in the vortex diameter
leads to the reduction of vorticity, resulting in the reduction of the suction force of the vortex and differential pressure dP2. With a further increase in the gas content the
diameter of the gas cavity increases, i.e. the flow area for the liquid phase decreases (with corresponding increase in the characteristic velocity of fluid), which leads to an increase in hydraulic losses and dP1 drop, as well as an
increase in the precession frequency.
In the case of less intense swirling flow (S = 0.53) the formation of the air core occurs at higher gas flow rates, as a result a sharp drop in the frequency of precession and pressure drops are observed at high gas contents.
For a complete explanation of the features of vortex precession in the gas-liquid flow, it is necessary to investigate the local characteristics of the gas cavity and flow in general. This will be done in our further work.
Acknowledgement
The work was supported by the grant of the Russian Science Foundation (Project No. 14-29-00093).
References
1. S. Alekseenko, P. Kuibin, V. Okulov, S. Shtork, Heat Trans. Res., 41, 465–477 (2010).
2. P. Kuibin. 3rd IAHR Int. Meet. of the Work. on Cav. and Dyn. Probl. in Hydr. Mach. and Syst., Brno, 35– 44. (2009).
3. B.Papillon et al., XXIst IAHR Symp. on Hydr. Mach. and Syst., Lausanne (2002).
4. V. Tuekmenoglu, Turk. J. Elec. Eng. & Comp. Sci., 21, 26–37 (2013).
5. C.Hua, Y. Geng, Meas., 45, 763–768 (2012).
6. A. Vinokurov, S. Shtork, S. Alekseenko, Vestn. NSU. Ser.: Phys., 8,76–83 (2013).