Scholarship@Western
Scholarship@Western
Electronic Thesis and Dissertation Repository
8-15-2014 12:00 AM
Studies of Anode Electrodes for the BioGenerator
Studies of Anode Electrodes for the BioGenerator
Vahid VajihinejadThe University of Western Ontario
Supervisor
Dimitre Karamanev
The University of Western Ontario
Graduate Program in Chemical and Biochemical Engineering
A thesis submitted in partial fulfillment of the requirements for the degree in Master of Engineering Science
© Vahid Vajihinejad 2014
Follow this and additional works at: https://ir.lib.uwo.ca/etd
Part of the Other Chemical Engineering Commons
Recommended Citation Recommended Citation
Vajihinejad, Vahid, "Studies of Anode Electrodes for the BioGenerator" (2014). Electronic Thesis and Dissertation Repository. 2400.
https://ir.lib.uwo.ca/etd/2400
This Dissertation/Thesis is brought to you for free and open access by Scholarship@Western. It has been accepted for inclusion in Electronic Thesis and Dissertation Repository by an authorized administrator of
(Thesis format: Monograph)
by
Vahid Vajihinejad
Graduate Program in Chemical and Biochemical Engineering
A thesis submitted in partial fulfillment of the requirements for the degree of
Master of Engineering Science
The School of Graduate and Postdoctoral Studies The University of Western Ontario
London, Ontario, Canada
ii
Abstract
The BioGenerator as a fundamentally new type of H2-to-electricity conversion system offers a
quite sustainable and cost effective solution to the challenges associated with the use of fuel cells
in renewable power grids. The development of an anode electrode for the BioGenerator was
subject of this work. The unique features of the BioGenerator require unique electrodes, and
more specifically anode. The combination of biological cathodic liquid and the hydrogen gas fuel
require specific hydrophobic/hydrophilic properties of the anode. Several different methods for
anode formation were studied. The spreading technique was found to be most appropriate for the
conditions in the BioGnerator. It was employed to fabricate three-layer hydrophobic
PTFE-bound anode electrodes. The reproducibility, durability and performance stability of the
mentioned electrodes were studied using i-V curves, ex-situ cyclic voltammetry, and
through-plane gas permeability. In addition, the effect of hydrophobic polymer content (PTFE) in the
backing substrates, including woven-fiber carbon cloth and nonwoven-fiber carbon papers, on
the gas permeability, hydrophobicity, and long-term durability of anode electrodes was studied.
Results showed that woven-fiber carbon cloth impregnated with 80-100 wt.% PTFE gives an
enhanced durability towards flooding in the course of continuous operation at 100 mA cm-2. Moreover, causes of failure in the performance of the anode electrodes were assessed and results showed that the mass transfer is the main source of limitation in the long-term operation.
Keywords
The BioGenerator, micro-porous layer (MPL), backing layer (BL), catalyst layer (CL),
iii
Co-Authorship Statement
Vahid Vajihinejad was the principal author. The supervisors Dr. Dimitre Karamanev and Dr.
Shahram Karimi made revisions and recommendations. Based on some portions of results in this
thesis, two papers are under preparation for submission to peer reviewed journals. The
contribution of each author is given below
1- Effect of PTFE in Gas Diffusion Backing Layer of Hydrogen Oxidation Anode Electrode
of a Microbial-based H2/Fe3+ Redox Flow Fuel Cell
To be submitted to: International Journal of Hydrogen Energy
Authors: Vahid Vajihinejad, Paul Brouwers, Dimitre Karamanev, Shahram Karimi
Experimental work and data analysis were performed by Vahid Vajihinejad. Paul Brouwers
contributed to the gas permeability analysis and fabrication of electrodes. Dimitre Karamanev
and Shahram Karimi provided consultation regarding experimental work and data analysis. The
manuscript was written and revised by Vahid Vajihinejad and reviewed by Dimitre Karamanev
and Shahram Karimi.
2- Performance Stability Studies of Hydrogen Oxidation Anode Electrodes used in a
Microbial-based H2/Fe3+ Redox Flow Fuel Cell
To be submitted to: The Canadian Journal of Chemical Engineering
Authors: Vahid Vajihinejad, Ricardo Cuello, Dimitre Karamanev, Shahram Karimi
Experimental work and data analysis were performed by Vahid Vajihinejad. Ricardo Cuello
contributed to SEM analysis and fabrication of CV cell. Dimitre Karamanev and Shahram
Karimi provided consultation regarding experimental work and data analysis. The manuscript
was written and revised by Vahid Vajihinejad and reviewed by Dimitre Karamanev and Shahram
iv
Acknowledgment
My sincerest acknowledge goes to my supervisor, Dr. Dimitre Karamanev whose inspirational
words and sincere support were always with me. This was a collaborative work between The
University of Western Ontario and Sarnia Lambton College, and I would like to thank Dr.
Shahram Karimi for his advises and help during this project. I would like to convey my special
thanks to Mr. Paul Brouwers and Mr. Ricardo Cuello for their admirable assistance in this
project. I would like to thank my colleagues Dr. Jaydevsinh Gohil and Mr. Victor Pupkevich for
their assistance in this project. In addition, I would like to thank Ms. Mary Jane Walzak for her
assistant and permission to use the contact angle measurement facility. Thanks to Mr. Tim
Stephens and Erol Tas for porosimetry analysis. Thanks to Mr. Tim Goldhawk for his assistance
with SEM analysis. Finally, I would like to thank my friends Mr. Amin Jaberi, Mr. Stanislav
Ivanov, Mr. Hojatallah Seyedi Niasar, Mr. Arash Mozafari, Ms. Nadia Ivanova, and Ms. Aida
Daemi for all their friendship and support.
Lastly, I am grateful to my wife, Shabnam, for her love and support. Her unlimited patience and
support has been always giving me faith and hope to pass all the days of being away from each
v
Table of Contents
Abstract ... ii
Co-Authorship Statement... iii
Acknowledgment ... iv
1 Introduction ... 1
1.1 Motivation ... 1
1.2 Objectives ... 3
1.3 Thesis outline ... 4
Chapter 2 ... 5
2 Background and Literature Review ... 5
2.1 What is a Fuel Cell? ... 5
2.2 Fuel Cells Thermodynamics... 7
2.2.1 Activation loss ... 8
2.2.2 Ohmic loss ... 8
2.2.3 Mass Transfer loss ... 8
2.2.4 Fuel Cell Efficiency ... 10
2.3 Fundamentals of the BioGenerator ... 11
2.3.1 Idea ... 11
2.3.2 Structure and Reactions ... 11
vi
2.3.4 Gas Diffusion Layer (GDL) ... 15
2.4 A Brief Assessment of Flooding Management in Similar Hydrogen-Based Systems ... 19
2.4.1 Alkaline Fuel Cells ... 19
2.4.2 Phosphoric Acid Fuel Cells ... 19
2.4.3 Immersed-Tank Electrowinning ... 20
2.5 Summary ... 21
3 Materials and Methods ... 22
3.1 Anode Electrodes ... 22
3.1.1 Preparation of the Backing Layer (BL) ... 22
3.1.2 Preparation of the Micro-porous Layer (MPL) ... 22
3.1.3 Preparation of the Catalyst Layer (CL) ... 22
3.2 Flow Fields, Cathode and Membrane ... 26
3.3 Laboratory Set-up of Fuel Cells for the BioGenerator ... 28
3.4 Ex-situ Characterization Techniques ... 28
3.4.1 Through-Plane Gas Permeability ... 28
3.4.2 Contact Angle ... 30
3.4.3 Mercury Intrusion Porosimetry (MIP) ... 31
3.4.4 Scanning Electron Microscopy (SEM) ... 31
3.4.5 X-Ray Diffraction (XRD) ... 33
vii
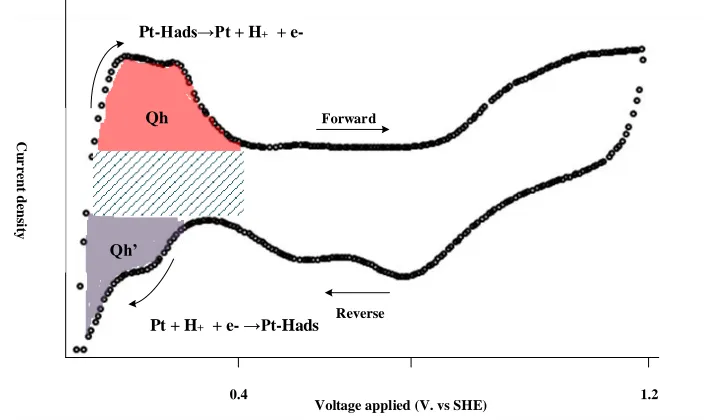
3.5 Electrochemical Analysis ... 34
3.5.1 i-V Measurements ... 34
3.5.2 Cyclic Voltammetry ... 35
Chapter 4 ... 37
4 Results and Discussions ... 37
4.1 Outlook ... 37
4.2 Lamination of PTFE-Bound Catalyst Layers on Commercially Available Gas Diffusion Layers ... 41
4.2.1 Application of Catalyst Layer using Pulse-Electrodeposition on Hydrophobic Gas Diffusion Layer ... 43
4.3 Effect of PTFE Content in the Gas Diffusion Backing Layer on the BioGenerator Fuel Cell Performance ... 43
4.4 Catalyst Layers Bound with Different Amounts of PTFE ... 50
4.5 Comparing the Performance and Long-term Durability of Developed Electrodes Fabricated by the Spreading Technique with Commercially Available PEMFCs Electrodes .. 53
4.6 Failure Modes of Anode Electrodes ... 58
4.7 Electrochemical Degradation ... 58
4.8 Loss of Hydrophobicity ... 62
4.9 Delamination ... 62
5 Conclusions and Recommendations ... 64
viii
5.2 Recommendations ... 66
6 References ... 68
ix
List of Tables
Table 2-1 A quick overview on fuel cell technologies (EERE 2011)... 6
x
List of Figures
Figure 1-1 A schematic diagram of integrating renewable energies and electrical grids ... 2
Figure 2-1 Scheme of a PEM fuel cell ... 5
Figure 2-2 A typical i-V curve obtained in a fuel cell ... 10
Figure 2-3 Scheme of the BioGenerator system ... 12
Figure 2-4 A complete scheme of a fuel cell system. Graphite plates refer to bipolar plates in this picture (Scientific Computing World 2003) ... 14
Figure 2-5 Different flow field configurations: a) parallel, b) serpentine, c) parallel-serpentine, d) interdigitated, e) pine or grid type (Karimi 2011) ... 14
Figure 2-6 A schematic picture of a seven layer Membrane Electrode Assembly (MEA) ... 15
Figure 2-7 Microscopic pictures of left) carbon cloth and right) carbon paper (FuelCellEtc 2013) ... 16
Figure 2-8 Scheme of an immersed hydrogen electrode used in zinc electrowinning (Allen et al., 1993) ... 20
Figure 3-1 Scheme of brushing method ... 23
Figure 3-2 Badger Airbrush Co 150-5-PK Professional used to apply the catalyst layer onto the surface of the GDL... 24
Figure 3-3 Knife spreader (Mitutoyo, TQC Co.) used in this study to laminate MPLs and CLs. Height of the knife is adjustable to obtain different uniform thicknesses ... 24
Figure 3-4 Illustration of the continuous flow Pt- electrodeposition system. 0.1 M Pt (NH3)4Cl2 was used as the electrolyte, and the electrodeposition bath volume was 15 mL. ... 26
Figure 3-5 Left hand side is picture of the bipolar plate used for the liquid side. Wider parallel
xi
found in liquid flow. The picture at the right shows parallel-serpentine flow fields for the gas
side. ... 27
Figure 3-6 BioGenerator fuel cells laboratory set-up ... 28
Figure 3-7 Scheme of the apparatus used for permeability measurements of the BLs (Karimi
2011) ... 29
Figure 3-8Aschemeofthesessiledroptechnique.Ѳc is the contact angle (Sessile drop
technique 2014). ... 30
Figure 3-9 Scheme of an electron scanning microscope (SEM) (Schweitzer n.d.) ... 32
Figure 3-10 SEM image of a fuel cell catalyst layer fabricated by PTFE-bound spreading
technique ... 33
Figure 3-11 AnillustrationofXRDtechnique.Ѳi is the incidence angle (waves are going into the
crystalstructure);Ѳr is the reflection angle (waves are leaving the crystal structure); dL is the
spacing between the planes in the atomic lattice. ... 34
Figure 3-12 Scheme of the electrochemical cell used for ex-situ cyclic voltammetry measurement
of the fuel cell electrodes in this work. ... 35
Figure 3-13 A typical fuel cell electrode CV curve. Qh and Qh’ represent charges associated with
hydrogen adsorption and desorption on platinum. ... 36
Figure 4-1 Scheme of the three-phase hydrogen oxidation reaction on a typical H2-based fuel cell
... 37
Figure 4-2 A schematic diagram of the two-phase transport within the anode electrode of the
BioGenerator ... 38
xii
Figure 4-4 Top view SEM of catalyst layers. a) spray-made catalyst layers; b) brush-made
catalyst layers ... 42
Figure 4-5 K permeability values of PTFE-impregnated a) carbon paper (Toray T-120); b)
carbon cloth (CC4P- Fuelcell Earth)... 44
Figure 4-6 Microscopic images of carbon papers and cloths before and after impregnation with
PTFE. (a) untreated paper; (b) impregnated paper; (c) untreated cloth; (d) impregnated cloth. .. 45
Figure 4-7 i-V curves obtained for anode electrodes with different amounts of PTFE in their gas
diffusion backing layers (e.g.BL-50%= backing layer impregnated with 50 wt.% PTFE ) a)
beginning of operation (BOL); b) after 125 hours of continuous operation at 100 mA cm-2; c) after 250 hours of operation at 100 mA cm-2 . ... 47
Figure 4-8 Surface contact angle of cloth-based gas diffusion backing layers impregnated with
different amounts of PTFE... 48
Figure 4-9 Pore size distribution curves as a function of PTFE loading in the gas diffuion
backing layer ... 49
Figure 4-10 i-V curves obtained for fuel cells running with different contents of PTFE in their
catalyst layers. ... 51
Figure 4-11 Surface contact angle of catalyst layers impregnated with different amounts of PTFE
... 52
Figure 4-12 Scheme of impact of PTFE in mass transport within the catalyst layer... 53
Figure 4-13 durability in performance for developed electrodes (PTFE: 85% in BL- 30% in
MPL- 40% in CL- 5 cm2 cell) and commercially available electrodes (SLGDE) running at constant current density of 100 mA cm-2. ... 55
Figure 4-14 i-V curves obtained for fuel cells running with a) commercial PEMFCs anode
xiii
Figure 4-15 Top view SEM of catalyst layers. a) SLGDE-50 times magnification; b) the
developed anode-50 times magnification; c) SLGDE-25000 times magnification; d) the
developed anode-25000 times magnification ... 58
Figure 4-16 Ex-situ CV voltammograms obtained for fresh anode electrodes and after 2000
hours of continues operation at 100 mA cm-2 in the fuel cell. ... 59
Figure 4-17 XPS analysis obtained from the surface of the catalyst layer of Nafion-post coated
electrodes. As seen, there is no peak detecting presence of Fe element. ... 60
Figure 4-18 Top view SEM of the catalyst layer of used anode electrodes (after about 2500 hours
of operation). ... 61
Figure 4-19 Top view SEM of the catalyst layer of fresh anode electrodes. ... 61
Figure 4-20 Contact angle values obtained for the developed electrodes at BOL (fresh) and EOL
(used- after 2900 hrs of continuous operation at 100 mA cm-2) for the backing layer and the catalyst layer sides. ... 62
Figure 4-21 Cross-section image of the anode electrode. Delamination of the catalyst layer in a
used anode electrode is shown in the SEM image ... 63
Figure 4-22 Top view SEM image of the catalyst layer of left) used electrode after 600 hours of
xiv
Nomenclature
Activity of Proton (unitless)
Activity of Hydrogen (unitless)
Activity of Oxygen (unitless)
Activity of Ferric Ion (unitless) Activity of Ferrous Ion (unitless)
Reversible Cell Voltage (V)
Thermodynamic Reversible Efficiency (unitless)
Real Efficiency (unitless)
Farady’s Constant (C mol-1
)
Current Density (A cm-2)
Exchange Current Density (A cm-2)
Limiting Current Density (A cm-2)
Cell Voltage (V)
xv
Abbreviations
(Gas diffusion) Backing Layer Beginning of Life (Operation) Bipolar Plate
Catalyst Layer Cyclic Voltammetry
Electrochemical (Active) Surface Area End of Life (Operation)
Gas Diffusion Layer Gas Diffusion Electrode Membrane Electrode Assembly Mercury Intrusion Porosimetry Micro-Porous Layer
Polymer Electrolyte (Proton-Exchange) Membrane Fuel Cell
Polytetrafluoroethylene
Scanning Electron Microscopy X-Ray Photoelectron Spectroscopy
1
Introduction
1.1
Motivation
The Necessity of finding alternatives to fossil fuels is no longer a question in the 21st century because fossil fuels are not renewable, and they lead to major impacts on the environment. These
reasons have created the rationale for developing alternative energy technologies (Glaser 1968).
According to the US Department of Energy, over the last two decades, about 75% of
human-caused emissions have come from the burning of fossil fuels (DOE, FOSSIL 2013).
In the last few years, there has been a considerable growth in the share of renewables in the
generation of electricity, heat, and in fuel production. In respect to the generation of electricity,
renewables fall into two major categories: hydropower and new renewables (Renewables 2013
Global Status Report, 2013). The share of renewable primary energy sources for global
electricity generation at the end of 2012 accounted for 16.5% and 5.2% for hydropower and
other renewables, respectively (Renewables 2013 Global Status Report 2013). Among the latter,
one can mention alternatives such as wind and solar power, bio-power, geothermal power and
ocean (wave) power (John and Weir 2006; Lindley 2010). In electricity generation on a global
scale, wind and sun are the most important sources mainly due to their environmentally friendly
nature and unlimited quantity. For example, in 2010, the power generated from wind turbines
accounted for almost 70% of the worldwide electricity generation from non-hydro renewable
sources of energy (Renewables 2011: Global Status Report 2011).
However, in order to take advantage of the unlimited potency of wind and sun for generating
electricity, there is one big challenge. The intermittency of wind and solar power generation
brings the viability of these natural resources into question (Lindley 2010). No intermittent
power generation can be introduced to the electrical grid without smoothing. In other words, the
output of such sources needs to be smoothed out by storing their excess energy in the form of
intermediate energy. Recently, systems such as rechargeable and redox flow batteries, hydrogen
storage, pumped hydro, compressed air storage, supercapacitors and flywheels have been
proposed as energy storage systems for renewable-based power plants (Hadjipaschalis et al.,
unfortunately, it has a big drawback- it is very limited by geographical location (Buenoa and
Carta 2006). Among the existing energy storage methods, hydrogen is probably the best overall
power storage medium. Electrolysis is a highly efficient and well-established technology for the
conversion of surplus electricity to hydrogen (Figure 1-1). Compression or liquefaction is
commonly used for the storage of the produced H2 (Zhou 2005). However, the current bottleneck
in hydrogen-based energy storage of renewable power is the conversion of the stored hydrogen
back into electricity, since there is no well-developed H2-to-electricity conversion technology.
Wind turbine Electrolyser H2
storage
H2-to-electricity conversion
system
Wind turbines non-operational
Grid
Wind turbines operational
Figure 1-1 A schematic diagram of integrating renewable energies and electrical grids
Currently in wind and solar power plants, a balance between demand and supply is achieved by
mixing hydrogen with natural gas and burning it in turbines as a NG-H2 mixture (Lee and
Gushee 2009). Major impacts of doing so are: 1- Cycling for baseload power plants will increase
maintenance cost and decrease the plant life. 2- In some cases, cycling emits pollutants like SO2
and NOx more than conventional natural gas plants (Barnes & Levine, 2011) (Drouineau, Maïzi et al., 2014).
When hydrogen is used as an intermediate fuel, fuel ce=lls are theoretically considered
promising H2-to-electricity conversion systems. However, the two significant challenges
associated with these technologies are high cost and low durability (DOE, Technical Plan- Fuel
practically impossible to run a PEM fuel cell with no nobel metal catalyst (Shao 2013). What is
the solution?
The BioGenerator as the first biologically based H2-to-electricity conversion technology, to be
successfully demonstrated on a laboratory scale, is a promising alternative capable of generating
power densities over 1800 W m-2 (Karamanev et al., 2013 and this study). The BioGenerator is a microbial hydrogen redox flow fuel cell, in the cathode of which the oxygen reduction is
replaced with the reduction of ferric ions which are continuously generated by respiration of
special types of microorganisms (Hojjati et al., 2013). Because of the bio-regeneration of the
oxidant, there is no need to use any metal catalyst in the cathodic reaction. This capability of the
BioGenerator will eliminate the cost issue as a significant barrier to the commercialization of
H2/O2 fuel cells (Wang et al., 2011). The BioGenerator has a unique configuration and is
targeted to be employed in certain stationary applications for smoothing the output of wind and
solar power plants. It looks like the BioGenerator is a good alternative to conventional fuel cells.
It offers a quite sustainable and cost effective solution. However, one important step towards the
commercialization of this technology is to demonstrate the durability of its performance. One of
the main components of interest in improving the lifetime durability of the BioGenerator is
improving durability of its anode electrode, where the hydrogen oxidation reaction takes place.
Unfortunately, available gas diffusion electrodes are very limited, costly and designed for use in
PEMFCs. Therefore, they do not properly respond to the requirements of the BioGenerator.
1.2
Objectives
On the basis of this introduction, the main objectives of the present work are:
1. To study and develop an anode electrode, based on an appropriate and reproducible
method, to be used in the BioGenerator that meets the unique requirements of this
system.
2. To study the effect of hydrophobicity of the gas diffusion layer of hydrogen oxidation
anode electrodes and the subsequent performance stability of the BioGenerator.
1.3
Thesis outline
Based on the objectives, this thesis is presented in the following chapters:
Chapter 1 is the introduction, discusses background of the work, and outlines the objectives of
the present study.
Chapter 2 introduces the fundamentals of fuel cells, and further describes the BioGenerator by
discussing its fundamentals, constitutive components, and involved reactions. Following that,
solutions to manage mass transport within the gas diffusion electrodes are reviewed. At the end,
methods for dealing with anode flooding are briefly assessed.
Chapter 3 describes the materials, methods of fabrication, different measurements and the set up
used in the development and study of the anode electrodes.
Chapter 4 shows the results obtained in this study. It starts with selecting the appropriate gas
diffusion medium by investigating the effect of hydrophobic content and gas permeability
characteristics of the backing layer and the consequent performance in the BioGenerator system.
In addition, it discusses the results obtained from the introduction of different amounts of PTFE
in the catalyst layer of the anode electrode using the spreading technique. Moreover, it brings the
results from the study of the long-term stability of the developed anode electrodes based on the
spreading technique and compares them with the results obtained from the use of commercially
available electrodes. Moreover, in this chapter, some modes of performance failure are
discussed.
Chapter 5 summarizes the conclusions obtained in this study and by providing recommendations,
Chapter 2
2
Background and Literature Review
2.1
What is a Fuel Cell?
A fuel cell is an electrochemical device that converts the chemical energy of a fuel directly into
electricity. Fuels and oxidants- either in gas or in liquid form- are fed into two separate
compartments. In one compartment, the oxidation reaction of the fuel takes place and electrons
are released, while in the other the electrons are consumed in the reduction reaction of the
oxidant. The former is called the anodic reaction, whereas the latter is referred to as the cathodic
reaction (O'Hayre et al., 2006). To better understand the working concept of a fuel cell, Figure
2-1 shows a conventional H2/O2 polymer electrolyte membrane fuel cell (PEMFC).
Load
e-
e-Anode
M
em
b
ra
n
e
Cathode
H+
H+
H2 O2
H2O
Figure 2-1 Scheme of a PEM fuel cell
In order for the electrical circuit to be charge-balanced and the overall reaction to be complete,
the generated protons must migrate to the cathode side through a proton exchange membrane
(PEM- a solid polymer electrolyte).
Anode: → (2-1)
Overall: → (2-3)
Both reactions (2-1) and (2-2) require to be catalyzed by usually a precious metal such as
platinum. This is especially true in the oxygen reduction reaction (2-2), whose rate is vitally
dependent on an adequate catalyst. A practical operation voltage of a single H2/O2 fuel cell is 0.7
to 0.8 V and for obtaining larger values, more cells need to be connected in series, forming a fuel
cell stack (Karimi 2011).
Fuel cells are mainly classified based on the electrolyte they use (Okada and Yokoyama 2001).
Of the most popular fuel cells, there are six types as follows:
1- Polymer Electrolyte Membrane (PEM) Fuel Cells
2- Direct Methanol Fuel Cells (DMFCs)
3- Alkaline Fuel Cells (AFCs)
4- Phosphoric Acid Fuel Cells (PAFCs)
5- Molten Carbonate Fuel Cells (MCFCs)
6- Solid Oxide Fuel Cells (SOFCs)
Table 2-1 gives a brief description of some of these technologies.
Table 2-1 A quick overview on fuel cell technologies (EERE 2011)
Fuel Cell Type Common Electrolyte Tem p . S tac k S
ize Efficiency Application Advantages Disadvantages
Polymer Electrolyte Membrane (PEM) Perfluoro- Sulfonic acid Ty p ic all y 8 0 °C <1 - 1 0 0 k W 60% Transport 35% Stationary
. Backup power
. Portable power
. Transportation
. Specialty
vehicles
. Distributed
generation
. Solid electrolyte
reduces corrosion & electrolyte management problems
. Low temperature
. Quick start-up
. Expensive
catalyst
. Sensitive to fuel
impurities
. Low temp waste
Alkaline (AFS)
Aqueous solution of KOH soaked
in a matrix
90 -1 0 0 °C 10 -1 0 0 k W 60%
. Military
. Space
. Cathode reaction
faster in alkaline electrolyte, higher
performance
. Low cost
components
. Sensitive to
CO2 in fuel and
air
. Electrolyte
Management Phosphoric Acid (PAFC) Phosphoric acid soaked in a matrix
150 -2 0 0 °C 4 0 0 k W 1 0 0 k W M o d u le 40%
. Distributed
generation
. Higher temperature
enables CHP
. Increased tolerant to
fuel impurities
. Pt catalyst
. Long start-up
time
. Low current
and power Molten Carbonate (MCFC) Solution of lithium, sodium, and/or potassium carbonates soaked in a matrix 600 -7 0 0 °C 3 0 0 k W -3 M W 3 0 0 k W m o d u le 45-50%
. Electric utility
. Distributed
generation
. High efficiency
. Fuel flexibility
. Can use a variety of
catalyst
. Suitable for CHP
. High
temperature corrosion and breakdown of cell components
. Long start-up
time
. Low power
Density Solid Oxide (SOFC) Yttria stabi-lized zirconia 700 -1 0 0 0 °C 1 k W – 2 M W 60%
. Auxiliary
power
. Electric utility
. Distributed
generation
. High efficiency
. Fuel Flexibility
. Can use a variety of
catalysts . Solid electrolyte Suitable for CHP &
CHHP
. Hybrid/GT cycle
. High
temperature corrosion and breakdown of cell components
. Long start-up
time
2.2
Fuel Cells Thermodynamics
The overall reversible fuel cell voltage is sum of the anodic and the cathodic half-cell potentials.
For example, in the case of a H2/O2 fuel cell, for
Anode:
→ (
) (2-4)
Cathode:
→
(
) (2-5)
Overall:
→ (
)
In reality, however, the fuel cell voltage is less than that of given by Equation 2-6. The fuel cell
performance is associated with irreversible losses. These are activation, ohmic and mass
transport losses.
2.2.1 Activation loss
Some portion of the voltage generated by any fuel cell is dedicated to drive the electrochemical
reactions on the surface of the electrodes. It makes sense that activation losses are dominant in
low current densities. The Tafel equation models the activation loss for an electrode as
(2-7)
, where i= current density (A cm-2), i0= exchange current density (A cm-2), and is a constant.
In thermodynamic equilibrium, the forward and reverse current densities are equal in a way that
the net current density is zero. Therefore, one can say iforward = ireverse= iequilibrium. This very small
dynamic equilibrium current density (iequilibrium) is known as the exchange current density (i0)
(O'Hayre etal., 2006). Different reactions in the presence of different catalysts exhibit different
exchange current densities. For example, at standard conditions, the exchange current density for
the hydrogen oxidation reaction at the surface of Pt in an acidic environment is 10-3 A cm-2, whereas for the oxygen reduction reaction this value is 10-9 A cm-2 (Vielstich et al., 2003).
2.2.2 Ohmic loss
In middle current densities, the dominate source of the loss is migration of ions and electrons
within the membrane and through the external circuit, respectively. This causes a drop in voltage
and this loss is estimated by Equation 2-8.
(2-8)
2.2.3 Mass Transfer loss
At higher current density, the performance of a fuel cell is mainly limited by mass transport of
reactants to the electrodes. Mass transfer limitation (fuel cell concentration loss) is given by
(2-9)
, where is a constant and iL is known as the limiting current density of a fuel cell. The limiting
current density is the full potential of a fuel cell in generating the highest possible current
density. At this point, the dominant source of current limitation is feeding the active
electrochemical sites with fuels. Consequently, this current is mostly limited to mass transfer of
reactants within the fuel cell. The limiting current density is expressed as
(2-10)
, where n is the number of electrons generated or consumed by the reaction; F is the Faraday
constant C mole-1; Deff is the effective reactant diffusivity within the catalyst layer m2 s-1; CR0 is
the bulk (flow channels) reactant concentration mole L-1; δ is the electrode (diffusion layer) thickness m.
Considering all the losses, one can model the net voltage generated by a fuel cell as:
[ ] [ ] (2-11)
On this basis, current density- voltage (i-V) measurement is used to quantify the overall
electrochemical performance of a fuel cell system. It represents the behavior of a fuel cell in a
full range of current densities. An i-V curve consists of three regions that each represents the
influences of special limitations on the system performance. Figure 2-2 shows a typical i-V curve
that could be obtained from a fuel cell. As seen, there are three regions: activation loss, ohmic
and mass transfer loss. Each of these regions represents the dominant source of overvoltage in
Ohmic loss Activation loss
Mass transfer loss
Figure 2-2 A typical i-V curve obtained in a fuel cell
2.2.4 Fuel Cell Efficiency
The efficiency of a fuel cell in reversible conditions is given as
(2-12)
Equation 2-12 tells us that efficiency of a fuel cell, even under reversible conditions, does not
reach 100% because usually ∆G<∆H(∆G=∆H-T∆S).Thisisknownasthereversibleloss and
the efficiency of the Carnot cycle is a well-known example of that. Considering thermodynamic
reversible effects, irreversible losses and losses in fuel supply, the fuel cell efficiency in practice
is given as
( ) (
) (
) (2-13)
2.3
Fundamentals of the BioGenerator
2.3.1 Idea
The idea behind the invention of the BioGenerator was to eliminate the cost and sluggish kinetics
associated with the oxygen reduction reaction in PEMFCs. In fact, the BioGenerator tries to use
the capability of microorganisms in the sustainable regenerative production of oxidants for the
reduction reaction in conventional fuel cells (Karamanev et al., 2013). Therefore, it is considered
the first biologically based technology for H2-to-electricity conversion that is capable of being
employed as part of the intermediate energy storage in renewables grid.
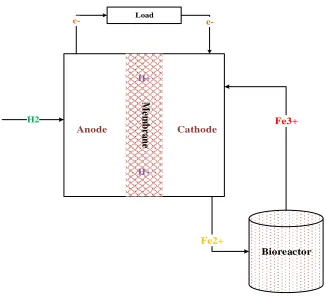
2.3.2 Structure and Reactions
Hydrogen is the preferable fuel for the anode of the BioGenerator. Through a catalytic oxidation
reaction, hydrogen is electrochemically split into protons and electrons (Equation 2-14). We
know that electricity is the flow of electrons. Therefore, on the other side of the electrical circuit,
a reaction is needed to consume these generated electrons. Ferric ions (Fe3+), the oxidants, are responsible for consuming these electrons in the BioGenerator and helping the anodic reaction
produce more electrons so we can have more electricity. Simply on the surface of graphite felt,
ferric ions accept electrons and are converted to ferrous ions (Fe2+) (Equation 2-15). The formed ferrous ions flow to a bioreactor, where through a microbial reaction, are oxidized back into
ferric ions, and in doing so, the bioregenerative cycle of the oxidant supply to the fuel cell is
completed (Equation 2-16 and Figure 2-3).
→ (2-14)
→ (2-15)
→
Bioreactor H2
Anode Cathode
M
em
b
ra
n
e
Load
e-
e-Fe3+
Fe2+ H+
H+
Figure 2-3 Scheme of the BioGenerator system
Based on the Nernst equation (Stock and Omra 1989), the reversible half-cell potentials and the
total reversible voltage of the BioGenerator are given as (Hojjati et al., 2013)
Anode: (
) (2-17)
Cathode:
) (2-18)
Overall:
(2-19)
2.3.3 Bipolar Plate (BPL)
In the BioGenerator, bipolar plates serve as dispensers for the reactant gas in the anode, and the
liquid electrolyte in the cathode (Figure 2-4). They also separate mechanically the anode from
BPLs function as an electrical conductor, and help manage heat conduction and water convection
within the fuel cell stack (Hermanna et al., 2003). They also provide structural support for the
whole stack. In view of these functions, properties such as good electrical and thermal
conductivity, corrosion resistivity and mechanical stability are among those that a bipolar plate
must meet (de Waalb et al., 2003; Hermanna et al., 2003). Taking into account these factors,
bipolar plate can be among the most critical component of a fuel cell stack. This is true to the
extent that bipolar plates can account for about 40% of the cost and 80% of the total weight of a
stack (Brady et al., 2004). In terms of conductivity, metallic materials such as gold, having an
electrical conductivity of 45000×103 S/cm; Fe alloys, 5300×103 S/cm; Ti, 2400×103 S/cm with higher electrical conductivity as compared to materials like carbon-polymer composites, ~ 1
S/cm and graphite 103 S/cm, are prime choices (Steele and Heinzel 2001). In addition, since the graphite is normally porous, in order to prevent the crossover of reactants, a binder or resin is
added to decrease its porosity (Steele and Heinzel 2001). Furthermore, plates are usually
machined to make channels and these channels carry the reactant gases from the inlet all the way
to the outlet of the plates (Cunningham et al., 2007). The configuration of channels such as depth
and width as well as the flow field pattern have a large impact on how reactants are distributed
across the electrodes, where they take place in the oxidation or the reduction reactions (Li and
Sabir 2005). For example, in a patent, an increase of 50% in performance was obtained through
optimizing only the flow field network and the reactant gases distribution fields (Watkins et al.,
1992). Currently, different flow field designs are used in fuel cell research (Figure 2-5). The
parallel and the serpentine, however, are the most widely-used designs. The former configuration
is simple to make, has lower pressure drop between inlet and outlet, and more uniform
distribution of reactant gases over the surface of the electrodes. However, one drawback of the
parallel flow field is its higher susceptibility to be blocked by liquid water. However, due to the
structure of the serpentine flow field, a higher gas flow rate can push the liquid water out of the
channels more easily than in the case of parallel channels (Hongthong et al., 2007, Li and Sabir
2005).
All in all, bipolar plates are crucial for a fuel cell stack and extensive research is being
undertaken to come up with a suitable design for flow channels as well as optimum chemical
compositions that meet targeted durability, mechanical stability, electrical and thermal
plates with flow fields for the cathode side, since there is highly corrosive liquid coming from
the bioreactor, flowing in the cathode side bipolar plate channels.
Figure 2-4 A complete scheme of a fuel cell system. Graphite plates refer to bipolar plates in this picture (Scientific Computing World 2003)
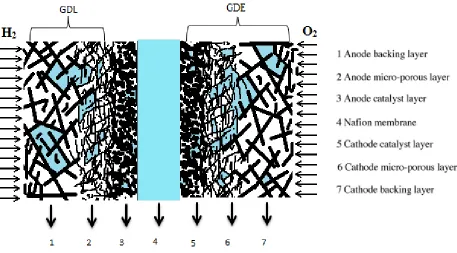
2.3.4 Gas Diffusion Layer (GDL)
The GDL in the BioGenerator is used at the hydrogen anode electrode. Here, as a baseline,
discussions begin with the role of GDLs in conventional PEM fuel cells. The anode and cathode
conventionally consist of two layers. The first faces the bipolar plates and is called the Gas
Diffusion Layer (GDL) and the second faces the membrane and is known as the Catalyst Layer
(CL). A GDL is a carbon-filled porous media composed of two sub-layers. A macro-porous
substrate (the backing layer) is the first sub-layer that serves as a mechanical support as well as a
conductor for electrons flowing between the catalyst layers and bipolar plates. The backing
Layer (BL) also facilitates gas and liquid mass transport within the GDL (Figure 2-6). Often to
enhance mass transfer and to provide better electrical contact between the BL and the CL, a very
thin sub-layer known as the Micro-Porous Layer (MPL) is formed on the top of the BL and
usually contains carbon particles mixed with binders such as Polytetrafluoroethylene (PTFE)
or/and a sulfonated tetrafluoroethylene-based-fluoropolymer ionomers such as Nafion. When
flooding is an issue, carbon particles are impregnated with PTFE and if the GDL suffers from
drying, Nafion usually is the option. Sometimes to obtain higher porosity, a pore-forming agent
such as Li2CO3 or ammonium carbonate is added to the MPL.
2.3.4.1
Backing Layer (BL) and Mass Transport
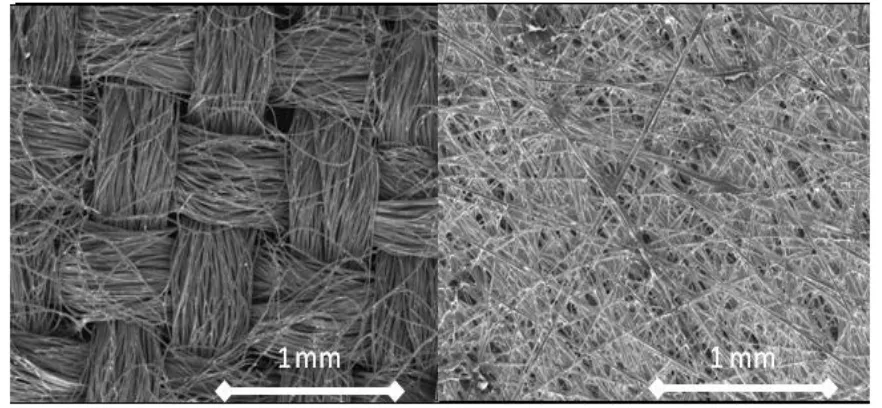
As already mentioned, the GDL is often constructed of two sub-layers; the BL and the MPL. The
BL is usually made of carbon cloth or paper. Carbon paper structure is very random
(non-woven), while cloth consists of an orderly network of fibers (woven). Figure 2-7 shows
microscopic images of these materials.
Figure 2-7 Microscopic pictures of left) carbon cloth and right) carbon paper (FuelCellEtc 2013)
The thickness of the BL is an important parameter. A thinner BL has lower electrical resistance
plus the gaseous reactants can move easily, but it is not preferable since having smaller pore
volume can cause water flooding. For example, the optimal thickness for a carbon paper is
between 275- 370 µm. The backing layer is usually treated with a hydrophobic polymer such as
PTFE or FEP to enhance liquid water transport. The same trend is valid for PTFE. Too low of a
PTFE will cause liquid flooding while too high of a PTFE content will increase the electrical
resistivity as well as decrease the gas permeability due to decreasing pore volume. In one study,
different GDLs impregnated with 10 to 40 wt.% PTFE were prepared, where 10% gave the best
performance for PEMFCs (Lim and Wang 2004). It is generally agreed that higher pore volume
will enhance mass transfer. In addition to the total porosity, pore size distribution is a crucial
Kong et al (2002) defined the distribution of pores in their GDLs (treated carbon cloths) based
on pore diameter in three zones: micro-pores (0.03- 0.06 µm), meso-pores (0.06- 5.0 µm), and
macro-pores (5.0- 20 µm). Their experiments with different levels of humidity showed that the
distribution of pore size is a more crucial morphological factor in controlling mass transport than
total porosity. They concluded that macro-pores in the BL could prevent flooding better and lead
to a higher performance in PEMFCs (Kong et al., 2002).
2.3.4.2
MPL and Mass Transport
In addition to the BL, the MPL plays a dominant role in the performance of a fuel cell. The MPL
is a micro-porous layer consisting of carbon particles and a hydrophobic binder such as PTFE.
The role of the MPL is to 1- provide micro-size paths of pores (between 0.01–0.05 μm in
diameter) resulting in better mass transfer 2- provide better mechanical compaction and electrical
contact between the BL and the catalyst layer. Like the BL, in the MPL also, the amount of
PTFE can influence the performance. Park et al (2008) investigated the amount of PTFE in the
MPL on the performance of PEMFCs, where it was altered from 10 wt.% to 40 wt.%, and the
best performance was obtained when the PTFE content occupied only 20 wt.% of the MPL
loading. Increasing PTFE, especially in high current densities, decreases the chance of blocking
pores by water droplets, enhancing liquid mass transport, which can result in better cell
performance.
The carbon loading can influence the performance of the MPL as well. A low carbon loading is
not desirable because it can cause flooding in the MPL, whereas too much carbon will increase
the diffusion resistance of the gaseous reactant within the GDL. Usually a loading of 1.5- 2.0 mg
cm-2 is selected for the MPL of PEMFCs. Park et al (2006) changed the carbon loading in their MPL from 0.2 to 2.0 mg cm-2 and observed that the best performance (air as the oxidant) was obtained with the micro-porous layer loaded with 0.5 mg cm-2 (Park et al., 2006).
Recently, there has been growing interest towards controlling the properties of the MPL such as
porosity, electrical conductivity, and hydrophobicity, by selecting different carbon materials.
Passalacqua et al (2001) studied various kinds of carbon in the MPL and their results showed
that Acetylene Black (ASB) could exhibit the best performance in a PEM fuel cell as compared
of ASB (Passalacqua Squadrito et al., 2001). In another study conducted by Priyanka et al
(2008), the influence of pore size distribution of different carbon papers prepared by various
laminates on performance of a PEM fuel cell was examined. Results show a better performance
was achieved when pore size distribution mostly fell in the range of 30- 50 µm (Priyanka et al.,
2008). For example, Black Pearls 2000 has larger pore volume (2.67 cm3 g-1) than Acetylene Black (0.23 cm3 g-1). Wanga et al (2006) proposed a high efficiency MPL of composite carbon black consisting of 20 wt.% Black Pearls 2000 (Cabot Corp, Boston, Mass.) and 80 wt.%
Acetylene Black. That team rationalized that presence of a large number of hydrophobic
meso-pores (0.05– 7.0 µm) is essential for ensuring a reliable liquid mass transport (Wang et al.,
2006).
2.3.4.3
GDL and Electrical Conductivity
The electrical conductivity of a GDL is usually measured in two directions: through (cross-)
plane and in plane. Since PTFE is a non-conductive polymer, the conductivity of the GDL drops
by adding PTFE. Ismail et al (2010) investigated the effect of the PTFE-treatment of different
backing layers and MPLs on the electrical conductivity of the GDL. They concluded that
through-plane conductivity decreased as PTFE content increased in both the backing layer and
the MPL. However, the conductivity of the BL for in-plane directions remained almost constant,
and the reason for this was that the structure of carbon fibers is fixed and does not change with
change in PTFE. The in-plane conductivity of the MPL, on the other hand, decreased as PTFE
content increased (Ismail et al., 2010). In Xua et al (2007) experiments, PTFE loading in the
cathode GDL of a direct methanol fuel cell was the subject of a study and it was found that 40%
PTFE is optimal (Xua et al., 2007).
2.3.4.4
GDL- Summary
Overall, the GDL serves some very important roles including mechanical support for the catalyst
layer, electrical conductor for electrons reaching or leaving the catalyst layer, and enhancement
of gas and liquid transport. The fulfillment of each of these functions requires special
modifications and often improving one will cause a decline in the others. Therefore, whenever
each function needs to be improved, the impact of any changes must be checked with the
layer to an extent that does not affect the electrical conductivity, the fuel permeability, and also
the lamination of a micro-porous layer on that backing layer are often the options chosen.
Adding a hydrophobic polymer like PTFE to both the BL and the MPL is a crucial step.
However, the thickness of the backing substrate, type of the carbon materials, their loading, and
the content of PTFE all have to be also considered thoughtfully.
2.4
A Brief Assessment of Flooding Management in Similar
Hydrogen-Based Systems
2.4.1 Alkaline Fuel Cells
The anode and the cathode fuels in AFCs are usually the same as those in PEMFCs. However,
the difference is in the electrolyte. The electrolyte in AFCs is an aqueous alkaline solution such
as 30% KOH. The anodic and the cathodic reactions are (O'Hayre et al., 2006):
Anode: → (2-20)
Cathode: → (2-21)
Overall: → (2-22)
AFCs operate at temperatures around 90- 100 ºC. Water is the byproduct of the anodic reaction
and removed by evaporation through recirculating of the electrolyte (De Geeter et al., 1992). The
AFCs initially used in space applications (the Apollo project) were operating at 80- 149 ºC and
pressures between 29 psig to 299 psig, while in the atmospheric applications, they operate at 1.0-
3.0 psig and 40- 75 ºC (McLean et al., 2002). The electrodes are usually fabricated by coating a
hydrophobic catalyzed layer onto a surface of a GDL and then these two layers are laminated
onto the surface of a porous metallic baking layer to form a three-layer electrode. The catalysts
used for the anode electrode are Pt or Pd (0.12- 0.5 mg cm-2), Ni and Ag. Although using Ni and
Ag as the catalyst reduces the manufacturing cost, it will make the electrode degradation faster
because the electrolyte is highly corrosive (Gülzow 1996).
2.4.2 Phosphoric Acid Fuel Cells
The reactions in phosphoric acid fuel cells (PAFCs) are the same as those in PEMFCs. However,
the difference is that the electrolyte in PAFCs is composed of phosphoric acid (H3PO4). The
0.1- 0.2 mm silicon carbide (SiC) matrix (Larminie and Dicks 2003). PAFC electrodes are
usually made of a hydrophobic binder such as PTFE and Pt/C as the catalyst. PTFE content in
the catalyst layer is varied between 20- 40 wt.%.
2.4.3 Immersed-Tank Electrowinning
Electrowinning or electroextraction is referred to the process of extracting metals from their ores
via metal electrodeposition (Free, et al. 2012). In a patent (Allen et al. 1994), hydrogen anodes
immersed in a tank containing zinc sulfate (ZnSO4) were used as the electron generator in a zinc
electrowinning system.
Cathode: → (2-23)
Anode: → (2-24)
A three-layer hydrogen anode electrode was made as shown in Figure 2-8.
Figure 2-8 Scheme of an immersed hydrogen electrode used in zinc electrowinning (Allen et al., 1993)
A catalyst layer composed of platinum and PTFE as the binder was coated onto the surface of a
thick (1.6 mm) tightly woven graphite-fiber cloth. Furthermore, a polysulfone adhesive layer was
placed in between a porous membrane (Celgard®) and the electrode, in order to bind the catalyst layer and the membrane better together. The electrolyte penetrated to the catalyst layer through
2.5
Summary
By looking into the fuel cell systems that employ liquid electrolytes, one can conclude that the
effort has been to prevent the flooding of the gas-fed electrodes by making them hydrophobic,
employing multilayer gas diffusion electrodes to enhance mass transfer, and/or making some
configurations to prevent penetration of the electrolyte into the electrodes. The idea of making
GDLs hydrophobic is to hinder water immovability in pores structure and is usually achieved by
impregnation of the backing layer by PTFE and/or adding PTFE to the MPL ink. In addition,
porosity can be controlled by altering hydrophobicity content, carbon material, curing
temperature, and compression of the GDL and so on. For better mass transport in the GDL, the
effort should be in providing an ideal path structure for gas to flow evenly through the GDL and
liquid to move easily within the GDL. The fundamentals of two-phase transport in the gas
diffusion electrode is the same, either for liquid electrolyte fuel cells or polymer electrolyte fuel
cells. Therefore, PEMFCs, as the most developed and well-studies types of fuel cell are good
baselines to begin with in order to understand water management in the BioGenerator system.
From the perspective of patterning the electrode fabrication, in the first observation, the problem
of flooding in some of the liquid electrolyte fuel cells such as PAFCs or AFCs looks very similar
to the BioGenerator. However, one should take it to account that the operating conditions and
configurations and the electrolyte nature of those fuel cells are quite different from the
BioGenerator’s.Assuch,PAFCsoperateatrelativelyhightemperatures(150- 200 ºC) and this
factor, to a notable level, helps evaporation of liquid penetrated into the gas diffusion electrodes.
For example, Hydrogen-based electrowinning employs a very thick GDL that in the case of the
BioGenerator could decrease the performance due to high electrical resistivity. Therefore,
because of the unique configuration and operating conditions of the BioGenerator, based on the
information from other types of fuel cells, research conducted to develop electrodes that could
3
Materials and Methods
3.1
Anode Electrodes
3.1.1 Preparation of the Backing Layer (BL)
As mentioned earlier, anode electrodes were composed of three layers; the backing layer (BL),
the micro-porous layer (MPL), and the catalyst layer (CL). Untreated carbon cloths and papers
were hydrophobized by impregnation in 30 wt.% PTFE dispersion (DuPont Teflon®). In order to
vaporize the remaining emulsifiers, the treated materials were heated in oven for 10 minutes at
270 ºC. Toray T-120 and CC4 Plain (Fuel Cell Earth LLC) were used as carbon papers and
cloths, respectively.
3.1.2 Preparation of the Micro-porous Layer (MPL)
To enhance mass transfer, mechanical adhesion, and electrical contact between the BL and CL, a
thin layer composed of carbon and PTFE was laminated on top of the BL. A dense ink of carbon
powders (Vulcan XC72) and PTFE with isopropyl alcohol as the solvent was mixed
ultrasonically for five minutes and then laminated onto the surface of BLs using a
height-adjustable blade-contained apparatus (spreading technique). To obtain better compaction, prior to
the baking, the prepared GDLs were hot pressed at 80 ºC under 100-psi pressure for 15 seconds
The prepared gas diffusion layers (GDLs) were cured in oven for 2 hours at 345 ºC. Total
loading of MPLs were 1.5± 0.17 mg cm-2 with 30 wt.% content for PTFE.
3.1.3 Preparation of the Catalyst Layer (CL)
There are four conventional widely used ways plus three comparatively new methods mostly
employed on lab scale, each of which has relative advantages and disadvantages in terms of
practice and fundamentals. The four are brushing, spreading, spraying, and screen printing while
the three are electrodeposition, catalyst powder deposition, and sputtering.
In conventional methods, catalyst ink is directly applied onto the surface of the GDL. Catalyst
ink is referred to a mixture of Pt/C particles and a binder (often PTFE or/and Nafion) that is
uniformly mixed with the help of a solvent. Depending on the required degree of viscosity,
3.1.3.1
Brushing
In brushing (painting) method, a wet mixture of catalyst and binder is directly applied onto the
surface of the GDL with a paintbrush (Figure 3-1). For better paintability, a higher viscous
solvent like glycerol is usually used. Painting (brushing) seems to be easy and low cost, but the
problem associated with this method is its non-uniformity that will result in lack of
reproducibility and uniformity. In addition, it will require art and can be very time consuming for
large-scale production of electrodes. When PTFE is the binder, often for achieving three-phase
contact in the electrode, a thin layer of Nafion solution will be brushed onto the surface of the
GDE. The catalyst layer together with the GDL makes the gas diffusion electrode (GDE). The
former is named ionomer impregnation or Nafion post-coating. The Nafion post-coting was not
used in this study because the lowest possible degree of hydrophilicity was desired.
Figure 3-1 Scheme of brushing method
3.1.3.2
Spraying
In the case of spraying, a mixture of Pt/C and ionomer is sprayed (usually using an airbrush
apparatus) onto the surface of the GDL (Figure 3-1). It is obvious that less viscous mixture is
required for spraying. The benefit of this method is its ease of use, being fast and eventually you
could fabricate a very thin and uniform layer of catalyst. However, one drawback of spraying is
that due to its watery (thin) structure, the ink, to some extent, will penetrate into the GDL and
decrease the catalyst utilization. Furthermore, this may possibly cause flooding in the GDL if the
Figure 3-2 Badger Airbrush Co 150-5-PK Professional used to apply the catalyst layer onto the surface of the GDL
3.1.3.3
Spreading
Spreading, on the other hand, is a widely used method for the CL lamination, in which with help
of an adjustable blade-contained apparatus or a heavy stainless steel cylinder, a paste of catalyst
mixture is applied onto the surface of the GDL. One drawback of this technique is that most
probably a thin solution cannot be used because it has to be in paste form. However, it has two
advantages to other methods: it can give a uniform and reproducible catalyst layer and a good
control over the thickness of the CL. Beside all; it is a suitable option for large scale of electrode
production.
Figure 3-3 Knife spreader (Mitutoyo, TQC Co.) used in this study to laminate MPLs and CLs. Height of the knife is adjustable to obtain different uniform thicknesses
3.1.3.4
Catalyst Coating
In all the mentioned methods, catalyst layers loaded with 40 wt.% PTFE and 0.5± 0.08 mg Pt
cm-2 (Platinum, nominally 40% on carbon black; Alfa Aesar Company) were laminated on MPLs using painting, spraying, or spreading techniques. The catalyst ink was a hydrophobic
few drops of distilled water, then isopropyl alcohol was added, and the entire solution was
mechanically mixed for 30 minutes. After that, the PTFE powder was added to the mixture and
followed by mixing for at least 30 minutes until a viscous ink formed. To obtain better
compaction, prior to the baking, the prepared GDLs were hot pressed at 80 ºC under 100-psi
pressure for 15 seconds. The prepared catalyst layers (CLs) were cured for 2 hours at 345 ºC to
ensure all the PTFEs were melted within the structure of the CL and bound the carbon particles
together. The ink for spreading and painting comprised a dense mixture, while for spraying a
diluted ink was prepared.
3.1.3.5
Electrodeposition
Electrodeposition is a technique performed under either DC or pulse current. The advantage over
pulse-electrodeposition is that it will allow us to control the growth of metal ion clusters that will
enable us to produce very small catalyst particles and a high surface area. In addition, due to the
presence of the ionomer (e.g. Nafion) on the surface of the GDL, metal ions will sit on places
where ionomer is present, and it can ensure a good number of catalyst particles deposited near
regions both ionic and electronic pathways are present (Kim and Popov 2004; Kim et al., 2004;
Summer et al., 1998 Rao and Trivedi 2005). In addition to electrodeposition, sputtering method
is capable of fabricating very thin layer of catalyst layer (~10 nm) and loading as low as 0.04 mg
cm-2 as compared to the state-of-art methods with loading in neighborhood of 0.4 mg cm-2 (O’Hayreet al., 2002).
For the fabrication of the BioGenerator anode electrode, platinum electrodeposition was tested to
coat a layer of catalyst particles onto the surface of a hydrophobic GDL. 0.1 M Pt (NH3)4Cl2 was
used as the electrolyte solution containing platinum ions. Different constant and pulse current
densities ranging from 20 mA cm-2 to 400 mA cm-2 were employed using different duty cycles. (karimi and Foulkes 2012). However, no platinum deposition was obtained and the reason might
be the absence of the ionomer on the surface of the MPL to help exchange platinum ions on the
surface of the MPL. Figure 3-3 illustrates the working configuration of the electrodeposition
Potentiostat
Ref Work Aux
Auxiliary electrode (Pt foil)
GDL to be deposited
Electrolyte (Pt (NH3)4Cl2 )
e-Pump
0.1MPt (NH3)4Cl2
295 K
Pt2+
Cl
-Electrolyte reservoir
Figure 3-4 Illustration of the continuous flow Pt- electrodeposition system. 0.1 M Pt (NH3)4Cl2 was used as the electrolyte, and the electrodeposition bath volume was 15 mL.
3.2
Flow Fields, Cathode and Membrane
As a fuel cell, the BioGenerator uses a fuel and an oxidant. The anode fuel is hydrogen gas and
the cathodic oxidant is the solution of ferric ions coming from the bioreactor. Graphite plates
were machined using CNC (Computer Numerical Control) milling machine. For smaller cells (5
cm2), a serpentine structure (Figure 2-5-b) was chosen for both the gas and the liquid side. However, for larger area (400 cm2), to help the back-diffused water exit the anode channels more easily, a parallel serpentine flow field with narrow channels was proposed (Figure 2-5-c) for the
proposed for the liquid side. The reason of using parallel flow field in the liquid (cathodic) side
was to avoid pressure drop and more uniform distribution of the oxidant concentration in the
cathode. The depth and width of channels for the gas side were 2 mm and 1.5 mm, while the
depth and width of channels for the liquid side were 2.5 mm and 3 mm, respectively.
Figure 3-4 shows picture of bipolar plates fabricated for 10 kW BioGenerator fuel cells having
active area of about 20cmby 20cm.
Figure 3-5 Left hand side is picture of the bipolar plate used for the liquid side. Wider parallel channels help avoid pressure drop and decrease the chance of blocking channels
with particulates found in liquid flow. The picture at the right shows parallel-serpentine flow fields for the gas side.
A cation exchange HSF Selemion membrane (Pupkevich et al., 2013) was used as the
membrane. For conditioning, membranes were placed in distilled water for 24 hours prior being
used in the fuel cell. Graphite felt (SIGRATHERM KFA-5, SGL, Wiesbaden, Germany) was
used as the cathode electrode. Activation of the graphite felts was performed as described in
3.3
Laboratory Set-up of Fuel Cells for the BioGenerator
Figure 3-5 shows the continuous flow test station used in this work.
Figure 3-6 BioGenerator fuel cells laboratory set-up
The BioGenerator fuel cell test station consisted of membrane electrode current collectors
assembly, pumps for the supply of the cathodic electrolyte and a Chroma 6312 electronic load
for maintaining a constant current within the fuel cells. The same cathodic electrolyte was run
through series of fuel cells electrically connected together. A 600 L airlift bioreactor (Karamanev
et al., 2013) was used for continuous supply of the electrolyte to the fuel cells cathode
compartment. The iron oxidizing bacteria were a mixed culture dominated by L. ferriphilum. L.
ferriphilum is an autotrophic microorganism that uses CO2 as the only carbon source. The pH in
the bioreactor was between 0.7- 0.9 (2- 3% H2SO4). The temperature in the bioreactor was 20ºC.
For the experiments in this study, electrolyte flow rate was 33 ml min-1, and the total concentration of iron ions was 40 g L-1. Deionized water was added periodically to compensate for the evaporation of water in the bioreactor. In addition, H2 pressure and flow rate were kept at
3± 0.5 psig and 200 ml min-1, respectively.
3.4
Ex-situ Characterization Techniques
3.4.1 Through-Plane Gas Permeability
Through-plane gas permeability of the prepared backing layers was measured with air using an
in-house fabricated apparatus (Figure 3-6) since using hydrogen as the experimental gas was not
observed in the case of air (Phillips et al., 2012; Gostick et al., 2006). Darcy’slaw proposes the
following equation for measurement of gas permeability:
(3-1)
,whereνissuperficialfluidflowvelocitythroughthemediumm s-1
; K is permeability of the
medium m2;∆PistheappliedpressuredifferencePa; µ is the fluid viscosity (Pa s);and∆xisthe thickness of the medium m.
Figure 3-7 Scheme of the apparatus used for permeability measurements of the BLs (Karimi 2011)
However, Equation 3-1 is given for calculating the permeability of incompressible fluids,
constant properties, laminar flows under steady state conditions. Equation 3-2 represents the
solution of Darcy’s law for compressible fluids for one-dimentional flow (Geertsma 1974;
Gostick et al., 2006):
(3-2)
, where Pin is the inlet pressure; Pout is the outlet pressure; L is the length of sample; T is the
temperature; R is the universal gas constant; MWf is the molecular weight of fluid; µ is the
viscosity of fluid; K is permeability of the medium m2; and m´ is the fluid mass flux through the
sample kg s-1m-2.
Samples were placed into the experimental apparatus (Figure 3-6) and checked to ensure no air