Article
Comparing Approaches for Evaluating
Digital Interventions at the Shop Floor
†
Francisco José Lacueva-Pérez1*, Lea Hannola2, Jan Nierhoff3, Stelios Damalas4, Soumyajit Chatterjee2, Thomas Herrmann5 and Marlene Schafler4
1 Department of ICT-Multimedia, ITAINNOVA Zaragoza, Spain; [email protected]
2 Industrial Engineering and Management, Lappeenranta University of Technology, Lappeenranta, Finland; [email protected]; [email protected]
3 Institute of Applied Work Science, Ruhr-University Bochum, Germany; [email protected] 4 Smart Production and Human-Centered Solutions, Virtual Vehicle Research Center, Graz, Austria;
[email protected]; [email protected]
5 Institute of Applied Work Science, Ruhr-University Bochum, Germany; [email protected] * Correspondence: [email protected]; Tel.: +34-974-012-562
† This paper is an extended version of our paper published in Proceedings of the 11th International
Conference on PErvasive Technologies Related to Assistive Environments (PETRA 2018), Island of Rhodes, Greece, 26–29 June 2017.
Abstract: The introduction of innovative digital tools for supporting manufacturing processes has far-reaching effects on an organizational and an individual level due to the development of Industry 4.0. The FACTS4WORKERS project funded by H2020, i.e. Worker-Centric Workplaces in Smart Factories, aims to develop user-centered assistance systems in order to demonstrate their impact and applicability at the shop floor. To do so it is important to understand how to develop such tools and how to assess if advantages can be derived from the created ICT system. This study introduces the technology of a workplace solution that is linked to a specific industrial challenge. Subsequently, a 2-stepped approach to evaluate the presented system is discussed. Heuristics, which are an output of project “Heuristics for Industry 4.0”, are used to test if the developed solution covers critical aspects of socio-technical system design. Insights into the design, development and holistic evaluation of digital tools at the shop floor should be shown.
Keywords: digital interventions; shop floor; evaluation framework; heuristics; smart factory
1. Introduction
There have been increasing research activities in studying the introduction of digital tools and changes in work practices at shop floor level in production environments during the last decade [e.g. 1, 2, 3]. Büttner et al. [4] have made an overview of the studies done in the area of Augmented Reality (AR) and Virtual Reality (VR) concepts, especially their utilization in supporting and facilitating industrial use-cases. They also propose an interactive and community-driven tool for the visualization of the design space, which impose additional requirements for the systems of the future [4]. However, the challenges identified when applying AR/VR applications in smart manufacturing environments call for further research. Haslgrübler et al. [5] present how Internet of Things (IoT) devices, i.e. ubiquitous sensors, can be used to perform workflow and attention recognition, and how these devices provide critical notifications perceived by workers in an industrial environment to keep workers away from situations, which are harmful or economically suboptimal. Further, Funk et al. [6] have made a comparison between the instructions of head-mounted displays (HMD), tablets, baseline paper instructions and in-situ projected instructions with an abstract Lego Duplo assembly task. The results of the study [6] indicate that assembling parts is considerably faster, workers make less errors and have less cognitive load when using in-situ projected instructions compared to HMD instructions, and locating positions is
considerable slower using HMDs. Thus, the authors [6] believe that the hands-free possibility of in-situ projection will have great potential for instruction systems at workplaces, because tablet instructions may interfere a two-hand assembly tasks and HMD instructions have problems to be accepted by workers. In addition, Kritzler et al., [7] present another study on a digital tool, i.e. RemoteBob, for supporting on-site workers by remote experts during ad hoc maintenance tasks. RemoteBob was implemented as a proof of concept in a lab environment and the study provides hands-on experience to industry experts on how the proposed concept could function in practice [7]. This study is a part of the on-going FACTS4WORKERS (F4W) project1, which develops and demonstrates worker-centered solutions that support the inclusion of increasing elements of knowledge work on the shop floor of smart factories. The F4W project’s primary goal is to develop, pilot and evaluate a worker-centered solution, which is designed for industrial shop floor workers by using new models for work optimization and utilization of production systems. The main objective of the project lies on increasing job satisfaction, problem-solving and innovation skills of workers, and increasing the productivity of factories. The shop floor workers are the key personnel to evaluate the interventions through digital tools, which are expected to fulfill these project objectives.
This study introduces a solution with digital interventions at the shop floor (section 3) and introduces two approaches for evaluating the solution from the workers’ perspective (section 2). The first approach is the F4W Evaluation Framework, which has the goal to demonstrate and evaluate the impacts of performed interventions. The framework is developed as a combination of several tools and methods, taking existing ones from literature as a base, tailoring them and defining new approaches when considered reasonable for measuring these changes and for demonstrating that these changes result from the digital interventions.
Existing job satisfaction tools do not completely cover all the factors we consider important for measuring the project goals or they do not measure the worker’s feelings about the Information System (IS) being used [8, 9]. In the F4W project, we consider the introduction of new IS solutions and new work practices as aspects that reciprocally affect each other and thus should be seen as one entity. Existing job satisfaction literature does not consider these changes in worker practices and IS solutions as one intervention. In addition, system acceptance and success models explain user satisfaction and system use as dependent of system and information quality and as determinant of net benefits but do not show how to measure them. The assessment of system quality (HMI interaction in particular) does not include shop floor workers. The presented evaluation framework is a more detailed approach to evaluate the acceptance of a system.
Using heuristics is the second approach of this study for evaluating the digital interventions. The used heuristics originate from the project “Heuristics for Industry 4.0” (hi4), and are utilized to deepen the understanding of the developed IS solution in regard to the most critical aspects of socio-technical system design and to identify possible flaws or shortcomings. Heuristics promise to be a pragmatic approach, in which the most critical flaws can be identified with a reasonable amount of effort. They do not claim to produce perfect 100%-solutions, though.
Thus, this study increases the theoretical and practical understanding of two different kinds of evaluation approaches in the context of digital interventions at the shop floor of industrial production environments.
2. The evaluation frameworks
2.1. F4W Evaluation Framework Method and Strategy
The F4W evaluation framework is introduced in detail in [10]. The framework takes existing Information System success models [11, 12, 13] as base and extends them aiming to measure the impacts of an IS intervention at production environment shop floors.
Evaluations are based on two different concepts: Impact Analysis (IA) and Validation, following the work of [14]. The IA is used for assessing the designed artefacts’ impact on individual and organizational levels. According to the project’s main goal, the individual impact comprises job satisfaction as well as innovation and problem-solving skills, whereas the impact on an organizational level includes measures of productivity. For measuring the impact, the following dimensions, which represent our project goals, are used: 1) autonomy, 2) competence, 3) variety, 4) relatedness, 5) protection, 6) efficiency, and 7) quality. Finally, it anticipates the expected impact IS artefacts would have on the IPs context of use.
The Validation refers to the process of determination if the evaluated artefact provides the (system, information and interaction) quality the user expects. The results of the validation strongly depend on the maturity of the artefacts. If we consider a mock-up/demonstrator, a functional prototype/pilot or a deployed solution, we can expect to probe the functional feasibility of an idea (proof of concept), the value pro-vided by a solution (proof of value) or the capability of a solution for addressing complex issues of operational feasibility (proof of use).
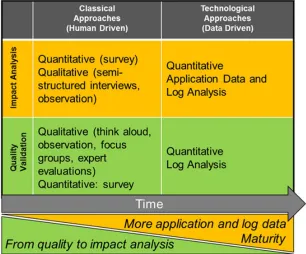
Figure 1. Tools and methods for the evaluation framework.
Figure 1, shows the tools the framework considers for performing the evaluations. This set of tools tries to find a balance between the support to scientific research and the use by IT practitioners, the need to support artefacts having different development maturity state (mockups, prototypes, pilots) and its use on under different legal and regulatory environment.
As said, the maturity of the artefacts is going to determine the kind of tools that can be used and how IA and validation results can be interpreted. Classical approaches (CA) are worker driven. Data are directly obtained from workers by interviewing or surveying them. Under this category, we consider the set of tools is the academic SotA of tools and methods for evaluating purposes. In addition to these academic approaches, as the project provides workers with prototypes for use in short/long term periods, also Technological Approaches (TA) could be taken in advantage and get some associated metrics.
considered which take advantage of this data, wherever, observing the legal conditions, application data can be accessed and/or the logger Building Block (BB) can be deployed and configured.
2.3. F4W Impact Assessment Quantification Process
The Process of Quantification (PQ) of the IA has the objective of calculating indicator of impact of interventions on ID respecting worker anonymity as far as possible. It requires the combination of data gathered using both CA and TA tools. That means dealing with multisource data, having different metrics. These raw data must converge in common metrics which can be used for determining the degree of project objectives achievement. The definition of the quantification and interpretation strategies are based on the Goal-Question-Measurement process defined [15] and the processes followed in Big Data projects for transforming data in knowledge [16]. This problem formulation, how to move from raw data to a set of project KPIs, can be divided in more specific problems to be solved considering the different features of the handled data and of the surrounding evaluation environment. These sub-problems are described in next paragraphs.
The effect of external factors in the results of evaluations must be determined. External factors biases can be determined using a Control Group (CG) of workers (workers not using F4W solutions). However, the temporary events can affect feelings evolve in time [17] and they affect both CG and F4W. In consequence, although the effect of temporary events quickly blurred after it is finished, they can compromise the results of an evaluation. In particular, the temporary events can affect the results when they happen just before or during the evaluation. The general rule is to note the event occurrence as a possible explanation of unexpected results. When the event happens before starting the evaluation, whenever it is possible, the best way is to delay the full evaluation or, if it is not possible, to perform the second part as close to the first as possible (2 or 3 weeks). In the case the event happens between both evaluations, if possible the second must be delayed as much as possible (3 or 6 weeks).
Considering the nature of the data, first problem to consider is that data obtained from interviews are qualitative. In these cases, it is necessary to bring the data into context and interpret the workers answers to gain knowledge about the impact and the effects that F4W solutions have on individuals and the organization. Relevant statements from the transcriptions of the interviews or from the interviewers’ notes can be extracted and encoded to core-statements and them assigned to categories representing the possible impact dimensions [18]. Finally, the results are sorted and ranked by relevance (counting the references to each category- frequency-, the content of the category –relevance-, etc.). The coding and ranking are subjective processes to some extent. However, this can be addressed by making each step transparent and by including a team of researchers into the analysis [19]. In doing so, the results that are gained from the qualitative data collection are comparable over different use cases. They furthermore can be normalized and hence, aggregated to data that have been obtained from other sources (such as surveys or log data).
One difference between CA and TA data is that CA data is event driven data while TA data is time driven data. Event driven data means that the data is obtained during an event, which happens in a point of time. Time driven data are obtained through the time, their values could change with time and their metrics needs to include the time interval in the definition of the measurement units to make sense. It means that for making TA and CA normalized values comparable and operable the interval of time considering the TA data must correspond to the time interval (ti, ti+1) between the before and the after evaluation.
After normalizing the data, we have to deal with the issue of having a huge quantity of measurements (answer to questions, data from logs, etc.) which must be mapped to the project objectives in order to determine their achievement. Moreover, as we previously introduced, we consider F4W objectives 1-3 are composed of the impact dimensions (ID). In consequence, we need to first map the measurements to ID and then ID to project objectives.
Similarly, as the frameworks tools are thought to measure specific issues of the IDs, their measurements results are going to differently contribute to the measurements of the IDs. Additionally, a final fact to be considered is that the maturity of the artefacts under evaluation is going to determine if some tools can be used or not. In con-sequence, the transformation method also has to consider it. In other words, we need to be able to transform normalized data into ID measurements and then into objective achievement measurements being able to consider different level of contributions from the raw data to the IDs measurements and from ID measurements to objective measurements.
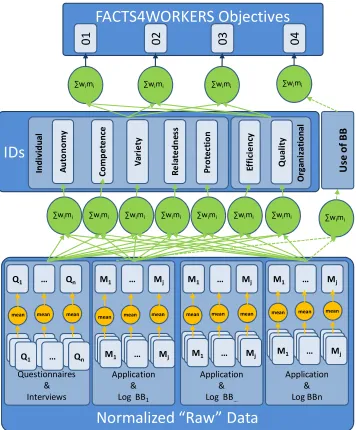
Figure 2 summarizes what we expose in previous paragraph. For simplicity, it does not include all the connections between the ID and the objectives or between the measures and the ID. It can be observed that the method that we use for measuring the objectives achievements is going to create a kind of trees relationships, of hierarchical relations, between the objectives and the raw data measurements. In each of these trees, one per objective, the root is the objective, intermediate nodes are the ID and leaves are the individual measurements.
Figure 2. Detailed Raw Data-Objectives Measurement Formulation.
2.2. F4W Evaluation strategy
The framework and the strategy (see Figure 3) for using it was tested last year (2017) when first prototypes of the solutions were deployed [10]. An example of using the results is presented in [20]. This paper uses the results of the evaluation performed at an industrial partner and shows how they are used for determining the achievement of the industrial challenge, which is exposed in [2].
From a more general point of view, that is not restricted to F4W scope, the final goal of our evaluations is to support the adoption of informed decisions about the next step of a project. After evaluating an intervention, considering the impact achievements, the room for improvement and the cost of changing the solution the next step can be determined. So the F4W Evaluation Framework supports the decision either to stop or continue the project and, in this case, the definition of features to be implemented in order to improve the software prototype.
Normalized “Raw” Data
IDs
FACTS4WORKERS Objectives
In di vi du al01
02
03
04
Au to no m y Co m pe te nc e Va ri et y Re la te dn es s Pr ot ec tio n O rg an iz at io na l Ef fic ie nc y Q ua lit y Questionnaires & Interviews
Q1 … Qn
Application &
Log BB1
M1 … Mj
U
se
o
f B
B
∑wimi
∑wimi ∑wimi ∑wimi ∑wimi
Application &
Log BB…
Application & Log BBn
∑wimi ∑wimi ∑wimi ∑wimi ∑wimi ∑wimi ∑wimi
QQ1 … Qn
1 … Qn MM11 …… MMjj
MM1 … Mj
1 … Mj
M1 … Mj
MM1 … Mj
1 … Mj
M1 … Mj
mean
Q1 … Qn M1 … Mj M1 … Mj M1 … Mj
The strategy we follow for performing longitudinal evaluations of project developments takes the F4W objectives definition as a starting point. The use cases2 are defined in [21, 22] based on the identification of the industrial partner context of use and on the description of the as-is and the should-be scenarios. The use case definitions include a high level requirements definition and the expected impact of their full implementation. From the high level requirements the more important software building blocks can be identified and prioritized, their main functionalities can be defined and first artifacts can be created and evaluated.
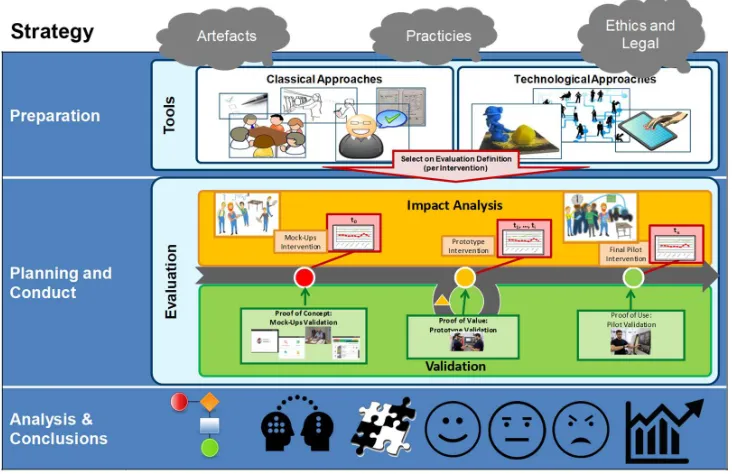
Figure 3. Overview of the F4W evaluation strategy.
The process described in the previous paragraph is the starting and also the final point of evaluation iterations: because the solution is developed under the perpetual beta philosophy and under the agile project management, each release of the software artifacts must be evaluated. Although first and last evaluation iterations are considered special; all the iterations are performed following a three phase pattern: preparation; execution; and analysis of the result and extraction of conclusions [23].
The maturity of the artifacts to be deployed and the legal frameworks will have an influence on the tools to be used for performing the evaluations. Maturity will also determine if a before-deployment intervention and after-deployment evaluation is required. Finally, the specific evaluation is going to determine how the results are interpreted.
Before-deployment evaluation is required for all the artifacts without considering their maturity. The more relevant results are these obtained from the quality validation. These results determine if the quality of the artifacts is sufficient and, in consequence, will support the decision of continuing with the deployment or stopping the next steps. I.e. for mockups as they provide proof of concept negative results could mean project cancellation. The impact analysis, which takes place before the intervention provides a base line to be used as a reference after the solution is deployed and used for a time. Additionally, when the impact analysis is performed during the initial development iterations it provides valuable feedback about the right understanding of the evaluation purpose and the used tools by the workers.
2 Use cases of the F4W project represent the field of application of all industry partners for the smart factory
As artifacts mature the after-deployment evaluations increase their value and are required for created prototypes. These prototypes provide real functionalities and their usage is going to support the workers with their daily work. This has an effect on their working practices, which makes impact measurement relevant. The impact is measured by comparing after-deployment results with before-deployment evaluation. While this comparison could also be made to a project baseline, we recommend performing it to the before-intervention as it will be more isolated from being influenced by external factors (even in the case their bias can be detected using a control group of workers).
Although the results obtained by quality validation are less relevant than the impact analysis ones for mature artifacts, they still provide high value for supporting the decision of next steps of a project. These results will suggest changes for improvements of the deployed artifacts, new use of the artifacts, new artifacts or changes in work practices. Changes in deployed artifacts, new functionalities and new artifacts can be quoted and also considering the current impact, it can be decided what to do next in the project.
2.2. Heuristics for exploring socio-technical systems
A different approach for analyzing systems is the usage of heuristics. While heuristic approaches do not claim to produce perfect “100% solutions”, they offer a pragmatic way to identify the most urgent problems sufficiently with a reasonable amount of effort. The most prominent example for this kind of employing of heuristics is provided by Nielsen’s usability inspection method for evaluating interactive systems [24], Industry 4.0 scenarios go beyond interactive systems. They feature interdependencies between actors of multiple roles and technology that is characterized by cyber-physical components, autonomy, real-time capabilities and decentralization. The combination of a networked technical infrastructure and complex interactions between people in various roles constitutes a typical socio-technical setting [25]. It is characterized by intertwining technical components with organizational measures for communication, collaboration and coordination. Socio-technical systems can only incompletely be described and documented [26] and are a subject of continuous evolution [27].
To evaluate socio-technical systems, the project “Heuristics for the Industry 4.0” has developed a set of heuristics that originate from five different domains: socio-technical design procedures, job re-design, privacy, computer supported cooperative work, human-computer interaction, and process redesign [27]. Based on literature research in these domains over 170 design recommendations were identified. A group of five experts discussed and clustered these recommendations in three iterations. The resulting clusters were the starting points to formulate an initial set of heuristics that was presented in [28]. To validate and refine this initial set of heuristics a problem database was built. It contains over 370 problems from 17 real world use cases (status in October 2018) that occurred during the implementation and operation of sociotechnical systems, like smart factory solutions.
We suggest that Industry 4.0 systems are an appropriate domain for such a heuristic-based analysis. The refined set consists of the following eight heuristics3:
#1 Visibility and feedback about task handling success. Focused information is continuously offered about the progress of technical processes and – as far as permitted – about collaborative workflows. This helps to understand what further steps are possible or not and why, and how far the expectations of others are met.
#2 Flexibility for variable task handling leading to a participatory evolution of the system. One can vary manifold options of task handling and can flexibly decide about technology usage, time management, sharing of tasks etc. Consequently, on can develop a wide range of competences that support the participation in the ongoing evolution of the whole system. #3 Communication support for task handling and social interaction. By technical and spatial support for communication one can be reached – to an influenceable extent – for purposes
of task handling and coordination This support is intertwined with negotiating duties and rights of roles, including values, so that reciprocal reliability can be developed.
#4 Purpose orientated information exchange for facilitating mental work. To support task handling, information is purposefully exchanged via technical means, updated, kept available and minimized. This implies technical linking of information and the emergence of personal profiles that must be visible and a subject of privacy related self-determination. #5 Balance between effort and experienced benefit by organizational structuring of tasks. Tasks being assigned to people are pooled, and technically supported in a way so that they make sense and provide fun. They comply with individual technical, social and physical competences and support health. These measures aim on the sustainable balancing of efforts and benefits.
#6 Compatibility between requirements, development of competences and the system’s features. Technical and organizational features of the system are continuously adjusted to each other. Within clarified limits, they meet the requirements from outside in a way that is based on the development of competencies and proactive help for dealing with varying challenges.
#7 Efficient organization of task handling for holistic goals. By appropriate sequencing, tailoring and distribution of tasks – between humans and technology – seamless collaboration is supported. Unnecessary steps or waste of resources are avoided. Increase of efficiency can be realized if needed.
#8 Supportive technology and resources for productive and flawless work. Technology and further resources support work and collaboration by taking the intertwining of criteria into account such as technology acceptance, usability and accessibility for different users, avoiding consequences of mistakes and misuse, security, and constant updating.
Each of the eight heuristics addresses a significant aspect of socio-technical system design. It is to be noted that fulfilling the heuristics is not trivially, because a system’s design decisions may have contrary effects regarding different heuristics. For example an assistance system at a manufacturing workplace that is very strict and gives a strong guidance to the worker, provides good support in regard to heuristic 8 (Supportive technology and prevention of errors), but decreases the worker’s flexibility (heuristic 2). When using the heuristics, it is the goal to find balanced solutions that are suitable for the situation at hand. Considering the heuristics in system design decreases the probability of the occurrence of severe system flaws. The heuristics can be applied either to observations made in concrete industrial plants, to models of Industry 4.0 solutions, to interviews that are run with experts who know the solution, or to a combination of these possibilities.
3. Smart factory workplace solution
In F4W project, four smart factory industrial challenges prevail in order to demonstrate and evaluate applications of assistive technologies that are developed by perpetual beta principle. The industrial challenge presented in this paper serves requirements for several contexts-of-use of the industrial partners.
3.1. Industrial Challenge self-learning manufacturing workplaces
By implementing advanced IT solutions, IoT technologies and knowledge management procedures serve many possibilities for making the production more successful. A concrete advantage is the creation of self-learning manufacturing workplaces. With the utilization of manufacturing operation data, companies are able to e.g. predictive maintenance and machine assisted decision making for calibrations that allow the reduction of process based or setup-based disruptions in order to maintain a smooth workflow. Hidria, an automotive supplier, takes over the role of a forerunner in this industrial challenge where disparate data sources are linked to realize novel decision supporting tools to enable continuous optimization of the manufacturing process [30].
3.2. Case vignette Hidria
Hidria is a Slovenian supplier to the automotive industry to which the company delivers critical components. The production and assembly lines are characterized by a fast production rate and consist of many complex operations. Difficult machine setup and many complex fault conditions lead to lengthy solution findings, which are very dependent on the experience of the workers. The information is scattered and difficult to access and maintenance is only event-driven. The F4W project aims to improve knowledge management regarding problem solving and problem prevention. Workers will have fast access to relevant information and more effective collaboration with peers to have a shared approach to arising problems. This should enable them to carry out more maintenance work themselves and prevent machine stops. The production data will be used to analyse and predict upcoming fault conditions in order to prevent them.
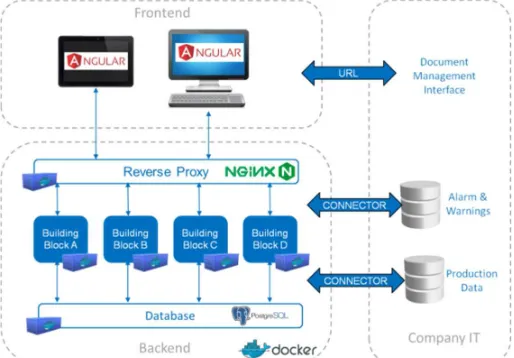
Figure 4. Software Architecture of the F4W solution at Hidria.
3.3. Technological approach
The F4W solution provides a wide range of functionalities supporting workers in different processes on the shop floor, therefore different technologies, frameworks and programming languages are used within the project. The whole software architecture shown in Figure 4 is built with the application build and deployment tool Docker, which allows splitting of the whole system in smaller building blocks. This approach allows the development of each of the building blocks separately and facilitates the reuse and the integration of externally developed building blocks.
implemented with PostgreSQL, and will be accessible to all the backend building blocks. The company’s document management is linked with the F4W solution by a URL.
3.4 The F4W solution at Hidria
Using a tablet directly at the workplace, workers at Hidria can log into the F4W solution. Depending on which role the worker has (line operator, worker, leader, and maintenance staff), the system gives him optimized access to the following functions.
3.4.1. Maintenance Scheduling
The maintenance leader defines the periodic tasks that must be carried out by the operator to support a preventive maintenance plan. The building block Job Scheduler manages the scheduled events that are stored on the F4W database and can be submitted to workers based on a predefined list. Operations and instructions are available on the tablet of the worker. Figure 5 shows the screen for creating new maintenance tasks.
Figure 5. New Maintenance Task Creation Screen-shot.
3.4.2. Defects and Solutions
For each alarm, warning and maintenance action the worker can access a database of possible actions (solutions) to cope with the current issue. The Defects and Solutions building block creates a relation between a defect and an already tested solution. It is possible to access all the tested solutions for a specific defect, add new defects and solutions and create a report. The actions will be explained using peer-to-peer comments, videos, photos and audio tracks. These file uploads are handled by an own Multimedia Management building block. The general approach is to share workers’ knowledge for an easier and faster problem solving. The user generated content can be rated by the other peers with the Content Rating building block. This helps to increase the quality of provided material and to prioritize the search results.
3.4.3. Digital data visualization
Figure 6. Machine Selection Screen-shot.
3.4.4. Trend analysis
The digital data collected by the machine (measurements, production rate, etc.) will be analyzed and graphically represented. The building block Control Charts enables the workers to define specific trend analysis of production data. Figure 7 shows an example of the data visualization screen. Data source and metrics can be easily defined by every worker himself. With his own analysis template, he can analyse production data in real time and therefore support the decision-making process.
Figure 7. Machine Data Visualization Screen-shot.
4. Results and discussion
The system was tested by the technologist of the line that is a sort of shift leader and the two shift workers. For testing the solution, a convertible (add-on keyboard) was selected by Hidria.
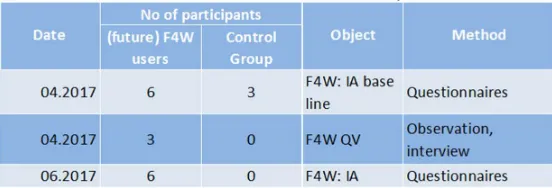
The evaluation executed at Hidria considered the prototypes implementing the solution of a use case covering two scenarios “Automated fault prediction and guided checking procedures”, and “Shared documents and integrated human-machine information” [16]. To allow a maximal flexibility for the workers, the software is deployed locally and made available by tablets. This way the workers can record the information at any place and time. The intervention was carried out in April and June 2017 and comprised two rounds of data collection.
4.1. Evaluation results based on the F4W evaluation framework
case, the impact analysis assessment was performed in order to validate the approach and to find possible improvements.
Table 1 summarizes the evaluation execution: when it was performed, the tools selected and the object of each evaluation process.
Table 1. HID evaluations summary.
The evaluation procedure was set up as followed (both at t0 and t1). At t0, before the pilot test started the solution was briefly presented to workers. Afterwards they were supposed to use a PC and started to work autonomously on the tablet. The process has been really smooth and workers immediately understood the functionality of the tool. After 5 minutes testing without any questions from their side, they highlighted possible improvements, new functionalities, as well as requesting the replication of the solution for other production lines. As expected, because of the maturity of the evaluated artifact, more relevant results correspond to quality validation. Next are the more relevant findings: the application needs some solutions inside the database to be used by the operators, they will be created by the technologist before releasing the application to operators; Operators suggested including also the timestamp to the solutions used; Readability of the solution is correct, it is easy to access and the used icon is appreciated; The feature to create a new solution has been accessed easily. The tablet is OK for creating a single solution on the spot but they asked us to use the application on a PC for a massive data input (many solutions to be included to populate the database); the keyboard of tablet has been appreciated by the operators; the assignment (just click on a button…) of tasks has been done by the operators without any issues.
They suggest that some events would be assigned automatically by the system to the maintenance leader; a table to select the initial assignment of each event to a different role will be released (2nd product release).
Figure 8. Assesment of Impact Dimenson at t0.
Figure 9. FACTS4WORKERS project goals measurement at t0.
Figure 8 and Figure 9 show the impact measurements and the achievement of projects goals at t0. They show measurements within the CG are lightly better than for the group of workers using the solution. As we previously explained because the maturity of the artifact, these measurement are expected not be significant but they can be used as a baseline for comparison in next deployments. The second roll out of the prototype was performed in June of 2018. The validated prototype corrected detected bugs and implemented most important workers solutions. Moreover, most already known solutions were added to the supporting database. As no relevant bugs were found, the rollout was developed in two productions lines (and it is expected to extend to the other two lines in brief).
0,00 0,10 0,20 0,30 0,40 0,50 0,60 0,70 0,80 0,90 1,00
Job Satisfacton Innovation & Problem S.
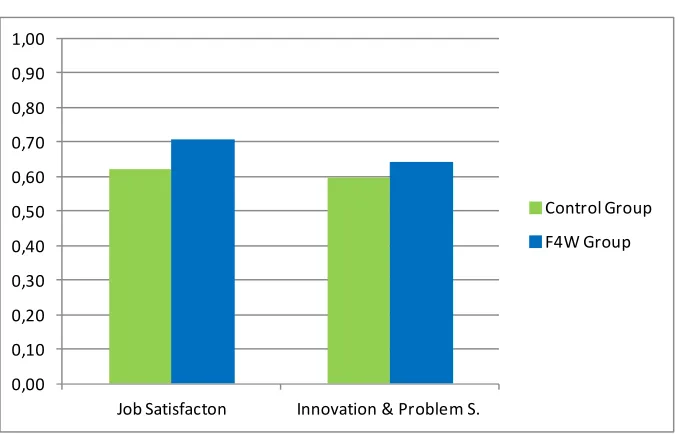
Figure 10. Impact Assesment at t1.
Figure 11. Facts4wokers Goals Achievement at t1.
While measurements shows in Figure 10 and Figure 11 are compared with the ones present in previous figures the show they show that for workers using FACTS4WORKERS solutions Job Satisfaction improve a bit while Problem Solving & Innovation Skills remain equal. They can see not good results. However when compared with the measurements of CG, results can be better interpreted: Job Satisfaction and Problem Solving & Innovation Skills of CG decreased while they improve for the workers using the solutions.
0,00 0,10 0,20 0,30 0,40 0,50 0,60 0,70 0,80 0,90 1,00
Control Group F4W Group
0,00 0,10 0,20 0,30 0,40 0,50 0,60 0,70 0,80 0,90 1,00
Job Satisfacton Innovation & Problem S.
Figure 12. Overall Comparison of Impact Assessment and Goal Achievements between CG & F4W.
Even though the t0 assessments favored the control group, a composite analysis of t0 and t1, indicate that the F4W group fared better when compared to the control group across all the measured categories as shown in Figure 12. The maturity of the artefacts at t1 seem to have positively influenced the F4W group to such an extent that the overall results across the evaluation phase favor the F4W group. A visual analysis of the bar graph indicates the possibility of a significant difference in terms of competence, relatedness, protection and satisfaction constructs between the two evaluation groups.
4.2. Analyzing the Hidria use case with the help of heuristics
Figure 13. Heuristic items for analyzing socio-technical systems
The interview showed that the heuristics help:
to deepen the comprehension of the system and to find out about the features that are being offered to its users,
to understand why the system designers added certain features while others were left out,
to identify blind spots of the system design that demand further clarification or give hints for improvement.
In summary, the interview confirmed the background of the management’s decision to roll out the proposed solution on a larger scale: the system seems well-designed as it covers most of the critical aspects of socio-technical system design in a proactive elaborated manner.
The following paragraphs describe some of the interview’s insights. We add a 2-tuple to every finding where the first position refers to the corresponding heuristic and the second position indicates whether the system offers sufficient support (+), shows a deficit (-) or further clarification is needed (?). E.g. (2,-) means that there is a flaw in regard to heuristic #2 ‘flexibility’.
Knowledge management is per se a central contribution to the proper exchange of information (4,+). It requires extra effort for documentation. This additional workload was minimized by making capturing as easy as possible (7,+) with the help of mobile devices that can record videos (8,+); 250 newly entered solutions indicate a successful design choice. Documenting solutions immediately on the shop floor was identified as the ideal task workflow (7,+) and is enabled by the system (8,+), but not enforced (2,+). After a roll out in the large it should be evaluated whether the workforce in general is motivated to contribute to documentation (5,?).
A major challenge is to offer the appropriate solutions or warnings for the situation the worker has to deal with. It still has to be evaluated how appropriate these solutions / warnings are (6,?)(8,?) and whether the workers perceive a relevant benefit, e.g. by reducing the stress of complex maintenance work (5,?). Features for letting the workers rate the quality and appropriateness of the proposed solutions allows them to be in control (2,+), makes the quality of these proposals comprehensible for others (1,+), potentially eliminates bad solutions (8,+) and potentially fosters continuous improvement (2,+).
Figure 14. Exploring a system design with the help of heuristics
No aggregated data is provided to allow the management to evaluate the workers performance; consequently, privacy is maintained (4,+). However, the workers can identify the authors of the documented solutions (1,+), e.g. to contact them if questions arise (3,+). It is unclear though, if the system offers a direct communication channel with the authors (3,?). The possibility that some workers may be too timid to record a video, which could be bypassed by allowing anonymous postings was not taken into consideration (2,-).
Connecting the knowledge management system with other technological components such as additional channels for human-human communication (3,-) or the automated provision of the resources (tools, replacement parts) that are needed to work on a problem (7,-) are open tasks (8,-).
The whole knowledge management system offers fluent transitions between working and learning on the job; editing or authorizing solutions is an opportunity for reflection (6,+).
Besides the elaborated design, the high acceptance of the tested system was probably increased by a young workforce that has an affinity towards new technologies. Additionally, a successful information campaign of the management framed the goal of the system as “making work more exciting” instead of emphasizing “increasing efficiency”. This framing avoided fear of losing jobs because of technological advancements.
Figure 4 describes the forging of potential evaluation results. If the socio-technical system takes a heuristic into account (left branch), the investigation can try to check whether the details and features of these heuristic are addressed by the system. If not (right branch) it has to be checked whether this is intentionally the case or not. If the heuristic, such as “Visibility” in Fig. 14, is intentionally neglected, the reasons for this omission can be elicited.
If the heuristic was unintentionally ignored, it can be checked whether measures for improvement should take place or which reasons stand against such an improvement.
5. Conclusions
In this paper we present two different approaches to assess and evaluate novel ICT solutions in a shop floor environment. Within the FACTS4WORKERS project we have performed an experimental study. Therefore an evaluation framework has been developed to measure on the one hand the impact of smart factory solutions on workers and organizations (change in practices and ICT solutions). On the other hand it has been developed to gather qualitative feedback from workers for continuous improvements of the workplace solutions. It is a tool in order to support decisions at all stages of the software development which follows a bottom up approach. In contrast to this framework we have also performed a theoretical study that aims to offer a pragmatic way to identify the most urgent problems sufficiently with a reasonable amount of effort. This was realized with the help of heuristics – a top down approach - which help to get a more detailed understanding of critical aspects of the developed socio-technical systems. Using the heuristics to structure an interview helped the process of creating a diverse understanding of the system (for persons that do not know the system) and pointed the creators of the system towards aspects they potentially overlooked when designing it.
While comparing both approaches, the first issue to be highlighted is that even considering different starting points, a relation between the concepts they focus on can easily be established. Also the impact dimension “relatedness” considered by the evaluation framework can be linked to the G and I heuristics proposed by hi4 (see Fig. 3). Both methodologies consider the dimension autonomy.
Moreover a parallelism between the way hi4 heuristics are clustered and the way the evaluation framework groups its tools can also be established. The first cluster can be linked to the frameworks set of tools for validating the quality of the system, while the other three clusters are linked to the individual impact dimensions of the impact analysis tools. However, the evaluation framework also considers the organizational impact dimensions – efficiency and quality - which can be considered similar to heuristics K and M, are not clustered together by hi4.
Out of the F4W project we applied these two methods to one specific context-of-use which is addressed by requirements regarding the industrial challenge “Self-learning manufacturing workplaces”. Therefore several software building blocks have been deployed which interact with each other. For this industrial challenge also other industry partners are reusing software building blocks to meet their particular requirements.
Acknowledgments: This study is part of the work in progress of FACTS4WORKERS and Heuristic for Industry 4.0 projects. FACTS4WORKERS is funded by the European Union's Horizon 2020 research and innovation program under Grant Agreement n° 636778. The study is also partially funded by the COMET K2 – Competence Centers for Excellent Technologies Programme of the Federal Ministry for Transport, Innovation and Technology (bmvit), the Federal Ministry for Digital, Business and Enterprise (bmdw), the Austrian Research Promotion Agency (FFG), the Province of Styria and the Styrian Business Promotion Agency (SFG). Heuristics for Industry 4.0 is funded by MKW NRW, supported by FGW. We thank Isa Jahnke and Alexander Nolte for the co-development of the heuristics. We would also like to thank all the companies for good cooperation. Please visit http://heuristics.iaw.rub.de for more information about the heuristics or contact [email protected] for access to the sociotechnical problem database.
Author Contributions: The team of FACTS4WORKERS (Francisco José Lacueva-Pérez, Lea Hannola, Stelios Damalas, Soumyajit Chatterjee and Marlene Schafler) provided the F4W evaluation sections. The team of Heuristic for Industry 4.0 project (Jan Nierhoff and Thomas Herrmann) provided the content of heuristics. The introduction and conclusions were made together.
References
1. Campatelli, G., Richter, A. and Stocker, A. 2016. Participative Knowledge Management to Empower Manufacturing Workers. International Journal of Knowledge Management. 12: 37-50.
2. Hannola, L., Heinrich, P., Richter, A. and Stocker, A. 2016. “Sociotechnical challenges in knowledge-intensive production environments”. XXVII ISPIM Innovation Conference. Porto, Portugal. 3. Kagermann, H. 2015. “Change Through Digitalization – Value Creation in the Age of Industry 4.0”. In
Albach, H. et al. (Eds.), Management of Permanent Change, Wiesbaden: Springer Fachmedien. 23-45.
4. Büttner, S., Mucha, H., Funk, M., Kosch, T., Aehnelt, M., Robert, S., Röcker, C. 2017. The Design Space of Augmented and Virtual Reality Applications for Assistive Environments in Manufacturing: A Visual Approach, PETRA ’17, June 21-23, 2017, Island of Rhodes, Greece.
5. Haslgrübler, M., Fritz, P., Gollan, B., Ferscha, A. 2017. Getting Through – Modality Selection in a Multi-Sensor-Actuator Industrial IoT Environment, IoT 2017, October 22–25, 2017, Linz, Austria.
6. Funk, M., Kosch, T., Schmidt, A. 2016. Interactive Worker Assistance:
7. Comparing the Effects of In-Situ Projection, Head-Mounted Displays, Tablet, and Paper Instructions, UbiComp ’16, September 12-16, 2016, Heidelberg, Germany.
8. Kritzler, M., Murr, M., Michahelles, F. 2016. RemoteBob - Support of On-site Workers via a Telepresence Remote Expert System, IoT 2016, November 07-09, 2016, Stuttgart, Germany.
9. van Saane, N., Sluiter, J., Verbeek, J., Frings-Dresen, M., 2002, Reliability and validity of instruments measuring job satisfaction - a systematic review. Occupational medicine, 53 (3), 191-200.
10. Hannola, L., Lacueva-Pérez, F. J., Steinhueser, M., Kokkonen, K., Ojanen, V., & Schafler, M. (2017). An evaluation framework for worker-centric solutions in production environments. DEStech Transactions on Engineering and Technology Research, (icpr).
11. Spector, P. E., 1985, Measurement of Human Service Staff Satisfaction: Development of the JS Survey. American Journal of Community Psychology, 13 (6), 693-713.
12. Fishbein, M. and Ajzen, I., 1975. Belief, attitude, intention and behavior: An introduction to theory and research. Reading Addison-Wesley, MA.
13. Venkatesh, V., Morris, M.G., Davis, G.B., Davis, F.D., 2003. User Acceptance of Information Technology: Toward a Unified View, MIS Quarterly, Vol. 27 No. 3, pp. 425-478/September 2003.
14. Gable, G. G., Sedera, D., & Chan, T. (2008). Re-conceptualizing information system success: The IS-impact measurement model. Journal of the association for information systems, 9(7), 18.
15. Basili, Victor; Gianluigi Caldiera; H. Dieter Rombach (1994). The Goal Question Metric Ap-proach (PDF). 16. Chen, M, Mao, S., Liu, Y., Big data: a survey, Mob. Netw. Appl. 19 (2) (2014) 1–39.
17. Stone, A. A., Bachrach, C. A., Jobe, J. B., Kurtzman, H. S., & Cain, V. S. (Eds.). (1999). The science of self-report: Implications for research and practice. Psychology Press.
18. Mayring, P. (2000). Qualitative content analysis. Forum: Qualitative Social Research, 2, 1–28. Retrieved March, 31, 2001, from http://www.qualitative-research.net/fqs-texte/2-00/2-00mayring-e.htm.
19. Walsham, G. (2006). Doing Interpretive Research. European journal of information systems, 15(3), 320-330. 20. Delone, W. H., & McLean, E. R., 2003. The DeLone and McLean model of information systems success: a
ten-year update. Journal of management information systems, 19(4), 9-30.
21. Hannola, L., Steinhüser, M, Richter A., Schafler M., Lacueva-Pérez, F.J. (2018), Assessing the Impact of Digital Interventions on the Shop Floor, 20th International Working Seminar on Production Economics, Innsbruck, Germany.
22. Heinrich, P.; Richter, A. (2015): “Captured and structured practices of workers and contexts of organizations”. Project Report - FACTS4WORKERS: Worker-Centric Workplaces in Smart Factories. 23. Denner, J.,Heinrich, P., Heldmann, C., Richter, A.:. (2015): “First version of requirements of workers and
organisations”. Project Report - FACTS4WORKERS: Worker-Centric Workplaces in Smart Factories. 24. Schafler, M., Hannola, L., Lacueva-Pérez, F. J., Milfelner, M., Steinhüser, M., & Gracia, M. A. (2017).
Evaluating worker-centered smart interventions on the shop floor. Mensch und Computer
2017-Workshopband.
25. Nielsen, J.: Heuristic Evaluation. In: Nielsen, J. and Mack, R.. L. (eds.) Usability inspection methods. pp. 25–62. Wiley (1994).
26. Baxter, G., & Sommerville, I. (2011). Socio-technical systems: From design methods to systems engineering. Interacting with computers, 23(1), 4-17.
28. Schafler, M., Lacueva-Pérez, F.J., Hannola, L., Damalas, S., Nierhoff, J. & Herrmann, T. (2018) Insights into the Introduction of Digital Interventions at the shop floor, Proceedings of the 11th Pervasive Technologies Related to Assistive Environments Conference (PETRA '18), June 26-29, Corfu, Greece.
29. Fischer, G., & Herrmann, T. (2011). Socio-technical systems: a meta-design perspective. IGI Global, 1-33. 30. Richter A.; Vodanovich S..; Steinhüser M.; Hannola L. (2017): IT on the Shop Floor - Challenges of the