Cosmic Ray Astrophysics using The High Altitude Water
Cherenkov (HAWC) Observatory in M ´exico
Eduardo de la Fuente1,a, Juan Carlos D´ıaz–V´elez2,3,b, Alberto Hern´andez Almada3,c, Alberto Nigoche–Netro1,d, and THE HAWC Collaboratione
1 Instituto de Astronom´ıa y Meteorolog´ıa, Departamento. de F´ısica, Centro Universitario de Ciencias Exactas e Ingenier´ıas (CUCEI), Universidad de Guadalajara, AV. Vallarta 2602, CP. 44130, Guadalajara, Jalisco, M´exico
2 Centro Universitario de los Valles (CUVALLES), Universidad de Guadalajara, Ameca Km. 45.5, CP. 46600, Ameca, Jalisco, M´exico, and WIPAC & Department of Physics, University of Wisconsin–Madison, Madison, WI 53706, USA
3 Instituto de F´ısica, Universidad Nacional Aut´onoma de M´exico, CU, Av. Universidad 3000, CP. 04510, Ciudad de M´exico, M´exico
Abstract. The High-Altitude Water Cherenkov (HAWC) TeV gamma–ray Observatory in M´exico is ready to search and study gamma-ray emission regions, extremely high-energy cosmic-ray sources, and to identify transient phenomena. With a better Gamma/Hadron rejection method than other similar experiments, it will play a key role in triggering multi–wavelength and multi–messenger studies of active galaxies (AGN), gamma-ray bursts (GRB), supernova remnants (SNR), pulsar wind nebulae (PWN), Galactic Plane Sources, and Cosmic Ray Anisotropies. It has an instantaneous field-of-view of∼2 str, equivalent to 15% of the whole sky and continuous operation (24 hours per day). The results obtained by HAWC–111 (111 detectors in operation) were presented on the proceedings of the International Cosmic Ray Conference 2015 and in [1]. The results obtained by HAWC–300 (full operation) are now under analysis and will be published in forthcoming papers starting in 2017 (see preliminary results on http://www.hawc-observatory.org/news/). Here we present the HAWC contributions on cosmic ray astrophysics via anisotropies studies, summarizing the HAWC detector and its upgrading by the installation of “outriggers”.
1. Introduction
When high-energy particles or photons, referred to as primaries, with E >Ec (where Ec ∼600 MeV/Z Ec is
the critical energy and Z the atomic number) enter the Earth’s atmosphere (Z=7) at an altitude of ∼30 km, an extensive air shower (EAS) is induced. EAS are produced by the interaction of primaries with atmospheric nuclei. The theory of EAS is fully described by Bhabha & Heitler (1937) [2] and the pioneer works of Carlson & Oppenheimer (1937) [3] and Zatsepin (1949) [4] as a complement.
A primary cosmic ray (usually high energy proton or iron nucleus) produces an EAS with three components:
1. The weak, soft component, or electromagnetic, produces gamma rays through neutral pion decay, 2. the hard component (muons and hadrons), where
charged and neutral kaons and pions decay into gamma rays, muons, neutrinos, antineutrinos, and nuclear fragments like protons and neutrons. For example, approximately 20% of 1 GeV muons produced at 10 km will reach sea level before decay, and
ae-mail:edfuente@astro.iam.udg.mx be-mail:juan.diazvelez@alumnos.udg.mx ce-mail:albertby@hotmail.com
de-mail:anigoche@gmail.com
ehttp://www.hawc-observatory.org/
3. a nucleonic component, where high-energy nucle-ons, disintegration-product nuclenucle-ons, and nuclear disintegration are present.
On the other hand, if a gamma ray primary hits a nucleus in the Earth’s atmosphere, an electron-positron pair is produced by Coulomb interaction. These electrically charged particles, interact with other atmospheric nucleus producing secondary gamma rays via bremsstrahlung radiation (e±+N−→e±+N+γ). The length scale for the energy loss of e−and photons when they interact with matter (in gr cm−2) is known as the radiation length. When the e± from the primary produce a secondary gamma via bremsstrahlung, we obtain one radiation length. When this secondary gamma pair-produce another e±, and the resulting e± gives way to other secondary gammas via bremsstrahlung a second radiation length is obtained, and so on. The radiation length, X0, is the distance over which a high energy electron decreases its energy through bremsstrahlung to 1/e. The average distance that a high energy photon travels before converting to an electron pair is ∼ 97 X0, where X0∼ 180ZA2 ∼ 36.6
g
cm2, and A is the atomic mass.
When a charged particle (e− or muons) from secondaries interacts with a polarized medium (e.g., air or water), it can produce “Vavilov–Cherenkov” radiation as a result of the particle travelling faster than light in the medium [5–8]. While IACT’s are excellent telescopes for high resolution observations, Water Cerenkov Detectrs
(WCD) are excellent as monitoring instruments for transients, AGNs, and large scale structures.
2. The HAWC detector
2.1. The main detectorThe High-Altitude Water Cherenkov (HAWC) Observa-tory is a unique water Cherenkov detector, studying the Universe through gamma rays in an energy range from 100 GeV to 100 TeV. HAWC was constructed on Sierra Negra, Puebla, M´exico, at 4100 meters above sea level. At this elevation,∼10% of the energy from a 1 TeV gamma– ray shower will reach the detector level, which is about 5×the energy at the Milagro elevation (2600 m) and more than 25×the energy that reaches sea level.
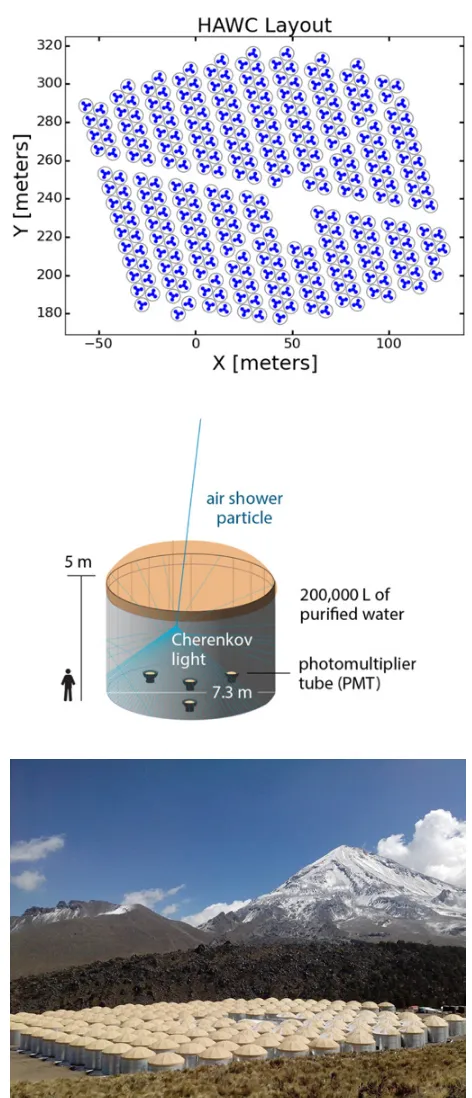
HAWC consists of 300 water Cherenkov detectors, each made of a corrugated metallic cylindrical structure, of 7.3 m diameter and 4.5 m high, bracing a bladder with 180,000 liters of ultra clean water and 4 photo-multiplier tubes (PMT) in its interior that work as sensors of the Cherenkov radiation produced by charged particles from extended air showers; in the center of the detector is a high quantum efficiency 10 Hamamatsu R7081-HQE PMT, surrounded by three 8 Hamamatsu R5912 PMTs recovered from Milagro. HAWC is an ideal survey instrument with a big synergy with other observatories like AUGER1, IceCube2, and Air Cherenkov Detectors like Veritas 3, HESS4, and Magic5. The main parameters are presented in Table 1. Figure 1 shows the layout of the full HAWC WCD (top), the diagram of a single WCD (middle), and a true picture of the detector as it is now (bottom).
All the signals from the PMTs are recorded using Time over Threshold (ToT) as the method to determine both the arrival time and the amplitude of the signals without dead time. The analog PMT pulses are connected to shaping electronics in the counting house through a 175 m cable path. The pulses are shaped and discriminated with 2 thresholds, at 14 PE and 5 PE. Threshold crossing times are digitized using CAEN VX1190A multi-hit time-to-digital converters (TDC). All multi-hits are recorded to memory and triggering is entirely done using software. The total data collection rate is ∼400 MB/s and drops to 15—20 MB/s with the application of a trigger. Events are reconstructed in real–time (few second latency) using an online analysis computing farm so that HAWC can rapidly alert other experiments of transient sources. The shower front is first fitted with a plane followed by a fit with the curvature corrections and shower time spread given by the actual propagation of particles in the atmosphere. The position of the shower core is determined by fitting a Nishimura-Kamata-Greisen (NKG) distribution [9,10] to the amplitude of the detected signals. This can be reliably done if the core falls inside the array (22,000 m2effective area) but becomes more ambiguous if the core falls outside of the array [11].
HAWC began full operation at the end of March 2015, and is expected to be ∼15 times more sensitive
1https://www.auger.org/ 2https://icecube.wisc.edu/ 3http://veritas.sao.arizona.edu/ 4https://www.mpi-hd.mpg.de/hfm/HESS/ 5https://magic.mppmu.mpg.de/
Figure 1. Layout of the HAWC array (top), a diagram of a single HAWC tank (middle), a real picture of the full HAWC observatory.
Table 1. HAWC Main Parameters.
Parameter Value
Hemisphere Northern
Latitude 19◦
Altitude 4100 m a.s.l. (630 gm/cm2) Effective Area 22,000 m2
Area of each WCD 42 m2
Field of View ∼2 str (15% of the whole sky)
Trigger rate 16 kHz
Detection method cascades produced by CR andγ Median primary energy 2 TeV
Approx. angular resolution 0.3◦−1.5◦
sensitive than Milagro. On November 26, 2014, data taking began with 250 tanks. The detector was expanded through the winter of 2014–2015 and full HAWC operations officially commenced on March 20, 2015. More details about the HAWC construction, performance and operation is presented by Smith et al. (2015) [13].
2.2. HAWC near future: The outriggers era
Although the gamma/hadron discrimination method on HAWC is working well (e.g., [11,13–15]), the method performs better as the energy of the gamma increases and at the highest energies the events are almost background free. Nevertheless, there is a large fraction of showers where the core falls outside of the HAWC array, and although they leave enough information in the WCDs to make a gamma/hadron discrimination, there is ambiguity in the core position, the direction of the shower, and the shower size. Also, the HAWC trigger for the highest energy gammas reaches an effective area of 105m2 but again, many of them are poorly reconstructed because the shower core falls outside the array.
To recover a large fraction of these showers and increase the present fraction of well reconstructed showers above 10 TeV, especially at the highest energies where we are limited by the statistics, an upgrade for the HAWC observatory is mandatory.
One way to do this is by the installation of a sparse array of small water Cherenkov detectors around HAWC– 300. These “outriggers” (OR’s) can help pinpoint the core position and thus improve the angular resolution of reconstructed showers. This same approach was utilized by the Milagro observatory. In 2004, a sparse outrigger array to Milagro was added and this dramatically increased the sensitivity of the observatory by being able to determine the shower core position over an area much bigger than the main detector and thereby correctly reconstructing partially detected showers.
As a result of these considerations, an effort was started to install outriggers around HAWC in 2016. The goal of this is to:
1. enhance sensitivity above 10 TeV, accurately deter-mine core position for showers off the main WCD array (HAWC 300),
2. increase effective area above 10 TeV by 3–4 times, and
3. determine the position of the shower core for showers falling outside the HAWC WCD array and that still leave enough information in HAWC to reconstruct the shower front and discriminate
between gamma and cosmic-ray initiated showers. This improvement is naturally limited only to high energy showers above 1 TeV.
The HAWC outrigger array consists of 350 cylindrical tanks of diameter 1.55 m and height 1.65 m, 1/80th size of one HAWC WCD (see Fig.2top). Each tank with 2500 liters of ultra-purified water, will include one Hamamatsu R5912 8 PMT at the bottom of the tank. The outrigger array will be deployed in a circular symmetric way around the main HAWC array with an inter-tank separation of 12 m to 18 m (see Fig. 2 down). To optimize the layout, detailed simulations are being performed using the Monte Carlo method. The FlashCAM readout electronics (see [16] and references therein) is used for trigger and readout of the system. Preliminary results are presented in [16] and [11]. Details and final results will be presented in a forthcoming paper.
3. HAWC cosmic ray
astrophysics results
3.1. Anisotropy in the arrival direction distribution of TeV cosmic rays
A number of experiments have observed an anisotropy with an amplitude of 10−4 at energies of order 1 TeV including the Tibet ASγ [17], Super-Kamiokande [18], Milagro [19], EAS-TOP [20], MINOS [21], ARGO-YBJ [22] experiments in the Northern Hemisphere, and IceCube [23–25] and its surface air shower array IceTop [26] in the Southern Hemisphere.
There are two significant features in the observed anisotropy. The first is a large-scale structure with an amplitude of about 10−3, and the second consists of several localized regions of cosmic-ray excesses with an amplitude of 10−4 with and deficits of angular size 10◦ to 30◦.
The origin of this anisotropy is not yet well understood since it is expected that cosmic rays should lose any correlation with their original direction due to diffusion as they traverse interstellar magnetic fields.
The anisotropy of cosmic rays is measured by computing the relative intensity as a function of equatorial coordinates (α,δ) in a sky grid of equal-area pixels using the HEALPix library. A binned data map N (α, δ)i with
a resolution of 0.2◦ per bin is used to store the arrival directions of air showers recorded by the detector for each angular bin, i .
A reference mapN (α, δ)i that gives a description
of the arrival direction distribution of an isotropic flux at Earth is produced by collecting all events recorded during a time period, t , and then integrating the local arrival direction distribution against the detector event rate. This is done using the direct integration technique described in Ref. [27].
This procedure effectively smooths out the true arrival direction distribution in right ascension on angular scales ∼t·15◦hr−1and also compensates for variations in the detector rate. We calculate the deviations from isotropy using the reference by computing the relative intensity given in Eq. (1)
δI (α, δ)i = N N =
N (α, δ)i− N(α, δ)i
N(α, δ)i
Figure 2. Top: image of the first Outrigger installed on HAWC for upgrade. Each OR is 1/80th size of a main HAWC detector. Bottom: layout showing the position of the 350 outriggers to be installed around HAWC main detector improving the effective area by a factor of 4.
which gives the amplitude of deviations from the isotropic expectation in each angular bin, i . The significance of the deviation can be calculated using the method of Li and Ma [28]. A choice oft =24 is needed to ensure a uniform angular scale as a function of declination.
The analysis originally published in [29] was carried out on HAWC-111 data using t =24 hr to obtain sensitivity to all angular features equally over the sky. The resulting large scale relative intensity is a combination of sidereal anisotropy and the Solar dipole effect which causes an excess of cosmic rays in the direction of the Earth’s motion around the Sun. However, the two signals are difficult to disentangle unless the data cover an integer number of years of exposure such that each signal makes a complete transit in the other reference frame.
Figure 3. Angular power spectra of the unsmoothed relative intensity map before (blue) and after (red) subtracting the large-scale structure (≤3). Gray error bands show the 68% and 95% spread of the Cfor isotropic data sets. Comparing the band to the data shows which ell-modes significantly contribute to the sky map. The error bars on the Care the square root of the variances returned by a fit using a power spectrum estimator (PolSpice).
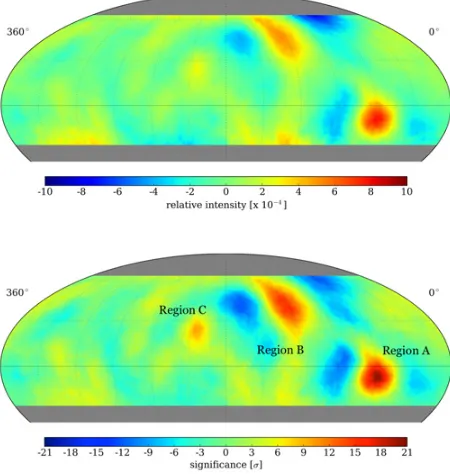
Figure 4. Relative intensity (top) and pre-trial significance (bottom) of the cosmic-ray flux after fit and subtraction of the dipole, quadrupole, and octupole terms from the map shown in above. The map is shown with 10◦smoothing applied.
Figure 3 shows the angular power spectrum of the resulting map. The large-scale signals can be subtracted from the resulting map using a multipole fit to all multipole moments≤max =3, so we are left with the small-scale structure in the sidereal frame. The residual structure will contain power at angular scales less than 180◦/max= 60◦. The resulting small-scale anisotropy map is shown in Fig.4along with the statistical significance map using the Li & Ma method. A 10◦smoothing has been applied.
Three significant features remain, the strong region of excess flux which are labeled as regions A, B and C in Fig.4. These excesses coincide with the 10◦−20◦regions of cosmic-ray excess first observed by Milagro [30] (Regions A and B) as well as a third region observed only by ARGO-YBJ [31] (Region C).
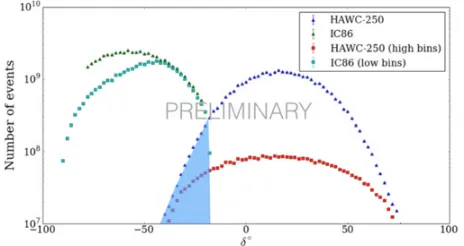
Figure 5. Distribution of events as as a function of declination for IceCube (IC) and HAWC. The shaded area corresponds to the overlapping region for both experiments [32].
in both hemispheres has been made yet. The published IceCube maps are of higher energy (20 TeV median) HAWC and other northern measurements. Unlike it’s predecessor Milagro (35.88◦ N latitude), HAWC (19.0◦N latitude) has a field of view that overlaps with that of IceCube (see Fig.5). Because of this, there is some work to combine HAWC and IceCube data using cuts to bring their median energies closer to a central value [32].
References
[1] Abeysekara, et al., The Astrophysical Journal 817, 3–13 (2016)
[2] H.J. Bhabha and W. Heitler, Proceedings of the Royal Society of London A 159, 432–458 (1937)
[3] J.F. Carlson and R. Oppenheimer, Physics Review 61, 220–231 (1937)
[4] G.T. Zatsepin, Doklady Akademii Nauk SSSR 67, 993–1001 (1949)
[5] P.A. Cerenkov, Doklady Akad. Nauk SSSR 2, 451–455 (1934)
[6] S.I. Vavilov, Doklady Akad. Nauk SSSR 2, 457–459 (1934)
[7] P.A. Cerenkov, Phys. Rev. 52 378–381 (1937) [8] Tamm, I.E., and Frank, I.M., Doklady Akad. Nauk
SSSR 14, 107–112 (1937)
[9] Kamata, K., & Nishimura, J. 1958, Progress of Theoretical Physics Supplement 6, 93–98
[10] Greisen, K. 1960, Annual Review of Nuclear and Particle Science 10, 63–68
[11] A. Sandoval et al., Proceeding of Science
ICRC2015, 1–6 (2015)
[12] Abeysekara et al., Astroparticle Physics 62, 125–133 (2015)
[13] A. Smith et al., Proceeding of Science ICRC2015, 1–8 (2015)
[14] Zigfried Hampel–Arias, & Stefan Westerhoff, Proceedings of Science ICRC2015, 1–8 (2015) [15] J. Pretz et al., Proceeding of Science ICRC2015,
1–16 (2015)
[16] V. Joshi, Proceedings of the 6th Roma International Conference on Astroparticle Physics, in press, (2017) [17] M. Amenomori et al., Astrophys. J. Lett. 626,
L29-L32 (2005)
[18] G. Guillian et al., Phys. Rev. D 75, 062003 (2007) [19] A. A. Abdo et al., Phys. Rev. Lett. 101, 221101
(2008)
[20] M. Aglietta et al., Astrophys. J. Lett. 692, L130–L133 (2009)
[21] J. De Jong, International Cosmic Ray Conference 4, 46 (2011)
[22] G. Di Sciascio, Euro. Phys. J. Web of Conf. 52, 4004 (2013)
[23] R. Abbasi et al., Astrophys. J. Lett. 718, L194–L198 (2010)
[24] R. Abbasi et al., Astrophys. J. 740, 16 (2011) [25] R. Abbasi et al., Astrophys. J. 746 33, (2012) [26] M. G. Aartsen et al., Astrophys. J. 765, 55 (2013) [27] R.W. Atkins et al., Astrophys. J. 595, 803–811 (2003) [28] T.-P. Li and Y.-Q. Ma, Astrophys. J. 272, 317–324
(1983)
[29] A. Abeysekara et al., The Astrophysical Journal 796, 108 (2014)
[30] A.A. Abdo et al.,, Astrophys. J. 698, 2121–2130 (2009)
[31] B. Bartoli et al., Phys. Rev. D88, 082001 (2013) [32] J. D´ıaz-V´elez and D. Fiorino, Proc. 34th ICRC, in