1009 | P a g e
A CASE STUDY ON ESTABLISHING LEAN
CONCEPTS THROUGH VALUE STREAM MAPPING
Kurian Elias V
1, Aravind H S
2, Dr C K Nagendra Guptha
31
Student, Masters of Engineering Management, Dept. of Industrial Engineering and Management,
R V College of Engineering, Bangalore (India)
2
Production Manager, Merck Life Science Pvt. Ltd. Peenya, Bangalore (India)
3Associate Professor and Associate Dean, Dept. of Industrial Engineering and Management, R V
College of Engineering, Bangalore (India)
ABSTRACT
Operational Excellence is becoming an important organisational factor that focuses on meeting the customer expectation. Lean manufacturing systems use several techniques to achieve efficient and effective processes, focussing on customer value and elimination of Muda in all activities. Lean practises are a tool to achieve operational excellence. Value Stream Mapping (VSM) is a tool which is used to chart the activities involved in a process and helps in identifying the time taken for each activities to complete. This paper gives an insight into how lean practises has helped in achieving operational excellence at standard production area. Through this case study the organisation was able to increase its daily production from 6 no’s to 10 no’s per day. There has been a reduction of 55% in the shop floor utilization as well as 53% reduction in the cycle time.
Keywords: Operational Excellence, Lean practises, Value Stream Mapping, Lean Manufacturing
Systems
I. INTRODUCTION
The historical backdrop of lean practices or lean assembling framework backpedals to the early years of Toyota
and the improvement of Toyota Production System (TPS). Lean administration means to actualize procedures to
accomplish great, wellbeing and specialist resolve, while diminishing expense and shortening of lead times. The
principle explanation behind this framework to be viable is its centre focus on the disposal of wastes from all
procedures. Throughout the years, lean assembling has been getting an expanding measure of consideration for
efficiency enhancements and cost decreases. It has turned into a way to dissect and enhance creation and the
factoryfloor condition. Lean offers progressive instead of transformative proficiency changes. All the diverse
exercises that are a piece of the generation procedure must be deliberately organized to expand the advantage of
lean.
In order to understand the activities involved in the processes and the time taken one must create a map which
give details about all the process involved. VSM is process that involves flowcharting the steps, activities,
materials flow and other process elements involved with a process. It helps an organisation in identifying the
non-alue added activities. A flow diagram depicting the process is drawn to show the current state of operation. The
process is analysed in order to identify any opportunity to reduce and simplify the process. After analysing
1010 | P a g e
how process looks compared to earlier. Until and unless the ideal state is attained the process is continuouslyanalysed.
The case study was carried in a manufacturing unit located in Bangalore. This unit manufactures consumables &
equipment for biotech research and production and other tools and laboratory supplies for life science industry.
This study discusses the implementation of operational excellence through lean practises. The main objective of
the research study are:
Implement single piece flow
Reduce overall lead time
Reduce overall space usage of assembly area
Reduce the non – value added (NVA) activities
II. LITERATURE SURVEY
Many noted personalities like Taiichi Ohno (1988), Robert S Kaplan & David P Norton (2000), Yang-Hua Lian
and Hendrik Van Landeghem (2002), V Ramesh, K V Sreenivasa Prasad and T R Srinivas (2008), Lixia Chen
and Bo Meng (2010), Dr Palmira Lopez-Fresna (2012) and Charles Richards (2014) have studied the concept of
operational excellence and how to achieve it through lean practises.
Taiichi Ohno (1988) couldn't see waste initially (particularly over a topographical region). The author created
Material and Information Flow Mapping (VSM) as a standard strategy for mapping the streams outwardly and it
turned into the standard reason for planning enhancements at Toyota - as a typical dialect. It wound up plainly
one of their business arranging devices. VSM is presently used all through the world, in numerous organizations
to deliberately plan and it is the beginning stage to any lean change and usage.
Yang-Hua Lian and Hendrik Van Landeghem (2002) in their paper gave an insight how simulation and VSM
helps managers see the impacts before and after implementation of processes. The research team built a
simulation model for two scenarios – push and pull Kanban systems.By changing the process sequence,
redesigning of layout and pulling production from downstream, there is a reduction in lead time, helps in
lowering the Work-in-progress (WIP) inventory, steep increase in the value-added ratios and helps in solving
the bottleneck problem
V Ramesh, K V Sreenivasa Prasad and T R Srinivas (2008) in their paper mentioned how VSM helps in Lean
Implementation in Manufacturing Industry. They gave a basic idea of how to derive the current mapping as well
as the future state mapping. They also gave insight in to how individual Kaizens can be identified and how to
eliminate them so as to achieve the future state mapping. VSM provides a clear cut insight into the Value-added
as well as the Non-value Added activities ratio. For preparation of the VSM communication with all level of the
organisation is necessary. This will help in reducing the cycle time and improve the manufacturing process.
Indian Brand Equity Foundation (2009) has brought out how the Indian manufacturers are achieving
Operational Excellence. The paper emphasise on how Indian companies are emphasising more on quality. They
have adopted the Total Quality Management (TQM) approach for better results. Manufacturing sectors are
trying to reduce the emissions level through use of alternative fuels. The use of IT solutions enhanced the
company‟s productivity. Digital Manufacturing has helped the manufactures to improve productivity and
1011 | P a g e
Dr Palmira Lopez-Fresno (2012) had recognized Critical Success Factors (CSFs) for compelling execution ofQMPs, recommended that Lean Management is a straightforward, effective and cordial procedure to accomplish
operational greatness. The paper additionally depicts an instance of execution of Lean Management in the
human services association. After execution of the contextual analysis the lesson learnt were that Lean
Management has conveyed significant execution picks up as well as conveyed some vital lesson, for example,
authority, hierarchical structure and assets, outer help, clear destinations and so forth.
Charles Richards (2014) had presented a framework to quantify Operational excellence and its Linkage to the
enterprise value. Through this he was able to show that this can act as a starting point based on which efforts can
be built on thus addressing the fundamental challenge of investing capital into privately held enterprises. He
used core value rating as reliable quantifiable measure of operational excellence.
III. METHODOLOGY
A methodology is an essential component for any project to take place. It describes the step by step activities
one need to do in order to achieve the desired result. The methodology was defined after discussing with the
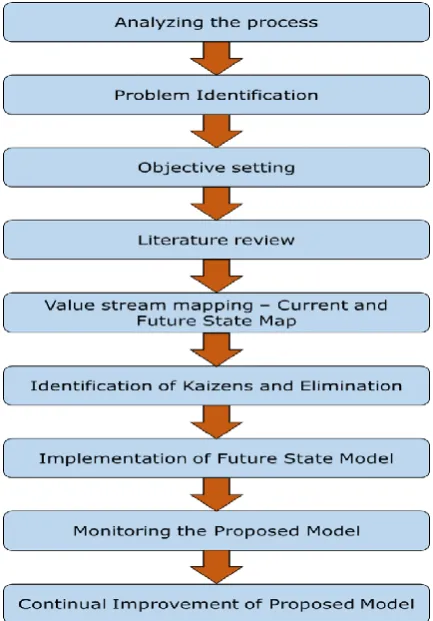
management as well as on the data that was being collected. Fig. 3.1 shows the flow chart of the methodology
used in the case study.
Fig. 3.1 Case Study Methodology Flow Chart
The steps involved in project methodology are:1. Analysing the Process: The first step is to analyse the existing process and understand the various steps
1012 | P a g e
2. Problem Identification: After analysing the process the following problems were identified: Production takes place in batch-wise
Materials were not released based on confirmed material availability
Chances of rejection at the final assembly
Sub-assembly used to get accumulated on the shop floor
Increased Lead time
Large shop floor area consumption
3. Objective Setting: In order to tackle the problem a set objectives are defined. This objectives forms the
basis for the working of the project.
4. Literature Review: Various research papers are read and based on which the project methodology is
identified and set
5. VSM – Current and Future State Map: VSM maps the current procedure and aides in the recognizable
proof of the waste and NVA. Current State Map demonstrates the current procedure, Future State Map indicates
how the future resembles.
6. Identification of Kaizens and Elimination: The bottle neck process is identified and respective Kaizens are
identified. Once all the Kaizens are identified, with the help of the stake holders the root cause analysis is done.
The outcome of the root cause analysis will be the action plans.
7. Implementation of the Future State model: Once all the Kaizens are eliminated the derived future state is
implemented in the line and the works are trained to work as per the future state.
8. Monitoring the Proposed Model: Once the future state has been implemented it is continuously monitored
so as to ensure that the proposed model has no problem.
9. Continual Improvement of Proposed Model: Lean Management means Continuous improvement, it‟s a
very essential part to achieve the ideal state. The proposed model may not be the ideal state and required
continuous improvement.
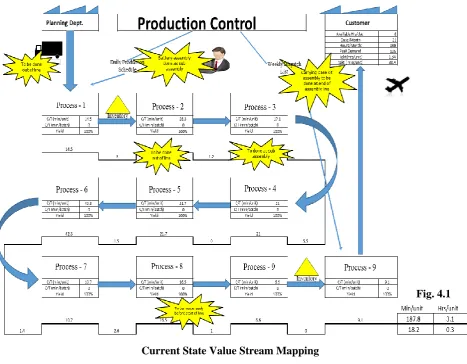
IV. CURRENT STATE VALUE STREAM MAPPING
Mapping is a powerful tool and source to identify waste in a value stream. The outcome of VSM is elimination
of large scale waste in the process. This case study deals with an assembly procedure that was facing the
problem of backlog of output for the past one month due to which the number of output to be delivered was
increasing day by day. Hence it was decide to draw a current state map of the process in order to understand the
relationship between Value Added (VA) and Non-Value Added (NVA) activities.
In order to draw the current state map following procedures was adopted:
Identification and drawing the product flow from the raw-material entry point of the manufacturing division (MFD) to the finished goods exit point of the MFD.
Calculation of the Work-in-Process (WIP)
1013 | P a g e
4.1 Data Collection:
The cycle time, setup time for the whole assembly process was calculated using a stop watch, where the whole assembly process was done by a single operator.Based on the data collected the currentstate map was drawn. Fig. 4.1 depicts the current state map for the entire assembly process.
Fig. 4.1
Current State Value Stream Mapping
4.2 Analysis of Current State Map: Once the current state map was derived, each process was analysed in
order to find out the VA and NVA activities. The total time taken to complete one1014 | P a g e
product was around 187.8 mins which is more than the takt time of 80.4 mins.Also there existed certain processwhich could have been done independently without the main assembly component. In order to finish a batch of
20 units it used to take roughly around 4 days to complete. Thus increasing the amount of WIP on the floor. Fig.
4.2 depicts the distribution of cycle time for all the process involved in the assembly.Out of 187.8 min, 142.02
min constitutes VAActivities, while the remaining 45.78 min is the NVA activities.
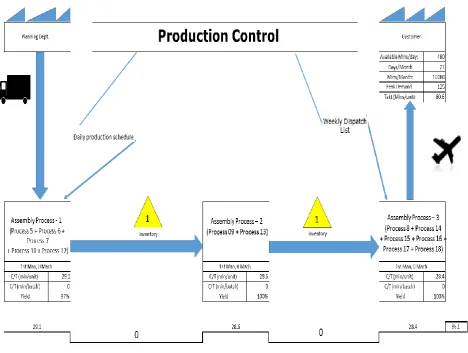
4.3 Analysis for Future State Map
: In order to derive the future state map following actions were decided upon: Development of a new layout where there was proper flow of materials.
To bring the raw material at Point-of Usage (POU)
Line balancing in order to produce the product within the takt time
Reduction of idle time and change over time
Elimination of Non – Value added activities in order to improve the cycle time.
Reduction of WIP
4.4 Proposal for Future State Map
: The aim to derive the future state map was to eliminate the waste and NVAactivities that was evident in the process. Table 1 shows the detail of Current state map, cause, effect andthe improvement measures to be undertaken for improving the Future State Map.
In order to arrive the Future state map following suggestions were proposed:
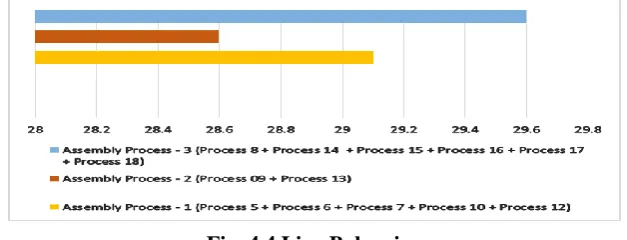
As from the Fig. 4.1 we see that the process was not balanced each had different time and the waiting time between each process was different. The first step was to balance the line so that the difference between the
processes was reduced which led to the reduction of WIP in the line. But during line balancing there were
certain process which were done before hand or prepared ready before the start of the line as these had a curing
time of 1440 mins. After balancing this how the distribution of cycle time lookslike as shown in Fig. 4.4
Fig. 4.4 Line Balancing
The layout of the assembly line should be changed in order to obtain a proper flow of material.
Raw material required for the assembly process has to be stored near to the POU on the worktable rather than on a shelf or heavy duty rack. This will reduce the worker movement.
1015 | P a g e
The workers along with the supervisor has been trained why single piece flow is essential rather than batch production through games. This enabled them to understand the benefit of Lean Practises.
Fig. 4.4 represents the future state map for the assembly process. The whole assembly process hase been divide
into three as the time taken for each process is alsmost same. This led to reduction in WIP. Also the cycle time
has been reduced by 54.1%.
Fig. 4.4 Future state map
V. CONCLUSION
Over the years Indian manufactures have started to use lean practises in order to achieve operational excellence.
Setting aside traditional practises they are more focussed on generating values. Through this case study one can
observe that the current state of the assembly process was imbalance with lots of NVA‟s present. The time study
revealed a lot of data regarding WIP, cycle time for each process, changeover time etc. By analysing the data
with the team measures have been taken to reduce the cycle time, WIP and improve the overall efficiency.
Through this the overall productivity of the line has been increase from 6 output per day to 10 output per day,
1016 | P a g e
overall floor usage has been reduce by 44%. This shows if proper lean practises are adopted then is scope forlarger improvements.
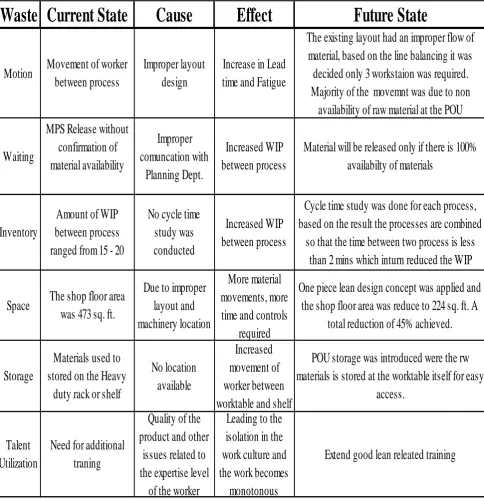
Table 1 Waste and the improvement measures for Future state
Waste Current State
Cause
Effect
Future State
Talent
Utilization
Need for additional
traning
Quality of the
product and other
issues related to
the expertise level
of the worker
Leading to the
isolation in the
work culture and
the work becomes
monotonous
Extend good lean releated training
Space
The shop floor area
was 473 sq. ft.
Due to improper
layout and
machinery location
More material
movements, more
time and controls
required
One piece lean design concept was applied and
the shop floor area was reduce to 224 sq. ft. A
total reduction of 45% achieved.
Storage
Materials used to
stored on the Heavy
duty rack or shelf
No location
available
Increased
movement of
worker between
worktable and shelf
POU storage was introduced were the rw
materials is stored at the worktable itself for easy
access.
Waiting
MPS Release without
confirmation of
material availability
Improper
comuncation with
Planning Dept.
Increased WIP
between process
Material will be released only if there is 100%
availabilty of materials
Inventory
Amount of WIP
between process
ranged from 15 - 20
No cycle time
study was
conducted
Increased WIP
between process
Cycle time study was done for each process,
based on the result the processes are combined
so that the time between two process is less
than 2 mins which inturn reduced the WIP
Motion
Movement of worker
between process
Improper layout
design
Increase in Lead
time and Fatigue
The existing layout had an improper flow of
material, based on the line balancing it was
decided only 3 workstaion was required.
Majority of the movemnt was due to non
1017 | P a g e
REFERENCES
[1.]
Dr. Palmira Lopez-Fresna: „Contribution of lean management in excellence‟, Nang Yan Business Journal – 1.1, (2), pp. 90-98, January 2012[2.]
Yang-Hua Lian and Hendrik Van Landeghem: „An application of simulation and value stream mapping in lean manufacturing‟ , 14th European Simulation Symposium, pp. 257-263, May 2002[3.]
V. Ramesh, K.V. Sreenivasa PrasadandT.R. Srinivas3: „Implementation of a lean model for carrying out Value Stream mapping in a manufacturing industry‟, Journal of Industrial and Systems Engineering, Vol. 2, No. 3, pp 180-196, August 2008[4.]
Lixia Chen and Bo Meng: „ The application of value stream mapping based lean production system‟ ,International Journal of Business and Management, Vol. 5, No. 6; pp. 331-336,June 2010
[5.]
Indian Brand Equity Foundation: „ Operational Excellence in Indian Manufacturing‟ , January 2009[6.]
Anthony, J. and Banuelas, R. (2002), “Key ingredients for the effective implementation of Six Sigma program”, Measuring Business Excellence, Vol. 6 No. 4, pp. 20-7.[7.]
Asif M., Joost de Brijin, E., Douglas, Al, Fisscher, O. (2009), “Why quality management programs fail. A strategic and operations management perspective”, International Journal of Quality & Reliability Management, Vol.26, No.8, pp.778-794.[8.]
Beyer, J.M. Ashmos, D.P. and Osborn, R.N. (1997), “Contrast in enacting TQM: mechanistic vs organic ideology and implementation”, Journal of Quality Management, Vol. 2, No. 2, pp. 3-39.[9.]
Bititci, U.S., Mendivil, K., Nudurupati, S., Garengo, P., Turner, T. (2006), “Dynamics of performance measurement and organizational culture”, International Journal of Operations & Production Management,Vol. 26 No. 12, pp. 1325-1350.
[10.]
Cagnazzo, L., Taticchi, Pl, Brun, A. (2010), “The role of performance measurement systems to support quality improvement initiatives at supply chain level”, International Journal of Productivity and Performance Management, Vol. 59 No.2, pp. 163-185.[11.]
Choi, T.Y. and Eboch, K. (1998). “The TQM paradox: relations among TQM practices, plant performance and customer satisfaction”, Journal of Operations Management, Vol. 17 No. 1, pp. 59-75.[12.]
Dahlgaard-Park, S.M., and Dahlgaard J.J. (2007), “Excellence – 25 years evolution”, Journal of Management History, Vol. 13 No. 4, ppt. 371-293.[13.]
Dean, J.W. and Snell, S.A. (1996), “The strategic use uf integrated manufacturing: an empirical examination”, Strategic Management Journal, Vol. 17 No. 6, pp. 459-80.[14.]
EFQM (1999), Self-assessment Guidelines for Companies, European Foundation for Quality of Management, Brussels.[15.]
Fernández-González, F., López-Fresno, P., (2002) “Leading with complexity in healthcare”. Proceedings of the International Conference on ISO 9000 and TQM. Hong Kong Baptist University & RMIT.[16.]
Garvin, D.A. (1986), “Quality problems, policies and attitudes in the United States and Japan: an exploratory study”, Academy of Management Journal, Vol. 29 No. 4, pp. 653-73.1018 | P a g e
[18.]
Kwak, Y.H. and Anbari, F.T. (2006), “Benefits, obstacles, and future of Six Sigma approach”, Tec novation, Vol. 6, pp. 708-15.[19.]
López-Fresno, P., Estrada-Rubio, F., Fernández-González, F. (1999) “Is Top Management Commitment Enough? A Case Experience in an Airline Company” Proceedings of 12th Annual Management Conference, American Association for Quality.[20.]
López-Fresno, P., Fernández-González, F. (2002) “Integrated Management in a Turbulent Environment”Proceedings of 7th International Conference on ISO 9000 and TQM, Hong Kong Baptist University & RMIT.