Survey on Automatic Detection of Glaucoma
based on Eye Images
Rakhi Ramachandran Nair#1, Chippy Jacob#2, Tessy Vincent#3, Remyamol.R#4
PG Scholar, Dept. of Computer Science & Engineering, College of Engineering, Kidangoor, Kottayam, India#1,2,3
Assistant Professor, Dept. of Information Technology, College of Engineering, Kidangoor, Kottayam, India#4
ABSTRACT: Glaucoma is a chronic eye disease that may lead to loss of vision, if not detected earlier. It occurs mainly due to the breakdown of optic nerve at the back of the eye and increased Intraocular Pressure (IOP) within the eyes. Glaucoma damages the optic nerve which carries information from the eye to the brain. It is one of the leading causes of blindness, and studies found that around 80 million people will be affected with glaucoma by 2020. This paper deals with the effectiveness of some automatic methods to detect glaucoma. Manual analysis is much time consuming and its accuracy depends on the clinicians. So various automatic analysis schemes were introduced later. Automatic analysis is much more effective than manual analysis.
KEYWORDS:Fundus, Glaucoma, correntropy, support vector machine.
I.INTRODUCTION
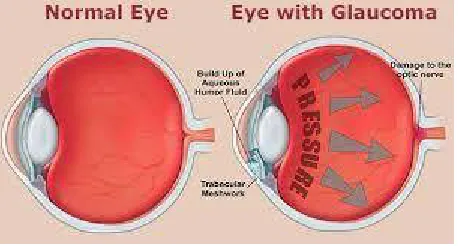
Glaucoma is an irretrievable eye disease that affects the structure of nerve fibers and optic disc parameters such as diameter, volume, and area. It is the leading cause of irreversible blindness worldwide. It occurs mainly due to the increased pressure in optic nerves. A person who suffers glaucoma will have IOP more than 21 mmHg. Between the cornea and the crystalline lens there is a watery fluid named aqueous humor . It maintains the pressure needed to inflate the eye. The intraocular pressure is simply a product of the rate of aqueous production and the aqueous drainage. This balance keeps the IOP in limit. IOP increases if the balance is not maintained and damage the optic nerve head which leads to vision loss. So, the early detection and treatment will control the progression of the disease. The difference between normal eye and eye affected with glaucoma is shown in figure 1.
Figure 1: Normal and Glaucomatic eye
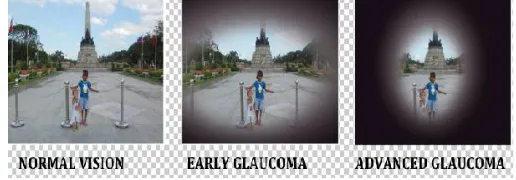
Different views of same image is represented in figure 2. Main reasons for glaucoma are old age, diabetes, eye injuries, myopia, Corticosteroids, migraine, etc...There exist many methods to detect glaucoma like Heidelberg Retinal Tomography (HRT), Scanning Laser Polarimetry (SLP) and Optical Coherence Tomography (OCT). All these methods assess optic nerve. Optical Coherence Tomography (OCT) is a non-invasive imaging test that use light waves to take the cross- section pictures of your retina. With OCT the distinctive layers of retina can be seen. It helps to map and measure their thickness. This measure helps to diagnose glaucoma. Scanning Laser Polarimetry (SLP) use polarized light to measure the thickness of retinal nerve fiber layer as part of glaucoma workup. Heidelberg Retinal Tomography (HRT) is a procedure used for the diagnosis and management of glaucoma by precisely observing and documenting the optic nerve head. The Heidelberg Retinal Tomography uses a special laser( that will not affects the eye ) to capture 3 dimensional photographs of the optic nerve and surrounding retina. This laser is mainly focused on the surface of the optic nerve and captures the image. But these methods are very expensive and need expert clinicians. Because of that automated diagnosis became important.
Figure 2: Schematic view of an image at different stages of vision
II. LITERATURE SURVEY
A. ANGLE OPEN DISTANCE 500 CALCULATION BY USING GUI
Glaucoma can be detected using an algorithm that automatically performs angle calculation by analyzing the eye ultrasound images. The algorithm reduce the processing time taken by the manual compute based algorithm without compromising on the speed, accuracy, sensitivity, cost and compatibility of the product with relevance of image processing concepts. To avoid the problems in image like noise, poor resolution, the following three step method is used.
i) Step-1: Ultrasound image processing
It includes the steps like, enhancement, thresholding median filtering, erosion and hole filling to curate fine image.
ii) Step--2: Segmentation of the processed image
Classification of various region of ultra sound image, eliminating the unwanted image, cropping the anterior chamber region and the location of reference axis these are the effective procedures for segmentation.
iii) Step--3: Calculation of AOD 500
It involves steps like masking determination of apex point (X apex, Y apex) location, tracing anterior chamber, AOD 500 calculations. This algorithm is able to correctly diagnose glaucoma in 97% of the cases.
B. CUP TO DISK RATIO
nasal-temporal side (ISNT) is combined with the CDR for the classification of fundus image as normal or glaucoma by using Support Vector Machine .It gives accuracy improvement and sensitivity of detection of glaucoma from retinal fundus image .
C. WAVELET BASED ENERGY FEATURES
In wavelet transform (WT), the image is represented in terms of the frequency of content of local regions over a range of scales. Data is initially subjected to standard histogram equalization. Then the discrete wavelet transform features are extracted and pre-processed. Then the features are normalized using z-score normalization technique. These features are then ranked using chi squared ([χ2]), gain ratio, information gain feature evaluation techniques and relief feature ranking schemes. Then the features are selected using four consistency subset evaluation strategies: best first, random search, genetic search and greedy search
.
D. PRINCIPAL COMPONENT ANALYSIS, FAST FOURIER TRANSFORM & SPLINE
In paper [4] it uses a 3 step procedure for automatic detection of glaucoma. The steps are Pre-processing, Feature extraction and Classification. Pre-processing involves illumination correction, vessel removal and optic nerve head normalization. The high-dimensional pre-processed images P are statistically compressed by PCA (Principal Component Analysis) to gain compact and meaningful features ‘f’. To capture complementary image information three different generic image representations is used with different spatial and frequency resolution for feature extraction. They are Pixel intensity values, B-spline coefficients and FFT coefficients.SVM classifier is used here for classification. . Here a 2 stage classification scheme combines the features to find out the glaucoma risk index (GRI). First stage involves the determination of probability for normalized PCA compressed features. Second stage includes the concatenation of the probabilities to one low dimensional feature space. The GRI obtained provide an accuracy of 80% in a two class problem.
E. TEXTURE AND HIGHER ORDER SPECTRA FEATURES
Two types of features are extracted after pre-processing:1) HOS parameters and 2) texture descriptors. HOS represents both amplitude and phase information of a signal. HOS can be used for both deterministic signals and random processes. This method is clinically significant because these features had a low p-value, which means that there is more chance that these features have very different values for the normal and abnormal classes and better discriminate the two classes[5]. Random-forest classifier, combined with z-score normalization and feature-selection methods are used for classification purpose
.
F. NEURAL NETWORK AND ADAPTIVE NEURON FUZZY INFERENCE SYSTEM
A classifier based on Neural Network and Adaptive Fuzzy Inference system (ANFIS)[6] is used. It utilizes both delta rule and backpropagation algorithm. ANFIS combines the capabilities of fuzzy inference algorithms and neural networks. An adaptive neural network is a structure consists of five layers and a number of nodes connected via links. First layer perform fuzzification, second layer executes the fuzzy AND of the antecedent part of the fuzzy rules, the third layer normalizes the fuzzy membership functions, the fourth layer executes the consequent part of the fuzzy rules and finally the last layer computes the output of the fuzzy system by summing up the outputs of the fourth layer. ANFIS is a multilayer feed forward network which uses ANN learning algorithms and fuzzy reasoning to characterize an input space to an output .
G. GABOR TRANSFORM
yielded the highest performance with an average accuracy of 93.10%, sensitivity of 89.75% and specificity of 96.20% using 23 features with Support Vector Machine (SVM) classifier.
H. 2D EWT AND CORRENTROPY
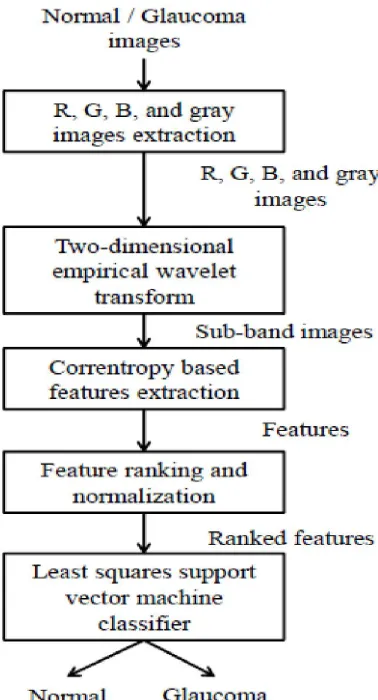
R,G,B components and gray scale values are extracted first[7]. Then R,G,B values are subjected to 2D empirical wavelet transform to form sub-band images. EWT is an adaptive method of signal decomposition. Band pass filters defined on each contiguous segment defines empirical wavelets. Then the correntropy is extracted from decomposed components. Correntropy is a non-linear kernelized similarity measure. Then the features showing distinction are selected using Student’s t-test algorithm. Then the features are standardized with zero mean and unit standard deviation. The process is known as z-score normalization. The ranked features are classified using the Least Squares Support Vector Machine (LS-SVM) classifier with kernels such as Radial Basis Function (RBF), Morlet wavelet and Mexican-hat wavelet.
Advantages of the this method are: Obtained a sensitivity of 100%, Reported high performance using three-fold and ten-fold cross validation, Used less number of features to obtain highest classification accuracy, Performance of the system does not depend on the resolution of the image. Comparison of the above discussed methods is tabulated in table 1.
Method Used
Accuracy Sensitivity Specificity
AOD 500 97 NR NR
PCA,FFT 80 NR NR
Gabor 93.1 89.75 96.2
HOS 95 93.33 96.67
2D EWT 98 100 96.67
*NR=Not Reported
Table 1: Comparison of various glaucoma detection techniques
III. CONCLUSION
This paper presents a literature survey of various automated glaucoma detection techniques. There are different methods through which we can detect glaucoma without the help of an efficient clinician. Compared to all these methods the one that use 2D Empirical Wavelet Transform and correntropy feature is found to be more effective. It uses Least Square-Support Vector Machine as classifier. It provides 98% accuracy, 100% sensitivity and 96.67% specificity. We can further enhance the accuracy by using Grey Level Co-occurrence Matrix features.
REFERENCES
[1] Neelapala Anil Kumar and P.A.Nageswara Rao, Prof P.Mallikarjuna Rao, Smt. M. Satya Anuradha: “Automatic detection of glaucoma in eye by angle opens distance 500 calculation by using GUI”, International Journal of Science and Advanced Technology (ISSN 2221-8386) Volume 1 No 6 August 2011.
[2] K.Narasimhan, Dr.K.Vijayarekha: “An efficient automated system for glaucoma detection using fundus image”, Journal of Theoretical and Applied Information Technology, 15th November 2011. Vol. 33 No.1.
[3] Sumeet Dua, Senior Member, IEEE, U. Rajendra Acharya, Pradeep Chowriappa, Member, IEEE, and S. Vinitha Sree, ‘Wavelet-Based Energy Features for Glaucomatous Image Classification”, IEEE Transactions on Information Technology in Biomedicine, Vol. 16, No. 1, January 2012.
[4] R. Bock, J. Meier, L. G. Ny´ul, J. Hornegger, and G. Michelson,
“Glaucoma risk index: Automated glaucoma detection from color fundus images,” Medical Image Analysis, vol. 14, no. 3, pp. 471–481, 2010.
[5] U. Rajendra Acharya, Sumeet Dua, Xian Du, Vinitha Sree S, and Chua Kuang Chua, “Automated Diagnosis of Glaucoma Using Texture and Higher Order Spectra Features”, ”, IEEE Transactions on Information Technology in Biomedicine Vol. 15, No: 3, May 2011.
[6] Rohan Appasaheb Borgalli, Hari Pratap Gautam , Winner George Parayil, “Automated Glaucoma Detection Techniques Using Fundus Image”,
International Journal of Technology Enhancements and Emerging Engineering Research, Vol 3, Issue 12.