ABSTRACT
AMIR, ASAD. Industry Technology Roadmapping of Nonwoven Medical Textiles. (Under the direction of Dr. Helmut H Hergeth).
This research is a collaboration between Wake County Economic Development,
NCSU Economic Development, and the College of Textiles. The overall purpose of this
research is to examine the process by which an Industry Technology Roadmap (ITR) is
developed, to start the development of an elementary roadmap for the medical
nonwovens industry, and finally to identify the role of the College of Textiles, NCSU in
effectively implementing this roadmap. The scope of this thesis covers the examination
of Industry Technology Roadmapping process, including the selection process for panel
members and preliminary identification of goals and challenges for the nonwoven
medical textiles. Compiling the roadmap itself goes beyond the scope and time frame of
this masters thesis.
A mixed methods method is employed for data collection and analysis. Experts
affiliated with the nonwovens industry, personnel from the Association of Nonwovens
Fabrics Industry (INDA), Nonwovens Cooperative Research Centre (NCRC), and faculty
from NC State University were surveyed. An attempt was also made to conduct an
industry wide survey to collect data about Industry location factors.
The results of this research provide insight into the road-mapping process that can
be employed for the nonwovens industry. A pilot roadmap for the nonwovens medical
industry identifies the process/product performance targets of medical textiles,
technology barriers/challenges for achieving these targets and the priorities related to
action plan for the College of Textiles in the areas of (i) types of collaborations with the
nonwoven industry and (ii) allocation of research and development resources to better
INDUSTRY TECHNOLOGY ROADMAPPING OF
NONWOVEN MEDICAL TEXTILES
by
ASAD AMIR
A thesis submitted to the Graduate Faculty of North Carolina State University
in partial fulfillment of the requirements for the Degree of
Master of Science
TEXTILE AND APPAREL, TECHNOLOGY AND MANAGEMENT
Raleigh
2006
APPROVED BY:
_____________________________ _____________________________
Dr. Blanton A. Godfrey Dr. Nancy Cassill
______________________________________
BIOGRAPHY
The author, Asad Amir was born in Karachi, Pakistan on June 21, 1979. His
parents are Amir Jan Baig and Afroz Iqbal Fatima and he has an elder sister Sarwat Amir.
In 1996, he began undergraduate studies at the Textile Institute of Pakistan,
Karachi. Asad graduated in May 2000 with a Bachelor of Science in Textile Sciences. In
July 2000, he joined Mohammed Farooq Textile Mills (MFTM), Karachi as assistant
printing manager. Realizing the importance and utility of business studies for
management, in July 2002, Asad started an MBA (evening) at Institute of Business
Administration (IBA), Karachi and earned a Post Graduate Diploma (PGD) in Business
Administration in 2004. Asad worked at MFTM until December 2004. He then left to
pursue his Masters of Science degree in TEXTILE AND APPAREL, TECHNOLOGY
AND MANAGEMENT the following spring semester at North Carolina State University.
Asad graduated with a Master of Science in Textile Technology Management in the Fall
ACKNOWLEDGEMENTS
I would like to thank the chair of the thesis committee, Dr. Helmut Hergeth for his
assistance and support through this research and learning process. I am grateful for this
help and encouragement that made this research possible. I am thankful and privileged to
have Dr. Nancy Cassill as a committee member who inspired me to grow both
professionally and personally. I would also like to thank Dr. Ted Morris whose insights
and suggestions provided a vision for this research. In addition, I would like to extend my
appreciation to Dr. Blanton A. Godfrey who funded the project and provided me with this
valuable research opportunity.
I would like to express my gratitude to Carl Dietz & Yousuf Shirazi of Alignent
Inc. for providing us with the road mapping Software, Vision Strategist. I would also like
to thank Cos Camelio of INDA whose inputs aided in the success of this project.
I am also grateful to Ruby Baji for her friendship and for listening to my endless
complains. Finally, I would like to thank my parents, Amir Jan Baig and Afroze Iqbal
Fatima, whose encouragement and support always give me strength to face challenges.
Without such a team of supporters and role models, realizing my goals would be virtually
TABLE OF CONTENTS
LIST OF TABLES ... vii
LIST OF FIGURES ... viii
CHAPTER I ... 1
INTRODUCTION... 1
PURPOSE OF THE STUDY... 3
SIGNIFICANCE OF THIS STUDY... 4
LIMITATIONS OF THIS STUDY... 4
DEFINITION OF TERMS... 6
CHAPTER II... 8
LITERATURE REVIEW... 8
TECHNOLOGY ROADMAPPING... 8
Introduction... 8
Background ... 10
What is Technology Roadmapping? ... 10
Definition of Technology Roadmapping ... 11
What is a Technology Roadmap? ... 11
Roadmapping Scope... 12
Uniqueness of Technology Roadmaps ... 12
Types of Technology Roadmapping ... 14
Technology Roadmapping Approaches ... 15
Purpose... 15
Format ... 18
Benefits of Technology Roadmapping ... 21
When should an industry produce a technology roadmap?... 23
Technology Roadmapping Process... 25
Expert Based Approach: ... 25
Workshop Based Approach: ... 25
Post Development Challenges ... 28
Keeping the roadmap alive: ... 28
Roadmapping Success Factors ... 29
INDUSTRY AND UNIVERSITY PARTNERSHIPS... 30
Introduction... 30
Nature of Relationship ... 31
CHAPTER III ... 33
RESEARCH METHODOLOGY... 33
Determination of an industry relevant to NC ... 33
Selection of Nonwovens Industry ... 34
Implication of the Clusters of Competitiveness Theory ... 35
Research Design- Approach 1 Schema... 39
Problems with Research Design-Approach 1 ... 40
Research Design - Approach 1 Analysis of Problems ... 41
Research design - Approach 2 ... 42
Data Analysis & Compilation... 43
Research Design - Approach 2 Schema... 44
CHAPTER VI... 45
RESULTS... 45
Environmental Scan of Nonwovens & Medical Textile ... 45
Overview of the US Market Place... 45
Overview of the Nonwoven Industry ... 46
History and Background ... 46
Market description ... 48
US Nonwovens Market... 50
Production and Consumption... 52
Fiber / Raw Material Consumption... 56
Trends in Materials, Process and New Products... 58
Overview of the Medical Textile Industry... 60
Introduction... 60
Definition ... 60
Medical Textiles Classification... 60
Applications ... 61
Medical Textiles and Nonwovens... 62
Trends in World Trade of Medical Textiles ... 69
NITR PROPOSAL DEVELOPMENT... 70
Recruiting for Panel... 71
IDENTIFICATION OF CHALLENGES FACED BY NONWOVEN MEDICAL TEXTILES... 72
Rising Raw Material Costs ... 72
Sustainability of Environment... 72
Life Cycle Study of Nonwovens... 73
FDA Approvals ... 73
Public Awareness... 74
New Uses for Nonwovens... 74
Truly Functional & Comfortable Medical Nonwovens ... 74
Sterilization ... 75
Reusable vs. Disposable Materials ... 76
Anti Microbial Treatments... 76
Clothing and Textiles for Disabled and Elderly People ... 76
Online quality inspections... 77
CHAPTER V ... 78
SUMMARY... 78
REFERENCES... 89
APPENDIX... 94
APPENDIX A- TABLES... 95
Table A-1: US Apparel Production and shipment Data ... 95
Table A-2: Core US-Nonwoven Firms by State... 96
Table A-3: 2003 Staple Fibers and Spunlaid Resins consumption... 97
Table A-4: Import Export Analysis for US nonwovens... 98
Table A-5: 2003 Employment and Number of Plants in NC’s Technical Textile Sector ... 99
APPENDIX B: RESEARCH DESIGN DETAILS FOR APPROACH 1 ... 100
Appendix B1:... 100
Appendix B2:... 101
Appendix B3:... 103
Appendix B4:... 107
Appendix B5:... 109
Appendix B6:... 120
APPENDIX C: COLLEGE OF TEXTILE FACULTY INTERVIEWS SUMMARY... 121
APPENDIX D: NONWOVENS INDUSTRY TECHNOLOGY ROADMAPPING PROPOSAL... 124
APPENDIX E: MEDICAL TEXTILES CONFERENCE 2004... 126
APPENDIX F: NITR INVITATION... 132
LIST OF TABLES
Table 1: Nonwoven Fabrics (NAICS 3132301). Value of product shipments ... 51
Table 2: Nonwovens Consumption by Region ... 53
Table 3: Nonwovens Production by Region ... 54
Table 4: American Nonwoven Consumption ... 54
Table 5: American Sales of Nonwoven Fabrics 2002, 2003-2008 ... 55
Table 6: Nonwoven Fabric Demand ... 55
Table 7: Trends in Materials, Process and New Products ... 59
Table 8: Non-implantable Materials ... 64
Table 9: Implantable Materials. ... 65
Table 10: Extracorporeal Devices... 65
Table 11: Healthcare/ Hygiene Products ... 66
Table 12: Forecast World Technical Textiles Consumption, 1995-2010, Volume (000 tons)... 68
LIST OF FIGURES
Figure 1:Nonwoven Worldwide Production... 2
Figure 2: A Generic Roadmap ... 12
Figure 3: Types of Roadmaps ... 14
Figure 4: Roadmapping Format - Multiple layers ... 18
Figure 5: Roadmapping Format - Bars ... 19
Figure 6: Roadmapping Format - Tables ... 19
Figure 7: Roadmapping Format - Graphs ... 20
Figure 8: Roadmapping Format - Pictorial Representation ... 20
Figure 9: Roadmapping Format - Flow Charts ... 21
Figure 10: Change, Complexity and Competition in Industries ... 24
Figure 11: Three Phase Technology Roadmapping Process... 26
Figure 12: Six Step Technology Roadmaping Model... 27
Figure 13: T-Plan Roadmapping Process ... 28
Figure 14: Research Design- Approach 1 Schema ... 39
Figure 15: Problems with Research Design-Approach 1... 40
Figure 16: Research Design- Approach 2 Schema ... 44
Figure 17: US Nonwoven Firms by State ... 52
Figure 18: Worldwide Nonwovens Production ... 53
Figure 19: 2003 Staple Fibers and Spunlaid Resins Consumption in North America... 56
Figure 20: Spundlaid Resins Distribution... 57
Figure 21: Staple Fibers Distribution as Follows ... 57
Figure 22: Share of Medical Textiles in Technical Technical Textiles Market (by volume) ... 68
Figure 23: NITR-Research Process ... 83
Figure 24: Thesis Objectives and Learning ... 87
CHAPTER I
Introduction
This research is a collaboration between the Wake County Economic
Development Commission, North Carolina State University Economic Development
Partnership, and the College of Textiles. Based on empirical findings from Porter’s
Industry Cluster Analysis report, the Research Triangle Park (RTP), North Carolina was
identified as the optimal location for a medical textile cluster (Porter, 2001). Porter,
however, identified weak technology commercialization structure & lack of collaboration
among & within clusters as the major challenges faced by this region.
According to Dr. Pourdeyhimi of North Carolina State University, medical
textiles are primarily made up of nonwovens (Pourdeyhimi, 2004). Nonwovens Report
International (2006) quotes Dr. Behnam Pourdeyhimi as saying “In this country (USA),
we have saturated areas such as medical, and hygiene. Over 90% of all such products are
nonwovens” (Nonwovens Report International, 2006). The nonwoven fabrics industry is
one of the fastest developing sectors of the textile business with a growth rate of 7.6 %
(Pourdeyhimi, 2004). The primary reason behind nonwovens’ increasing market share is
that they are manufactured by very high-speed and low cost processes compared to the
traditional woven and knitted fabrics. Moreover nonwovens are also finding end uses in
non-traditional textile markets such as automotives. United States continues to lead the
world in nonwoven’s technology, production and consumption. The US industry is
Figure 1:Nonwoven Worldwide Production
Source: Pourdeyhimi, Behnam (2004). Directions in nonwovens technologies. Retrieved March 5, 2005, from Nonwovens Cooperative Research Center (NCRC) Web site:
http://www.tx.ncsu.edu/ncrc/presentations/directions_in_nonwovens_technology.pdf
Based upon Michael E. Porters’ recommendations and due to relative infancy of
this growing industry, it is crucial to identify the current situation of its market and assess
the future technological, workforce, innovation, and infrastructure requirements needed
to sustain the growth and longevity of the industry. Having competitiveness issues and
being an innovation driven industry, industry technology roadmaps can serve as a solid
framework for this process. It can also serve as a tool for partnership between
market needs and collaboratively develop technologies and innovations to meet these
needs.
An Industry Technology Roadmap (ITR) is a structured, multi-dimensional,
technology planning process to support development, communication, and
implementation, linking technology and business needs by using series of simple charts
or graphs. The process brings together people from different parts of the business,
providing an opportunity for sharing information and perspectives.
Purpose of the Study
The purpose of this study is to examine the process by which an Industry
Technology Roadmap (ITR) is developed, to develop an elementary roadmap for the
medical nonwoven industry, and finally to identify the role of College of Textiles at
North Carolina State University in the effective implementation of this roadmap.
Specific objectives were to collect information on the nonwovens industry to
1. Provide an overview of the process/product performance targets of the nonwovens
industry.
2. Determine the barriers/challenges for achieving these targets.
3. Determine the priorities related to research and development for achieving targets.
4. Identify the types of collaborations needed between industry and the College of
Significance of This Study
The aim of this study is to contribute to the body of knowledge by providing
appropriate literature for studying the development of industry technology roadmaps for
the nonwovens industry and avenues of partnership between industry and university.
This study provides insight into the nonwovens market and presents information
about process/product performance targets of the nonwoven industry, technology
barriers/challenges for achieving these targets and the priorities related to research and
development for achieving the targets. Rather than relying solely on secondary data
sources such as INDA reports, this research uses a mixed method approach to data
collection and analysis. The results are generated based upon the recommendations of the
panel of experts that includes personnel from the nonwovens industry, INDA, NCRC, NC
State University Faculty and economic development committees at NC State University
and Wake County, NC. Finally, the research proposes an action plan for the College of
Textiles in the areas of (i) types of collaborations with the nonwoven industry and (ii)
allocation of research and development resources to better serve nonwoven industry. The
outcome of this research will provide a framework that can be applied to other sectors
within the industry in the development of clusters.
Limitations of This Study
Sample Size
Due to constraints of time and resources, the panel of experts constituted of a
limited number of people from industry, regulatory authorities and academia. Thus, the
resulting roadmap may not be representative of the whole medical nonwovens industry.
Timeframe
Data were collected over the course of 4 months in July 2006 - October 2006.
Scope of Study
Deliberately a focus is maintained in interviews and surveys on identifying the
role of the College of Textiles at North Carolina State University to better serve industry
Definition of Terms
Nonwovens: Nonwoven fabrics are broadly defined as sheet or web
structures bonded together by entangling fiber or filaments (and
by perforating films) mechanically, thermally or chemically.
They are flat, porous sheets that are made directly from separate
fibers or from molten plastic or plastic film. They are not made
by weaving or knitting and do not require converting the fibers
to yarn (INDA, 2006).
Medical Textiles: Medical textiles, also known as biomedical textiles, are
textile products and constructions, for medical and biological
uses used for first aid, clinical, or hygienic purposes (“What
are Medical,” 2001).
Technology Roadmapping: A technology roadmap is a plan (document) that defines the
critical Roadmapping requirements, performance targets
and timeframes for a given set of needs, and identifies the
technology alternatives (‘paths’ or ‘roads’) and milestones to
meet those targets (Ronald, Kostoff & Schaller, 2001).
Technology roadmapping is the needs-driven technology
planning process that delivers technology roadmaps
(Albright, Richard E, 1998). In other words, the essence of
minimizing the risks and uncertainties of that future view. It
captures the common view of a group of people about their
future and what they want to achieve in that future (Garcia
and Bray, 1997).
Process / Product Targets: Process or product related goals identified by nonwoven
Chapter II
Literature Review
This chapter describes existing literature on the process of technology
roadmapping. In addition, literature that describes the relationship between industry and
university and the benefit of collaboration between the two is also reviewed.
Technology Roadmapping
Introduction
Technology planning is becoming increasingly important for many reasons. Since
investment in technologies is a costly affair, it must be carefully considered; not all
investments in technologies have potential pay-off (Hassan, Ahsan, Mahfar &
Elamvazuthi, 2004). Today companies are facing many problems. Products are becoming
more complex and customized. Times-to-market are shrinking. Product life cycles are
shortening. A short-term focus is reducing investment funding to enhance returns on
investment ratios. Competition is increasing, resulting in cutbacks of profit margins.
These problems enhance the need for companies to be more focused and to better
understand both their industry and their markets. Better technology planning can help
deal with this increasingly competitive environment. Once identified, technology
enhancements or new technologies may be developed internally or collaboratively with
Technology roadmaps are being used as a technology-planning tool by a growing
number of organizations including corporations, government agencies and research
institutes. Roadmaps are used for many purposes, in domains as varied as foreign policy,
corporate strategy, and fundamental scientific research (Bruce & Fine, 2004).
Technology roadmapping helps to identify product needs, map them into
technology alternatives, and develop project plans to ensure the availability of the
required technologies upon need. It is an important tool for collaborative technology
planning and coordination for corporations as well as for entire industries. It is a specific
technique for technology planning, which fits within a more general set of planning
activities (Garcia & Bray, 1997).
Technology roadmapping allows companies to make better investment decisions
because it provides better information to:
• Identify critical product needs that will drive technology selection and
development decisions.
• Determine the technology alternatives that can satisfy critical product needs.
• Select the appropriate technology alternatives.
• Generate and implement a plan to develop and deploy appropriate technology
alternatives.
However, this roadmap is only a high level strategy for developing these
technologies. A more detailed plan is then needed to specify the actual projects and
activities (Garcia & Bray, 1997).
gallon, then lightweight composite materials is a possible solution. There may be other
more appropriate solutions. Therefore, you must start with the need, not a pre-defined
solution. It is a fundamentally different approach to start with a solution and look for
needs (Garcia & Bray, 1997).
Background
The approach was originally developed by Motorola more than 25 years ago, to
support integrated product-technology planning (Phaal, 2003). Bob Galvin of Motorola is
widely considered the father of the practice of technology roadmapping (Schaller, 1999).
Groups of people in the company would come together to develop a consensus vision for
the future of technology areas that affected their business. Motorola discovered that the
establishment of this pervasive culture of technology roadmapping enabled the company
to produce roadmaps that “…communicate visions, attract resources from business and
government, stimulate investigations, and monitor progress. They [Roadmaps] become
the inventory of possibilities for a particular field, thus stimulating earlier, more targeted
investigations (Galvin, 1998)." Technology roadmapping represents a powerful technique
for supporting technology management and planning in the firm. Roadmapping has been
widely adopted in industry (Willyard & McClees, 1987; Barker & Smith, 1995; Bray &
Garcia, 1997; EIRMA, 1997; Groenveld , 1997; Strauss et al., 1998; Albright & Kappel,
2003; McMillan, 2003).
What is Technology Roadmapping?
Definition of Technology Roadmapping
Technology roadmapping is a needs-driven technology planning process to help
identify, select, and develop technology alternatives to satisfy a set of product needs. It
brings together a team of experts to develop a framework for organizing and presenting
the critical technology-planning information to make the appropriate technology
investment decisions and to leverage those investments. (For an example of this teaming
process at the industry level see Garcia, Introduction to Technology Roadmapping: The
Semiconductor Industry Association’s Technology Roadmapping Process.)
Given a set of needs, the technology roadmapping process presents a way to
develop, organize, and present information about the critical system requirements and
performance targets that must be satisfied by certain time frames. It also identifies
technologies that need to be developed to meet those targets. Finally, it provides the
information needed to make trade-offs among different technology alternatives.
What is a Technology Roadmap?
A technology roadmap is the document that is produced by the technology
roadmapping process. A technology roadmap identifies alternate technology “roads” for
Figure 2: A Generic Roadmap
Source: Camponovo, G., Pigneur, Y. (2004). Extending technology roadmapping for environmental analysis. Retrieved March 5, 2005, from The University of Lausanne, SwitzerlandWeb Site:
http://www.hec.unil.ch/gcampono/index.php/publications/journals/GC2004VSST
Roadmapping Scope
Roadmapping can be done at either industry or corporate levels. These levels
require different pledges in terms of time, cost, level of effort, and complexity. However,
for both levels the resulting roadmaps have the same structure — needs, critical system
requirements and targets, technology areas, technology drivers and targets, technology
alternatives, recommended alternatives or paths, and a roadmap report — although with
different levels of detail (Garcia & Bray, 1997).
Uniqueness of Technology Roadmaps
methods make projections of technological capabilities and predict the invention and
diffusion of technological innovations into the future (Schaller, 1999). Similarly,
technology foresight aims to identify new areas of science and technology research over
an extended period of time.
Roadmaps differ from these methods in one important respect. In the
above-mentioned techniques the end-point is forecast, whereas the roadmapping process starts
with the end-point or vision clearly in mind and then draws the different technology paths
to achieve it (Scheer, 2001). Roadmapping is a tool for companies to predict future
market demands and to determine the technological processes and products required to
satisfy them. This process is unique in that it encourages firms, R&D organizations,
governments and industries to develop a shared vision of the future and explore the
opportunities and pathways to achieve it. Other exclusive attributes of Technology
Roadmapping includes
It is driven by “market pull,” that is, the technological innovations needed if
companies are to serve anticipated future markets. Roadmapping is NOT driven by
“technology push,” what can be done with the existing stock of technologies.
It builds on a vision of where a company or industry wishes to go and what technologies
are needed to get there.
It provides a route for achieving the vision, going from today to tomorrow, by
helping companies or organizations identify, select and develop the right technology
alternatives needed to create the right products for future markets (Industry Canada,
Types of Technology Roadmapping
Roadmaps can be developed at three broad levels of resolution: industry, technology and
product
• Industry roadmaps define broader market goals that are applicable across an entire sector and provide focus for industry to identify and address market, regulatory and other
barriers to growth and define a clear set of industry actions.
• Technology roadmaps identify, evaluate and promote the development of collaborative projects within and between industries to fill technology gaps and/or capture technology
related opportunities.
• Product level roadmaps provide business managers with a comprehensive, long-range technology assessment of their future product needs. This type of roadmap provides a
complete description of the product line, division or operating group of an organization.
(Technology Planning for Business Competitiveness, A Guide to Developing Technology
Roadmaps, Australian Government or the Department of Industry, Science and
Resources, 2001)
Figure 3: Types of Roadmaps
Technology Roadmapping Approaches
Purpose
Garcia and Bray (1997) identified that at both the levels- corporate and industry,
technology roadmapping has several potential purposes and resulting benefits. Three
major uses are:
• First, technology roadmapping can help develop a consensus about a set of needs
and the technologies required to satisfy those needs.
• Second, it provides a mechanism to help experts forecast technology
developments in targeted areas.
• Third, it can provide a framework to help plan and coordinate technology
developments both within a company or an entire industry.
The technology roadmapping approach is very flexible, and the terms ‘product’ or
‘business’ roadmapping may be more appropriate for many of its potential uses. Phaal’s
examination of 40 roadmaps revealed a range of different aims, clustered into the
following eight broad areas, based on observed structure and content (Phaal, 2003):
1. Product Planning
Description: This is by far the most common type of technology roadmap, relating to the
insertion of technology into manufactured products, often including more than one
generation of product.
Example: A Philips roadmap, where the approach has been widely adopted (Groenveld,
2. Service / Capability Planning
Description: It is similar to product planning, but more suited to service-based
enterprises, focusing on how technology supports organizational capabilities.
Example: A Post Office roadmap used to investigate the impact of technology
developments on the business. This roadmap focuses on organizational capabilities as the
bridge between technology and the business, rather than products.
3. Strategic Planning
Description: Includes a strategic dimension, in terms of supporting the evaluation of
different opportunities or threats, typically at the business level.
Example: The roadmap focuses on the development of a vision of the future business, in
terms of markets, business, products, technologies, skills, culture, etc. Gaps are
identified, by comparing the future vision with the current position, and strategic options
explored to bridge the gaps.
4. Long-range Planning
Description: Extends the planning time horizon, and is often performed at the sector or
national level (‘foresight’).
Example: A roadmap developed within the US Integrated Manufacturing Technology
Roadmapping (IMTR) Initiative8 (one of a series). This example focuses on information
systems, showing how technology developments are likely to converge towards the
5. Knowledge Asset Planning
Description: Aligning knowledge assets and knowledge management initiatives with
business objectives.
Example: This form of roadmap has been developed by the Artificial Intelligence
Applications Unit at the University of Edinburgh enabling organizations to visualize their
critical knowledge assets, and the linkages to the skills, technologies and competences
required to meet future market demands.
6. Programmed Planning
Description: Implementation of strategy and more directly relates to project planning (for
example R&D programs).
Example: A NASA roadmap, used to explore how the universe and life within it has
developed. This particular roadmap focuses on the management of the development
program for the Next Generation Space Telescope (NGST), showing the relationships
between technology development and program phases and milestones.
7. Process Planning
Description: Supports the management of knowledge, focusing on a particular process
area (for example, new product development).
Example: A type of technology roadmap to support product planning, focusing on the
knowledge flows that are needed to facilitate effective new product development and
8. Integration Planning
Description: Integration and/or evolution of technology, in terms of how different
technologies combine within products and systems, or to form new technologies (often
without showing the time dimension explicitly).
Example: A NASA roadmap, relating to the management of the development program,
focusing on ‘technology flow’, showing how technology feeds into test and
demonstration systems, to support scientific missions.
Format
Roadmaps are communicated with the help of following eight graphs (Phaal, 2003):
a. Multiple layers
Description: The most common format of technology roadmap comprises a number of
layers, such as technology, product, and market. The roadmap allows the evolution within
each layer to be explored, together with the inter-layer dependencies, facilitating the
integration of technology into products, services and business systems.
Figure 4: Roadmapping Format - Multiple layers
http://www.unido.org/file-b. Bars
Description: Many roadmaps are expressed in the form of a set of ‘bars’, for each layer or
sub-layer. This has the advantage of simplifying and unifying the required outputs, which
facilitates communication, integration of roadmaps, and the development of software to
support roadmapping.
Figure 5: Roadmapping Format – Bars
Source: Phaal, R. (2003). Foresight methodologies. Retrieved June 10, 2005, from United Nations Industrial Development Organization Web site: http://www.unido.org/file-storage/download/?file%5fid=16963
c. Tables
Description: In some cases, entire roadmaps, or layers within the roadmap, are expressed as tables (e.g. time vs. performance). This type of approach is particularly suited to situations where performance can be readily quantified, or if activities are clustered in specific time periods.
Figure 6: Roadmapping Format - Tables
d. Graphs
Description: Where product or technology performance can be quantified, a roadmap can be expressed as a simple graph or plot - typically one for each sub-layer. This type of graph is sometimes called ‘experience curve’, and is closely related to technology ‘S-curves’.
Figure 7: Roadmapping Format – Graphs
Source: Phaal, R. (2003). Foresight methodologies. Retrieved June 10, 2005, from United Nations Industrial Development Organization Web site: http://www.unido.org/file-storage/download/?file%5fid=16963
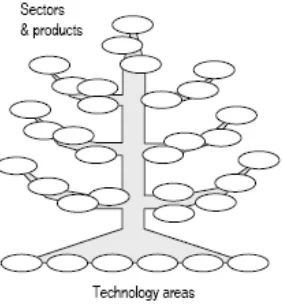
e. Pictorial representations
Description: Some roadmaps use more creative pictorial representations to communicate
technology integration and plans. Sometimes metaphors are used to support the objective
(e.g., a ‘tree’).
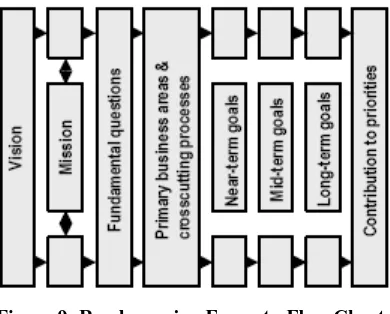
f. Flow charts
Description: A particular type of pictorial representation is the flow chart, which is
typically used to relate objectives, actions and outcomes.
Figure 9: Roadmapping Format - Flow Charts
Source: Phaal, R. (2003). Foresight methodologies. Retrieved June 10, 2005, from United Nations Industrial Development Organization Web site: http://www.unido.org/file-storage/download/?file%5fid=16963 g. Single layer
Description: This form is a subset of type ‘a’, focusing on a single layer of the multiple
layer roadmaps. While less complex, the disadvantage of this type is that the linkages
between the layers are not generally shown.
h. Text
Description: Some roadmaps are entirely or mostly text-based, describing the same issues
that are included in more conventional graphical roadmaps (which often have text-based
reports associated with them).
Benefits of Technology Roadmapping
The benefits of roadmapping are often derived directly from participating in the
roadmapping process itself, rather than merely consuming a roadmap document produced
of technology roadmapping are that it provides information to help make better
technology investment decisions. It does this by:
1- Identifying critical technologies or technology gaps that must be filled to meet product
performance targets.
2- Identifying ways to leverage R&D investments through coordinating research
activities either within a single company or among alliance members.
3- Bruce & Fine, point out that roadmapping provides a better understanding of the
potential paths for innovation, helping to visualize new opportunities for future
generations of product developments. Practitioners often assert that the roadmapping
“process” is at least as valuable, as the output, the roadmap itself. (Bruce & Fine, 2004)
4- Roadmap can serve as a marketing tool. It can show that a company really understands
customer needs and has access to or is developing (either internally or through alliances)
the technologies to meet their needs (Garcia & Bray, 1997).
5- Enhance prospects for economic growth for an entire industry sector through
collaborative efforts at innovation and technological development (Bruce & Fine, 2004).
6- Roadmap allows industry to collaboratively develop the key underlying technologies.
It helps the industry because a certain technology may be too expensive for a single
company to support or take too long to develop, given the resources that can be justified.
(Garcia & Bray, 1997).
7- Roadmaps guide fundamental scientific research and government funding. Roadmaps
can be used to convince the government funding agencies regarding support of scientific
“Government participation in the generation of
industrial technology roadmaps is a particularly
valuable way to gather intelligence regarding
impending changes in innovation patterns.
Roadmaps...generally represent a collective vision of
the technological future that serves as a template for
ways to integrate core capabilities, complementary
assets, and learning in the context of rapid change
(Department of Industry, Science and Resources,
Government of Australia, 2001).”
When Should an Industry Produce a Technology Roadmap?
Industry Canada’s guide to roadmapping identifies some of the indications that an
industry needs to produce a roadmap: (Industry Canada, 2006)
• Dramatically changing market demands
• The industry has reached a strategic juncture with regard to entering new markets,
seeking out new technologies or acquiring new skills.
• Decreasing market share and increased competition from other industries
• Companies within the industry have a vision of their place in future markets but
no strategy for making that vision tomorrow’s reality.
• Companies, or the industry, are facing uncertainty about what technologies and
• Lack of consensus among companies or within the industry on technology choices
• Each company within the industry is conducting separate R&D efforts devoted to
technology problems, that all have in common.
• Individual companies within an industry sector lack the resources and skills
needed to boost innovation, and would benefit from joint efforts in R&D,
sourcing, or supply-chain arrangements.
Figure 10: Change, Complexity and Competition in Industries
Technology Roadmapping Process
Data Collection Approaches
Two major approaches to development of technology roadmaps are:
Expert Based Approach:
A team of experts comes together to identify the structural relationships within the
industry and specify the quantitative and qualitative attributes of the roadmap.
Workshop Based Approach:
This technique is used to engage a wider group of industry, research, academic,
government and other stakeholders to draw on their knowledge and experiences.
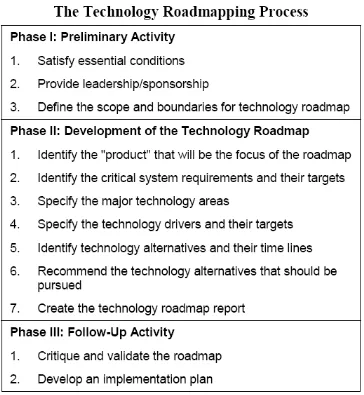
Garcia & Bray developed a three-phase roadmap development model. The first
phase involves preliminary activity without which the roadmapping probably should not
be done. The second phase is the development of the technology roadmap. The third
Figure 11: Three Phase Technology Roadmapping Process
Source: Garcia, Marie L. & Bray, Olin H. (1997). Fundamentals of technology roadmapping. Retrieved Sep 8, 2005, from Sandia national laboratories Web site: http://www.sandia.gov/Roadmap/home.htm.
The Department of Industry, Science and Resources, Australia, proposes a similar
Figure 12: Six Step Technology Roadmaping Model
Source: Department of industry, science and resources. Government of Australia (2001). A guide to developing roadmaps. Emerging industries occasional paper. Retrieved on September, 2005, from http://roadmap.itap.purdue.edu/ctr/documents/13_Technology_Road_Mapping.pdf
The T-Plan ‘Fast-start’ Approach to Technology Roadmapping
The standard T-Plan process, developed by Institute for Manufacturing,
University Of Cambridge (Phaal, Farrukh, & Probert, 2001) comprises four facilitated
business, product / service, and technology), with the final workshop bringing the layers
together on a time-basis to construct the chart.
Figure 13: T-Plan Roadmapping Process
Source: Phaal, R., Farrukh, C. & Probert, D. (2001). Technology roadmapping: Linking technology resources to business objectives. Retrieved June 10, 2005, from Institute for Manufacturing, University Of Cambridge Web site http://www.ifm.eng.cam.ac.uk/ctm/publications/tplan/trm_white_paper.pdf
Post Development Challenges
There are two key challenges to overcome if roadmapping is to be adopted widely
within a company:
Keeping the Roadmap Alive:
The full value of roadmapping can be obtained only if its information is kept
roadmap on a periodic basis, at least once a year, or perhaps linked to budget or strategy
cycles.
Roll-out:
Once the first roadmap is developed in an organization, it may be desired to
facilitate the adoption of the method in other parts of the organization. Essentially there
are two approaches to rolling-out the method:
– Top-down, where senior management prescribes the requirement for roadmaps – the
particular format may or may not be specified.
– Bottom-up (‘organic’), where the benefits of using the method are communicated and
support provided for application of the method where a potential fit with a business issue
problem is identified (Phaal, 2003).
Roadmapping Success Factors
Bruce & Fine (2004) report that a successful roadmap draws upon the following factors
• Should be an iterative process.
• Requires commitment from the participants, in terms of both time and resources.
• Depends on the competence of roadmap participants.
• Should be led by the stakeholders.
The department of Industry, Science and Resources, Australia, emphasize that
success of the roadmap depends on the following.
– Participation of the right people.
– Partnerships building.
– Designing of a manageable process, and
Industry and University Partnerships
Introduction
Rapid technological changes, shorter product life cycles, and increasingly intense
global competition are transforming the current competitive environment for most firms.
As a result, the timely development and commercialization of new technologies are
critically important for firm growth and survival (Ali, 1994). Though until recently firms
had been relying on in-house R&D efforts for developing new products and technologies,
now it is increasingly more difficult for firms to rely solely on internal organizational
units due to limited expertise and resources (Hamel & Prahalad, 1994).
Partnership between university and industry has been receiving considerable
attention because of its potential benefits for all parties. Powers suggest that the
increasing number of collaborations is an indication that all parties are benefiting.
Academic institutions and industry interact and enter into collaborative relationships for
many different reasons (Powers, Betz, & Aslanian, 1988). According to a survey
conducted by Peters and Fusfeld, companies collaborate in order to obtain access to manpower, obtain a window on science and technology, and gain access to university
facilities (Peters & Fusfeld, 1983).
Universities collaborate in order to obtain access to industry as a new source of
funding, to provide student exposure to real-world research problems, to work on
intellectually challenging problems of tangible relevance to society, and to gain access to
company research facilities and equipment. A document by US General Accounting
Nature of Relationship
Today, both industry and universities seek to establish close ties with one another
for a number of reasons. Industrial firms gain access to highly trained students,
professors, university facilities, and leading-edge technologies. Additionally, firms can
often enhance their image and reputation by associating with a prominent institution.
Powers et al. (1988) noted, “The most fundamental reason that institutions of higher
education want to collaborate with businesses is to improve their financial situations.
Another reason educational institutions seek collaborative relationships with businesses is
to promote advancement of knowledge by improving the quality of instruction and
research. Businesses enter cooperative relationships first of all to meet corporate product,
service, or management needs.”
Industry–University (I/U) collaboration can provide new opportunities for
advancing new technologies. For example, I/U partnerships in biotechnology have helped
advance basic research in microbiology (Pisano, 1990). Additionally, manufacturing
firms like Chrysler Corporation have worked with university partners to address applied
engineering projects (Frye, 1993).
EIRMA 1972, reports the justification for seeking industry university
collaboration is because of the very real benefits that the study has shown to accrue to
both parties from fruitful collaboration, such as:
a) For industry, in mobilizing the scientific and intellectual potential of universities to
help increase its effectiveness and productivity.
b) For the universities, by the stimulation of having to relate their work to real-life
c) For society as a whole, by the enhanced levels of effectiveness and responsibility of
the industrial and educational worlds in their services to the community.
Santoro and Chakrabarti’s (2001) research revealed seven key factors as being
especially important to industrial firms in establishing industry university relationships:
1) Strengthening skills, knowledge, and gaining access to university facilities for
advancing core technologies;
2) Strengthening skills, knowledge, and gaining access to university facilities for
advancing noncore technologies;
3) Organic and adaptable corporate culture;
4) Flexible university policies for intellectual property rights (IPR), patents, and licenses;
5) Presence of an I/U champion at the firm;
6) Firm’s level of personal interactions and resource commitments in their I/U
relationships;
7) Level of tangible outcomes generated from I/U relationships.
Chapter III
Research Methodology
Determination of an Industry Relevant to NC
In his Clusters of Innovation Initiative study on Research Triangle Park, Michael
E. Porter identified Textiles as an established cluster and the College of Textile, NCSU
among the world’s best with the Textile Protection and Comfort Research Center and the
Nonwovens Cooperative Research Center (Porter, 2001). He also emphasized the
possibility of several cross-clustering opportunities, between textiles and pharmaceuticals
/ biotechnology cluster.
The United State is a net exporter of nonwovens. During the period June 2004 to
June 2005, domestic manufacturers exported nonwovens goods worth $1.37 billion
compared with imports of $0.73 billion (OTEXA, 2005). See Table A-4 in Appendix A.
Forty of North Carolina’s 100 counties have at least one commercial nonwoven
related facility located in them (Pourdeyhimi, 2004). In addition, eight of the top 40
largest nonwoven firms in the world have plants in North Carolina (Duke University,
2005):
In August 2004, Dr. Behnam Pourdeyhimi, a professor at College of Textile,
North Carolina State University, reported 29 companies making nonwoven products in
North Carolina, as well as 70 that support them, such as distributors and packagers.
Overall, the nonwovens industry generates about $3 billion in annual economic activity
for the state, and it is growing at a rate of up to 8 percent a year (The News & Observer,
Selection of Nonwovens Industry
David L. Barkley & Mark S. Henry of Regional Economic Development
Research Laboratory (REDRL), Clemson University, South Carolina used the following
5-point screening criteria to identify promising manufacturing clusters (Berkley & Henry,
2005):
1. Five or more establishments in the S.C. Upstate in 1996.
2. Upstate industry employment was greater than 1000 in 1996.
3. Industry employment in the Upstate counties increased from 1988 to 1996.
4.Industry Location Quotient (LQ) for the Upstate counties exceeded 1.00 in 1996
or increased from 1988 to 1996. A location quotient greater than one indicates
that the region has been, over time, relatively successful in attracting or nurturing
employment in a specific industry.
5. Industry Competitiveness Differential (CD) of Shift-Share Analysis for Upstate
counties was positive for the period 1988 to 1996. A positive competitiveness
differential indicates that industry employment in the area grew at a more rapid
rate than for the nation, or area industry employment declined at a less rapid rate
than for the nation.
Applying the same criteria to North Carolina Nonwoven industry we find that:
1- In May 2005 there were 35 nonwovens fabric mills in North Carolina (Easley,
2005)
2- State employment in year 2003 was 2480. (See Table A-5 in Appendix A)
4- The number of nonwovens firms increased from 23 to 35 during 1993-2005 (see
Table A-5 Appendix A). This is a 52% increase.
5- The fact that today North Carolina has more than twice the number of nonwoven
textile mills than its nearest competitor shows that
i) It is doing better than the rest of the nation in maintaining &
attracting employment in nonwovens, and
ii) Nonwoven industry employment in the area grew at a more rapid
rate than the national average, or industry employment declined at a
less rapid rate than for the nation.
Implication of the Clusters of Competitiveness Theory
After having established that nonwovens industry is a growing cluster with
substantial impact on North Carolina Economy, it is important to analyze how this cluster
can be used for betterment of NC. Porter identifies three implications of clusters for a
region’s competitiveness.
i) An Explicit Cluster Development Program: Although chance events play a role in the formation and development of clusters, conscious efforts to raise
cluster competitiveness and innovative capacity can meaningfully influence the
trajectory of cluster development (Porter, 1998).
ii) Recruiting for Clusters: Recruitment strategies at the regional level should target clusters in which the region has strength, or clusters which overlap with
other clusters. This allows the region to market its unique assets rather than
iii) Opportunities at the Intersection of Clusters: Opportunities for growth often arise at the intersection of clusters where a region has strength (Porter,
1998).
As per Porter’s recommendation a conscious effort is needed for development
and recruitment of clusters. Such an effort would also assist in identifying the
opportunities at the intersection of clusters.
Technology roadmapping of the nonwovens industry will provide insight into
existing and future needs of the nonwovens industry. Given the substantial economic
importance of nonwovens industry to North Carolina, this roadmap would enable the
economic development committees of Wake County, NC, and NC State University to
allocate resources for meeting these needs. The roadmap would further allow the College
of Textiles to identify (i) the types of collaborations with the nonwoven industry and (ii)
the research areas for allocation of R&D to better serve nonwoven industry.
Development of Industry Technology Roadmaps
Research Design –Approach 1
The research for this study uses a mixed methods approach. Primary sources of
qualitative data include interviews of COT faculty members and NCSU economic
development officials. Quantitative data was collected through a survey of nonwoven
firms. The secondary data sources included INDA outlook report, data from the
Employment Security Commission of North Carolina, Duke University, Durham, NC,
This research was composed of three parts. Part I included data collection through
secondary sources and interviews of NC State Faculty, industry experts and a survey of
nonwoven companies. Firms having stakes in the nonwovens industry, such as
nonwovens roll goods producers; converters, raw material and services suppliers were the
potential respondents for the survey. Survey instrument was distributed to the nonwovens
firms at the Nonwovens Cooperative Research Center’s (NCRC) semi annual meeting
held on November 2 & 3, 2005, in the College of Textiles. This survey was conducted to
identify the (i) location factors of nonwovens plant and (ii) to identify a growing &
challenging segment of nonwovens industry. Part II involved gathering of data through
subsequent questionnaires about challenges faced by the industry in the “growing”
nonwovens segments and possible solutions. And finally with the help of data from Part
II, a roadmap would be compiled in Part III.
The interviews with the industry experts and NC State faculty were used in
development and for validation of survey instrument in Part I. Please see Appendix Bfor
details about details about development of survey instrument (B1), Institutional Review
Board approval (B2), survey instrument (B3), and Appendix B4 for sample selection,
product category, size, pre-test method, and location selection & data collection.
Data Analysis
Descriptive statistics analysis would be conducted to determine factors most
important for nonwoven industry in relocating to North Carolina and their expectation
Results
Until February 28, 2006, only three replies were received. None of the
respondents were core manufactures of nonwovens. Survey Respondents were sent
appreciation letters. Reminder letters (see Appendix B6) were sent to attendees who had
given their contact information. Moreover, the survey instrument was also posted on
NCRC’s website to remind the participants. These reminding efforts could only fetch one
additional response from a core manufacture, who citing company policy, declined to
participate in the survey. Due to the low response rate in general and absence of core
manufacturers in particular, results from this survey were not deemed useful for
identifying a nonwovens segment with high growth potential. This approach had to be
discarded in favor of a more result oriented one.
Data gathered through these responses was nonetheless analyzed using descriptive
Research Design- Approach 1 Schema Part I -Environmental Scan
Part II - Identification of a growing Sector in Nonwovens
Part III - Roadmap development
Figure 14: Research Design- Approach 1 Schema
Survey Instrument
For Identification of growing segment of nonwovens Validation & Pretest Survey Instrument validation and pretest through faculty, NCRC and nonwovens firm
Data Gathering
Data gathering from Industry
Data Analysis
Analysis of Data using descriptive statistics to identify the growing segment
Instrument Development
Development of survey instrument to gather industry opinion on the identified are
Data Gathering
Gathering the date from Industry, academia & Industry Associations
Data Analysis and Assembly
Analyzing the data and putting it in the form of a roadmap
Environmental Scan Of
Problems With Research Design-Approach 1 Part I Part II Surveys Sent ……… Responses Received
Low response rate + absence of core nonwovens mills
Reminders
One reply citing company policy for their inability to respond
Survey Instrument
For Identification of growing segment of nonwovens Validation & Pretest Survey Instrument validation and pretest through faculty, NCRC and nonwovens firm
Data Gathering
Data gathering from Industry
Data Analysis
Analysis of Data using descriptive statistics to identify the growing segment
1 2 3 4 40
1 2 3
1
Approach Changed/ Abandoned
Because of low response rate + Absence of core nonwovens companies, results from this survey were not deemed credible.
Environmental Scan Of
Research Design – Approach 1 Analysis of Problems
It is important to note that the nonwovens industry is more reserved about
sharing information then other segments of the textile industry. This diffidence may be
attributed to that fact that due to high growth rates of this industry, nonwovens firms
invest heavily in research and development to come up with new products and processes.
The industry is sensitive about exposure of high investment nonwovens technologies to
low cost importers. Sedef Uncu, a former NC State student, could achieve 10% response
rate (1 response from the 10 surveys sent) from the nonwovens firms while researching
on investment decisions (Uncu, 2003).
Low response rate from the industry for the questionnaire-survey based
approach highlighted the importance of creating increased awareness about the
technology road-mapping process and its benefits for the industry. Though the
reservations of nonwovens firms in sharing their technology paths because of market
competition is understandable, the industry can still find common ground for a joint effort
that benefit all of them. Identification of challenges such as workforce and infrastructure
requirements, opportunities available of basic and applied research at universities,
mutually beneficial partnerships with state and university economic development
committees and regulatory authorities has potential to be advantageous for all stake
Research Design - Approach 2
It was decided to adopt a new approach to bring the nonwovens industry
onboard for the NITR effort. The new research design consists of five parts. The research
for this study also uses a mixed methods approach. Primary sources of qualitative data
include interviews of COT faculty members, NCSU economic development officials and
a panel of nonwovens industry experts from industry, academia, and industry
organizations. The secondary data sources included INDA outlook report, data from the
Employment Security Commission of North Carolina, Duke University, Durham, NC,
NCRC, and the Council of Competitiveness report on Research Triangle Park.
Part I calls for an environmental scan of nonwovens industry. The sources
identified are INDA reports, nonwovens journals, faculty and industry expert interviews
and NC State library web database.
In Part II includes development of a proposal for NITR, presentation of this
proposal to potential partners, and finally recruitment of experts from industry, academia,
industry associations and economic development committees to serve on the NITR panel.
Data collection from the panel starts from Part III. In this step panel would be
asked to identify the goals of the industry and challenges it faces. Depending on the
preference and availability of panel members, data may be collected through workshop,
internet based communication or conference calls.
Part IV consists of collecting data from the panel for responses to these
challenges identified in Part III. The panel would identify possible rejoinders from the
Part V comprises of data compilation into a roadmap document.
Data Analysis & Compilation
Descriptive statistics and opinions of experts at the College of Textile would be
used in Part III of the research to identify and prioritize a limited number of targets.
These targets would be used for Part IV.
In Part IV, the NITR panel would be asked to propose solutions for the challenges
identified in Part III. These proposed solutions would then be compiled by section, using
Alignent’s ‘Vision Strategist’ software in Part V. The first draft of the roadmap would be
sent to the panel members along with plans for the next teleconference or email
correspondence, with an agenda to discuss the draft section by section. Written comments
on the first draft would also be requested.
This would be critical stage in the process and the potential exists for separation
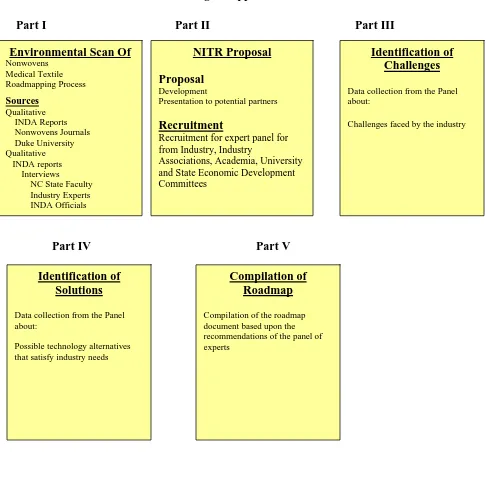
Research Design – Approach 2 Schema
Part I Part II Part III
Part IV Part V
Figure 16: Research Design- Approach 2 Schema
Environmental Scan Of
Nonwovens Medical Textile Roadmapping Process Sources Qualitative INDA Reports Nonwovens Journals Duke University Qualitative INDA reports Interviews NC State Faculty Industry Experts INDA Officials
NITR Proposal Proposal
Development
Presentation to potential partners
Recruitment
Recruitment for expert panel for from Industry, Industry
Associations, Academia, University and State Economic Development Committees
Identification of Challenges
Data collection from the Panel about:
Challenges faced by the industry
Identification of Solutions
Data collection from the Panel about:
Possible technology alternatives that satisfy industry needs
Compilation of Roadmap
Chapter VI
Results
Environmental Scan of Nonwovens & Medical Textile
This section describes the results of the environmental scan of Nonwovens and
Medical Textiles. Data was gathered from the INDA reports, Nonwovens Journals, the
Employment commission of North Carolina, Duke university website, and faculty
interview. See Appendix C for faculty interviews.
Overview of the US Market Place
The U.S. is by far the largest economy in the world. In 1998 it included more than
270 million consumers and 20 million businesses. The United States consumers purchase
more than $5.5 trillion of goods and services annually, and businesses invest over a
trillion dollars more for factories and equipment. In addition to spending by private
households and businesses, government agencies at all levels (federal, state, and local)
spend roughly an additional $1.5 trillion a year. Today the U.S. population is over 300
million (Census Bureau, 2005a). The national average per capita income of US is
$37,500, only behind Luxemburg (Success-and-culture.net, 2005). Luxemburg is
however slightly smaller in area than the state of Rhode Island, with a population of
468,571 (The World Fact Book, 2005).
Over 80 percent of the goods and services purchased by U.S. consumers each year
are made in the United States; the rest are imported from other nations (Encarta.com,
2005). The 20% slice of this huge economy is reason enough for exporters around the
aroused because the US imports more goods in this sector than it produces locally. Today
apparel imports account for an astronomical 96% of the total US market size. The
production and shipments for apparel for the first quarter of 2005 are valued at $3,678.9
million dollars (Census Bureau, 2005b) (see Table A-1 in Appendix A). US apparel sales
exceeded 182 billion dollars in 2000 (NPD Group, 2005). The North American 2003
GDP was $11.8 trillions, equaling 34% of the world GDP. The annual growth rate
forecast for North America from 2004-2008 is 3.7% (INDA, 2004b).
Overview of the Nonwoven Industry
History and Background
The nonwoven fabrics industry is international in scope. The concept of making
fabrics directly from fibres on needlepunch machinery achieved commercial viability in
North America and Europe more than 75 years ago. Much of the early work with
nonwovens was done by cotton mills, which were seeking to upgrade cotton waste into
salable products such as furniture stuffing and wipes. Some of the mills then working
with nonwoven technology were Avondale Mills, Callaway Mills, Dan River and
WestPoint Manufacturing (Mansfield, 2002). Facilities for producing commercial
quantities of fabrics using wet-laid technology were established in the United States
during the 1930s. Large-scale commercial production facilities for chemically bonded
nonwovens were placed in operation in the United States during the early 1940s and in
Europe and Japan following World War II. The earliest identifiable nonwoven consumer
products were wipes, developed by Chicopee's in the mid-1950s. During this time, Pellon
trades (Mansfield, 2002). During this initial phase, proprietary technology was used not
only to produce fabric structures that performed better than the items they were designed
to replace, but it also was used when traditional fabrics could not be used. As a result,
new applications and markets were established and the industry expanded.
Up until the 1960s, the major technology for nonwovens was based on drylaid
technology. The 1960s, however, saw the introduction of spunbonded, meltblown,
needlepunch and wetlaid nonwoven technology. By the 1970s, the establishment of a
trade association for nonwovens, the Association for the Nonwoven Fabrics Industry
(INDA), provided a focal point for nonwovens as useful and distinct materials
differentiated from conventional textile materials (Mansfield, 2002).
The 1980s was a decade of increasing growth in nonwovens activity throughout
the world, particularly in spunbonded and meltblown products. Factors influencing
spunbonded and meltblown growth included the expiration of patents, which led to the
development of turnkey plants from companies like Germany-based Reifenhäuser, as
well as lower-cost and higher-quality polyolefin and polyester resins (Mansfield, 2002).
The 1990s marked the era of widespread acceptance of nonwovens as
performance and problem solving materials for industries as diverse as civil engineering
and healthcare. Many of the products that came into use during this time were based on
composites made by combining different types of nonwovens and/or nonwovens with
other materials, such as films and foams (Mansfield, 2002). By the mid-1990s about half
of the worldwide nonwoven fabric production capacity was located in North America, a
third in Europe, and an eighth in Japan. Capacities in these areas were expanding at