HIGHLIGHTED ARTICLE
GENETICS | INVESTIGATION
Assessing Gene-Environment Interactions for
Common and Rare Variants with Binary Traits
Using Gene-Trait Similarity Regression
Guolin Zhao,* Rachel Marceau,* Daowen Zhang,* and Jung-Ying Tzeng*,†,1
*Department of Statistics and†Bioinformatics Research Center, North Carolina State University, Raleigh, North Carolina 27695
ABSTRACTAccounting for gene–environment (G3E) interactions in complex trait association studies can facilitate our understanding of genetic heterogeneity under different environmental exposures, improve the ability to discover susceptible genes that exhibit little marginal effect, provide insight into the biological mechanisms of complex diseases, help to identify high-risk subgroups in the pop-ulation, and uncover hidden heritability. However, significantG3Einteractions can be difficult tofind. The sample sizes required for sufficient power to detect association are much larger than those needed for genetic main effects, and interactions are sensitive to misspecification of the main-effects model. These issues are exacerbated when working with binary phenotypes and rare variants, which bear less information on association. In this work, we present a similarity-based regression method for evaluatingG3Einteractions for rare variants with binary traits. The proposed model aggregates the genetic andG3Einformation across markers, using genetic similarity, thus increasing the ability to detectG3Esignals. The model has a random effects interpretation, which leads to robustness against main-effect misspecifications when evaluatingG3Einteractions. We construct score tests to examineG3Einteractions and a computationally efficient EM algorithm to estimate the nuisance variance components. Using simulations and data applications, we show that the proposed method is aflexible and powerful tool to study theG3Eeffect in common or rare variant studies with binary traits.
KEYWORDSbinary traits; gene–environment interaction; rare variant association; GLMM; marker-set interaction analysis; variance-component methods
H
UMAN complex traits have a multifactor etiology that involves the interplay between genetic susceptibility and environmental exposures. Studies of gene–environment (G3E) interactions can facilitate our understanding of ge-netic heterogeneity under different environmental expo-sures (Kraftet al.2007; Van Os and Rutten 2009), help to identify high-risk subgroups in the population (Murcray et al.2009), provide insight into the biological mechanisms of complex diseases (Thomas 2010), and improve the ability to discover susceptible genes that interact with other factors but exhibit little marginal effect (Thomas 2010). However,finding significant G3E interactions is not an easy task. Model misspecification, inconsistent definitions of the envi-ronmental variable, and insufficient sample sizes are just a few of the issues that often lead to low power and non-reproduciblefindings inG3Estudies (Mechanicet al.2012; Jiaoet al.2013; Winham and Biernacka 2013). In particular,
the sample size needed to detect aG3Eeffect is usually four times larger than that needed to detect a main effect of sim-ilar magnitude (Thomas 2011). Thus, researchers need a robust, powerfulG3Etest to generate reproduciblefindings. Conventionally, researchers search for significant genetic or G3E associations, using single-SNP methods, e.g., the Kraft 2-d.f. test (Kraftet al. 2007) or the simultaneous test of Dai (Dai et al. 2012). More complex methods (e.g., Mukherjee and Chatterjee 2008; Murcrayet al.2009; Sohns et al.2013) aim to retain the advantages from both the case-only test (high power but sensitive toG–Ecorrelations) and the standard case–control G3Etest (low power but robust to G–E correlations). Despite the many efforts to improve single-SNPG3Etests, issues remain;e.g., a large proportion of trait heritability remains unexplained (Manolio et al. 2009) due to false positive and/or false negativefindings.
Inflated false positive rates arise when the model used to screen for G3E interactions does not correctly reflect the true underlying genetic (G) and environmental (E) effects (Voormanet al.2011; Linet al.2013; Wanget al.2013). To address this issue, Voormanet al.(2011) suggested a model-robust estimate of the variance, and Lin et al. (2013) and Wanget al.(2013) suggested a random-effect model to capture
Copyright © 2015 by the Genetics Society of America doi: 10.1534/genetics.114.171686
Manuscript received October 12, 2014; accepted for publication December 29, 2014; published Early Online January 12, 2015.
1Corresponding author: Department of Statistics, North Carolina State University,
the genetic main effect. The false negative (underpower) is-sues can be addressed by evaluatingG3Eeffects on a set of markers,e.g., on genes, linkage disequilibrium (LD) blocks, or pathways (Tzeng et al. 2011; Lin et al. 2013). Marker–set G3Eanalysis can improve power by aggregating effects across markers. Such accumulation methods account for LD among markers and reduce the total number of tests to be performed. The improved power is particularly crucial for common var-iants with subtle individual effects and for rare varvar-iants with sparse occurrence (Sham and Cherny 2011). In addition, op-erating at a gene/pathway level helps increase reproducibility (Sohnset al.2013).
Several G3Emarker-set methods are available to study associations with common variants, where the major task is to avoid a large number of parameters for modeling G, E, andG3Evariables. One of thefirst proposedG3E marker-set methods was Tukey’s 1-d.f. test (Chatterjeeet al.2006), which made significant progress toward fully understanding complex diseases. However, this method makes the often in-correct assumption that a SNP’s interaction effect is propor-tional to its marginal genetic effect (Winham and Biernacka 2013). Other commonly adopted G3E marker-set methods include minimum P-value (min-P) methods and weighted burden methods, where weights can be obtained from the principal components (PCs) of the SNP genotypes (Winham and Biernacka 2013) or from theG–Ecorrelation (Jiaoet al. 2013). In particular, Jiao et al.(2013) showed that the cor-relation betweenGandEcan serve as an informative indicator forG3Einteractions and that incorporatingG–Ecorrelations as weights can increase the signal-to-noise ratio in aG3E marker set while avoiding permutations. However, these observations are valid only when the true G–Ecorrelation is in the same direction as theG3Einteraction (Jiaoet al.2013). Fan and Lo (2013) proposed a model-free approach based on a summation of partitions to evaluate the interaction effects for rare variants. However, their method evaluates only the combined effect ofGandG3E, not the separated effects. Re-cently, Linet al.(2013) proposed a generalized linear mixed-effect model (GLMM) for G3E interactions for binary and continuous traits and showed it has superior power and ro-bustness over min-P methods. A similar method, similarity regression (SimReg), proposed by Tzenget al.(2011) to study marker-setG3Efor continuous traits, was shown to be con-nected to linear mixed-effect models.
In this article, we extend the SimReg G3E framework established in Tzenget al.(2011) to binary traits with com-mon or rare variants. SimReg, which is inspired by Haseman– Elston regression for linkage analysis (Haseman and Elston 1972; Elston et al. 2000) and haplotype similarity tests for regional association (Tzenget al.2003; Beckmannet al.2005), uses a regression model to correlate trait similarity with ge-netic similarity across multiple loci and to account for covari-ates. SimReg has been shown to perform well for common and rare variants (Tzeng et al.2011). However, unlike similarity-based testing for the genetic main effect (Tzenget al.2009) or forG3Ewith quantitative traits (Tzenget al.2011),G3Etests
with binary traits have several challenges associated with com-putation and estimation. In particular, G3Etests require the estimation of nuisance parameters to capture the main effects. Estimating these parameters requires high-dimensional inte-gration and the inversion of a high-dimensional similarity matrix. For quantitativeG3Etests, this estimation can be side-stepped using the normality of the phenotype, but no such useful properties exist for binaryG3Etests. To overcome these challenges, Linet al.(2013) proposed using ridge regression to estimate the nuisance main effects, selecting the tuning param-eter using generalized cross validation.
In our work, we develop an EM algorithm to approximate the integration and we alleviate the computational burden of maximum-likelihood estimation (MLE) by performing a low-rank approximation of the similarity matrix. We show that the SimReg coefficient can be expressed as a variance compo-nent of a working GLMM, which facilitates the derivation of a test statistic and unifies SimReg with other random-effect-based methods (e.g., Linet al.2013; Wanget al.2013). The proposed SimReg method can incorporate covariates and uses a permutation-free procedure to evaluateG3Eeffects. In ad-dition, the proposed method extends the model from linear effects (e.g., Jiaoet al.2013; Linet al.2013) to other complex effects by selecting appropriate similarity metrics, and it avoids the need to select tuning parameters. Unlike current robust marker-setG3Emethods that focus on common var-iant analysis, we investigate the performance of the proposed G3Estrategy with rare and common variants. We evaluate the validity and power of the proposed method using simu-lation studies and illustrate the utility of the proposed method via two data applications: one studies the interactions be-tweenPLA2G7and physical activity on obesity, using Cohorte Lausannoise (CoLaus) sequencing data, and a second assesses the effect modifier role of body mass index (BMI) on the as-sociation betweenTCF7L2and type 2 diabetes, using the Wellcome Trust Case Control Consortium data.
Materials and Methods
Gene–trait similarity regression for G3E effects
Let Yi be the binary disease indicator for individual i (i¼ 1;. . .;n);i.e.,Yi¼1 if individualihas the disease of interest and Yi¼0 otherwise. LetGmi be the minor allele count for individual i at locus m ðm¼1;. . .;MÞ; let XEi be a 13KE vector of environmental factors, and let XCi be the 13KC vector of confounders. The full covariate vector is Xi¼ ð1;XCi;XEiÞwith dimension 13ð1þKCþKEÞ:All covar-iates are standardized to have a mean of 0 and a variance of 1. For illustration, we consider the case where KE ¼1;but it is straightforward to extend the proposed work toKE.1:
accounting for the fact that theYi’s have difference variances (Tzenget al.2009). From this definition, the expected trait similarity EðTijXÞ ¼vivj3EfðYi2m0iÞðYj2m0jÞg is the co-variance of Yi and Yj with weights vivj: For binary traits, we assume a logistic model,m0
i ¼eXig=ð1þeXigÞ;wheregis the coefficient vector of the covariateXiandvi¼m0ið12m0iÞ is the optimal weight for the logistic model (Tzenget al. 2009).
Genetic similarity is calculated as the weighted sum of single-marker similarities; i.e., Sij¼
PM
m¼1wmsðGmi;Gmj Þ; where sðGm
i ;Gmj Þ is the genetic similarity at marker mand wm is the weight. There are several choices for sðGmi ;Gmj Þ (e.g., Wessel and Schork 2006; Schaid 2010a); a popular one is the identity-by-state (IBS) metric:sIBS¼22Gmi 2Gmj : Weightswmare typically based on allele frequencies, the degree of evolutionary conservation, or the functionality of the variants (Wessel and Schork 2006; Priceet al. 2010; Schaid 2010a,b). For example, one can use the minor allele frequency (MAF) of marker m, denoted by qm; to up-weight similarities that are contributed by rare variants: e.g.,wm¼ ð12qmÞ24 (Wu et al. 2011) can be used to target rare variants only, or a moderate weight wm¼q2
3=4
m (Pongpanichet al. 2012) can be used to promote similarities attributed to rare alleles while retaining the contributions from common variants.
The proposedG3Egene–trait similarity regression model is
ETijjX;S¼aþb3XEiXEjþc3Sijþd3Sij3XEiXEj; i6¼j: (1)
Because Tij incorporates baseline covariate information, model (1) does not contain an intercept or anXEiXEj interac-tion covariate term (i.e., a¼b¼0Þ (Tzeng et al. 2011). Using model (1), one can assess theG3Einteraction by test-ingHGE
0 :d¼0, or one can perform a joint test for the genetic
main effect and G3Einteractions simultaneously by testing HJoint
0 :c¼d¼0:The joint test is recommended if either the
genetic heterogeneity or the G3E interaction mechanism is unknown (Kraftet al.2007; Tzenget al.2011).
Score test for G3E effects and joint effects
Following a similar procedure to that found in Tzenget al. (2009), we connect the similarity regression to a working GLMM to derive the score test. Consider the following GLMM,
gðmÞ ¼XgþhGþhGE; (2)
where m¼ ðm1;. . .;mnÞ is a vector of conditional means
mi¼EðYijX;hG;hGEÞ and gð:Þ is a link function. Here, we consider a logit link gðmiÞ ¼log fmi=ð12miÞg. Vectors hGðn31Þ¼ ðhG1; ::: ;hGnÞandhGEðn31Þ¼ ðhGE1; ::: ;hGEnÞ
con-tain the subject-specific genetic main effect andG3E interac-tion, respectively. AssumehGandhGEare random effects;i.e., hGNð0;tGSGÞ and hGENð0;tGESGEÞ with SG¼ fSijg; SGE¼DSGD;andD¼diagfXEig:Then, the marginal covari-ance ofYiandYjin this working model is
covYi;Yj
n
g9m0ig9
m0j
o21
3tGSijþtGEXEiXEjSij;
whereg9ðmÞ ¼@gðmÞ=@m(seeAppendix A). Recall the expected trait similarity isEðTijjXÞ ¼vivj3covðYi;YjÞ:Therefore,
ETijjX
vivj3
n
g9m0ig9m0j
o21
3tG3SijþtGE3XEiXEjSij
¼tG3SijþtGE3XEiXEjSij;
where vi¼g9ðm0iÞ ¼1=m 0 ið12m
0
iÞ:In other words, we can examine HGE
0 :d¼0 and H Joint
0 :c¼d¼0 of model (1) by
testing HGE
0 :tGE¼0 and H0Joint:tG¼tGE¼0 in model (2), respectively.
To derive the score test statistics, we rewrite model (2) as
gðmÞ ¼XgþZGbþZGEbGE; (3)
wherebNð0;tGIL3LÞ;bGENð0;tGEIL3LÞ;Lis the rank of matrix SG; and ZG is a n3L matrix satisfying ZGZGT¼SG: Matrix ZGE is defined in the same manner as ZG; and ZGE¼DZG because SGE¼DSGD: Following Zhang and Lin (2003), the score statistic to examine the G3E effect (i.e., testingH0GE:tGE¼0Þcan be calculated as
UGE
¼1
2 ðy W
12XgÞTV121SGEV121
y1W2Xg2trðP1SGEÞ
tG¼tGb;tGE¼0;g¼^g;
where yW
1 ¼Xg^þZG^bþDGðy2m^GÞ is the working vector in model (3) under HGE
0 :tGE¼0; mG¼EðYX;bÞ ¼g21 ðXgþZGbÞ; DG¼diagfg9ðmGiÞg with g9ðmiÞ ¼1=fmið12 miÞg;andmG
i is theith entry of mG;tbG and^gare the MLEs fortGandgunderH0GE;respectively;V1¼WG21þtGSGwith WG¼diagfmGið12mGiÞg; and P1¼V1212V121XðXTV121XÞ2
1
XTV21
1 : As noted in the literature (Zhang and Lin 2003;
Tzeng and Zhang 2007), the second term,trðP1SGEÞ;is the
mean of thefirst term and its variability is small compared to thefirst term. Thus, we derive our test statistic using only the
first term;i.e.,
TGE¼1
2 ðy
W 12XgÞ
T
V121SGEV121
y1W2Xg
tG¼tbG;tGE¼0; g¼^g :
We propose an EM algorithm in Appendix B to obtain the MLEs fortGandg.
In a similar manner, the score statistic underHJoint 0 :tG¼ tGE¼0 can be obtained as
UJoint¼
1 2 ðy
W
0 2XgÞTV021ðSGEþSGÞV021
yW0 2Xg
2tr½P0ðSGEþSGÞ
o
j
tG¼0; tGE¼0; g¼~g;
TJoint¼
1 2 ðy
W
0 2XgÞTV021
3ðSGEþSGÞV021ðyW0 2XgÞ
j
tG¼0; tGE¼0; g¼~g;
whereyW
0 ¼Xg~þD
y2mc0is the working vector under
Hjoint0 :tG¼tGE¼0: Here, m0¼EðYXÞ ¼g21ðXgÞ; V0¼
W21
0 ; W0¼diagfm0ið12m 0
iÞg; P0¼V0212V021XðXTV021
XÞ21XTV21
0 ;andg~is the MLE forgunder HJoint0 :
We show in Appendix C that TGE and TJoint follow
a weighted x2-distribution asymptotically under HGE 0 and
HJoint
0 ;respectively.P-values can then be calculated
numeri-cally using moment-matching approximations (Duchesne and Lafaye de Micheaux 2010).
Low-rank approximation ofSG for computational and
statistical efficiency
The calculation of the G3Etest statistic involves the inver-sion of matricesV1andSGE;both of dimensionn3n:When
nis large (e.g.,.5k), direct inversion of these matrices can be computationally intensive, and the inversion must be performed at every EM iteration to obtain main-effect term b (see Appendix B). To reduce the computational intensity and to facilitate the inversion of these matrices, we con-sider a low-rank approximation of SG: The low-rank ap-proximation has been used in the literature to improve power when the number of markers increases and when more noise is incorporated into SG(Cai et al.2011). Pre-vious works (Cai et al. 2011; Tzeng and Zhang 2007; Tzeng et al. 2011) indicate thatSG is a positive semidefi -nite matrix, for which there are a few dominant eigenval-ues. Assume that l1$l2$⋯$l~L;~L#L; are the leading
eigenvalues that explain the majority of the variance ofSG [i.e.,S^Lℓ¼1lℓ=SℓL¼1lℓ$pfor some p2(0;1]] and have
cor-responding eigenvectors e1;e2;⋯;e~L: Then, we approxi-mate ZG by ZfG[
[
ffiffiffiffiffi
l1 p
e1;. . .; ffiffiffiffiffi
l~L
p
e~L
]
For an appropriate choice of p (e.g., p¼0:90e0:99Þ; fSG¼ZfGZfGT
contains most of the information from SG:Especially with rare var-iant data, ~Lis usually , L;and the computation is more straightforward.
Miao (2009) indicated that the potential bias caused by a low-rank approximation can be minimized if a high per-centage of the variation of SG can be retained. In our explorations, we found that selecting too small a p did not affect the test size but did lead to power loss because too much genetic information is discarded. We also found that the power loss with a large p (e.g., p = 0.99) was negligible but could stabilize the numerical calculation and boost computational efficiency. The improvement when p¼0:99 occurs because SG has many eigenvalues that are near zero. Using a p slightly,1 removes a large number of near-zero eigenvalues, which stabilizes the nu-merical computations, shortens the computational time, and yields a type I error rate close to the nominal level (Table 1).
Simulation studies
To investigate the performance of the proposed SimReg G3E method, we conducted simulation studies. The first simulation focuses on rare-variant (RV) analysis using se-quence data, and the second simulation focuses on common-variant (CV) analysis using HapMap data. The simulation data and code are available from the Dryad Digital Reposi-tory (http://datadryad.org/) athttp://doi.org/10.5061/dryad. 742gv(i.e., Dryad data identifier:doi:10.5061/dryad.742gv).
RV simulations:We obtained 10,000 haplotypes for a 1-Mb
region simulated by COSI (Schaffneret al.2005) according to a coalescent model where the LD pattern and population history mimicked those of the European population. We se-lected the first 100 rare loci [i.e., minor allele frequency (MAF) ,5%] for further analyses. We randomly drew 2 haplotypes with replacement from the 10,000 to form each subject’s genotype. We generated the binary phenotype from a BernoulliðpiÞdistribution, wherepi¼ehi=ð1þehiÞ; hi¼g0þXEigEþ
PR
r¼1GrigrGþ
PR
r¼1GriXEigrGE; R is the number of causal loci, and Griis the number of rare alleles at causal locusr, 1#r#R:While we varied the value ofR, we controlled the population attributable risk (PAR) ataGand aGE for the genetic main effect and G3E effect, respectively (Madsen and Browning 2009). Given aG; aGE; and R, we calculate grG andgrGE usinggrG¼logfðaG=RÞ=ðð12aG=RÞ3 qrÞ þ1g and grGxE¼logfðaGE=RÞ= ðð12aGE=RÞ3qrÞ þ1g (Madsen and Browning 2009), where r¼1; ::: ;R; and qr is the MAF for therth locus based on the 10,000 haplotypes. We considered both case–control sampling with 750 cases and 750 controls and random sampling with sample size 1500 and prevalence rate 0.3.
In the type I error analysis, we set ðaG;aGEÞ ¼ ð0;0Þ for the joint test and consideredðaG;aGEÞ ¼ ð0;0Þandð0:02;0Þ for theG3Etest. Because the burden-based tests are sensi-tive to the misspecification of the main-effect model (Voorman et al.2011), we set a weak main-effect PAR so that the burden-based tests can still serve as a valid benchmark. We performed 10,000 replicates per scenario. In the power analysis, we set ðaG;aGEÞ ¼ ð0:02;0:1Þfor both theG3Etest and the joint test and consideredR¼20; 40; 60; 80;and 100:We performed 500 replicates per scenario. In all analyses, the 100 loci were included in the association tests.
SimReg’s performance was compared to GESAT (Linet al. 2013) and a burden-basedG3Etest. GESAT is a GLMM-based G3E test that is closely connected to SimReg: from the GLMM representation in model (2), we see that SimReg assumeshGENð0; tGESGEÞ;whereSGE(calculated through the similarity kernel) determines how the G3E effects are modeled. In contrast, GESAT assumes a linear effect onhGE; i.e.,hGE¼XGEbGEwithbGENð0; tGEIÞ;which is equivalent to settingSGE¼XGEXGET (i.e., a linear kernel withwm¼1).
code does not support joint tests). For the burden-basedG3E test, wefirst summarize the marker-set information of subject i, using the number of rare variants in the set, referred to as mutation burden. Then, we fit a logistic model, logit PðYi¼1Xi;GÞ ¼b0þXEibEþGeibGþGeiXEibGE;whereGeiis the mutation burden for subject i. Under this model, the G3Eeffect can be detected by testingH0:bGE¼0;and the joint effect can be detected by testingH0:bG¼bGE¼0:
CV simulations: We obtained 234 phased haplotypes of
gene TCF7L2 from chromosome 10 of the Utah residents with ancestry from northern and western Europe (CEU) samples in HapMap 3. We focused our analysis on the 29 typed SNPs genotyped in the Wellcome Trust Case Control Consortium (WTCCC) analysis (Wellcome Trust Case Con-trol Consortium 2007). The MAFs of these 29 SNPs ranged from 0.0085 to 0.48. We randomly drew 2 haplotypes with replacement from the 234 phased haplotypes to form an in-dividual genotype. We assumed that 2 of the 29 SNPs were causal and simulated the binary phenotype of individual i from a Bernoulli ðpiÞ distribution, wherepi¼ehi=ð1þehiÞ; hi¼g0þXEigEþG1ig
1 GþG2ig
2
GþG1iXEig1GEþG2iXEig2GE;and Gr
i is the number of minor alleles at the causal locusr¼1;2: We generated the ith individual’s environmental covariate, XEi; from a Nð0;6Þ distribution and set g0¼22:5; gE¼ logð1:5Þ ¼0:4055:As in the RV simulations, we considered case–control sampling (with 750 cases and 750 controls) and random sampling (with sample size 1500 and prevalence rate 0.3).
In the type I error analysis, we setgGE¼g1G¼g2G¼0 for the joint test. For theG3Etest, we setgGE¼0 and consid-ered g1
G¼g2G¼0 and g1G¼g2G¼1=23logð1:2Þ ¼0:0912: We considered five pairs of causal SNPs (i.e.,gr
G.0) with different MAFs as shown in Table 3. We performed 1000 replicates per scenario. In the power analysis, we set g1
G¼ g2G¼1=23logð1:2Þ ¼0:0912 and g1GE ¼g2GE¼1=23 logð1:055Þ ¼0:0268 for both theG3Etest and the joint test. We considered all possible pairs of causal SNPs for a total of
29 2
¼406 scenarios. We performed 100 replicates per
sce-nario. To mimic the typical CV analysis, we excluded the 2 causal SNPs and analyzed the other 27 SNPs only in the association tests. For SimReg, we set the locus-specific weight wm¼1:We compared the proposed SimReg method to GESAT and the single-SNP minimumP-value method (referred to as min-P). For the min-P method, we fitted the model logitP ðYi¼1Xi;GÞ ¼d0þXEidEþGmi dGþGmi XEidGE for each SNP m to obtain the P-values of the G3E test (i.e., testing H0:
dGE¼0) and the joint test (i.e., testing H0:dGE¼dG¼0). For a given test (e.g., theG3Etest), we took the minimum of the 27G3E P-values and calculated the adjustedP-value as 12f12min P-valuegkeff, wherek
effis the effective number of
independent tests obtained using the method of Moskvina and Schmidt (2008).
Results and Discussion Simulation studies
Results of type I error analyses (Table 1, Table 2, and Table 3):The type I errors for theG3Etest and the joint test are shown in Table 1 and Table 2 for RV simulations and Table 3 for CV simulations. From Table 1, we see that SimReg can have conservative type I errors when usingP= 100%, which can be alleviated by using P = 99%. Table 2 shows that SimReg, burden-based, and GESAT methods all have type I error rates around the nominal level in RV analyses. Table 3 shows that SimReg, min-P, and GESAT all have type I error rates around the nominal level in the CV analyses.
Results of RV power analyses (Figure 1):The power results
for a main-effect group PAR (aGÞof 0.02 and aG3Egroup PAR (aGE) of 0.1 are shown in Figure 1. For the G3E tests and the joint tests, SimReg has higher power than the burden-based test and GESAT (G3Etest only) across different numbers of causal SNPs and different study designs. GESAT
Table 1 Type I error rates of SimReg tests withvs.without low-rank approximation in rare-variant (RV) simulations
% variance retained inSG(denoted byp) Case–control sampling Random sampling
Joint testðaG;aGEÞ ¼ ð0;0Þ
p= 100% 0.052 (0.0070)a 0.025(0.0049)
p= 99% 0.052 (0.0070) 0.052 (0.0070)
G3EtestðaG;aGEÞ ¼ ð0;0Þ
p= 100% 0.036(0.0059) 0.024(0.0048)
p= 99% 0.047 (0.0067) 0.043 (0.0064)
G3EtestðaG;aGEÞ ¼ ð0:02;0Þ
p= 99% with 20 causalGSNPs 0.064 (0.0077) 0.046 (0.0066)
p= 99% with 40 causalGSNPs 0.049 (0.0068) 0.046 (0.0066)
p= 99% with 60 causalGSNPs 0.045 (0.0066) 0.043 (0.0064)
p= 99% with 80 causalGSNPs 0.050 (0.0069) 0.042 (0.0063)
p= 99% with 100 causalGSNPs 0.041 (0.0063) 0.045 (0.0066)
The corresponding standard errors (SEs) are shown in parentheses. The values in italics are those whose 95% confidence intervals (i.e., rate61:963SE) fall below the nominal level. The results are based on 1000 replications.aGandaGEare the group PARs of the genetic main effect and theG3Eeffect, respectively.
has the lowest power for theG3Etest. Because we assumed a linearG3Eeffect in the simulation, the power loss may be attributable to the unweighted similarity (i.e., wm¼1Þ; which resulted in an overall similarity score dominated by less-frequent over rare variants and led to little variations among individual pairs.
We note that for both the SimReg and burden-based tests, the power of the joint test is slightly less than the power of theG3Etest. It is likely that this is caused by the weak main-effect signal in the simulation: the majority of the simulated data sets had significantG3Eeffects but neg-ligible genetic main effects. Consequently, compared to the G3Etest statistic, the joint test statistic may have incorpo-rated additional noise from the G test statistic, which can result in power loss. We also observe that the power loss in the joint test appears to be larger for SimReg than for the burden-based tests because the degrees of freedom (d.f.) of a SimReg test spent on the Geffect tend to be higher than those of a burden-based test. However, the power of SimReg is still higher than that of the burden-based test, and the additional d.f. consumed by SimReg (compared to the burden-based test) ensure robustness against between-locus etio-logical heterogeneities (Pongpanich et al.2012) as well as against model misspecifications.
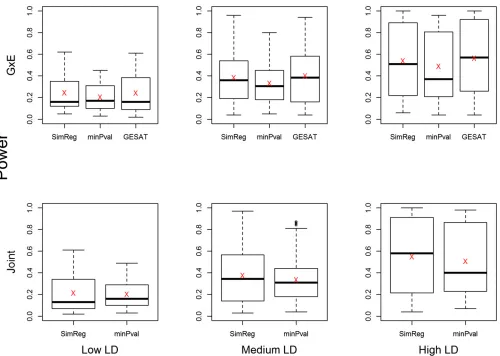
Results of CV power analyses (Figure 2): To present the
power results of the
29 2
¼406 scenarios, we grouped the
scenarios into three categories based on the LD structure between the causal SNPs and the analyzed SNPs. The three LD groups, i.e., the lower one-third (low LD), the middle one-third (medium LD), and the top one-third (high LD), are defined based on the average of 54 R2 values, where
each value is theR2 between a causal SNP (2 in total) and
an analyzed SNP (27 in total). We present side-by-side box-plots of the power of SimReg, min-P, and GESAT (forG3E tests) as well as the mean power value in Figure 2. We observe that when the LD is lower, the power of all methods is lower. This is expected because under low-LD scenarios the markers contain less information about the 2 causal loci. For theG3Etest (Figure 2, top), SimReg and GESAT have very similar power, as expected because both methods set wm¼1:The powers of SimReg and min-Pare similar when LD is low. As the LD increases, SimReg starts to have power improvement over min-P. The difference becomes more ob-vious when LD is high. For the joint test (Figure 2, bottom), the relative power of SimRegvs.min-Pis similar to what was observed for the G3Etests. Furthermore, the relative per-formance between SimReg and min-P for binary traits is similar to what was observed for quantitative traits (Tzeng et al.2011).
Data Applications
Analysis of gene-by-physical activity effect on obesity,
using CoLaus samples: We used Sanger sequence data of
thePLA2G7gene for 1961 subjects from the CoLaus (Song
et al.2012) and studied PLA2G7’s association with the levels of lipoprotein-associated phospholipase A2 (Lp-PLA2). The CoLaus study of Firmannet al.(2008) is a population-based study to assess the risk factors of cardiovascular disease (CVD) in Caucasian residents of Lausanne, Switzerland aged 35–75 years. PLA2G7 encodes Lp-PLA2, and the elevated plasma levels of Lp-PLA2 activity have been shown to be associated with increased risk of coronary heart disease (Thompsonet al.2010). We imputed sporadic missing geno-types, using the MaCH software package (Li et al. 2010), and obtained a total of 100 SNPs with MAF ,0.05 (range from 0.000255 to 0.029).
The genetic influence of PLA2G7 on the body mass af-fected by exercise has been reported in the literature (Wootton et al. 2007; Detopoulou et al. 2009). The potential modu-lating effect of PLA2G7 on arachidonic acid was hypothe-sized to be related to the association between the PLA2G7 variants and a reduced risk of coronary artery disease (Ninio et al.2004; Woottonet al.2007). UsingPLA2G7as a positive control, we investigated the potential interaction between physical activity and genetic variants on BMI. We defined obesity as BMI .30 and evaluated the effects of PLA2G7 (G), physical activity (E), andG3Einteractions on obesity. We considered three methods: SimReg, GESAT, and the burden-based test. In all analyses, we adjusted for age, sex, ethnic background (five PCs), smoking status, and alcohol consump-tion. For SimReg, we used weightwm¼ ð12qmÞ24and a low-rank approximation with p¼0:99;the resultingP-values of the joint test and the G3E test were 1:4631023 and 1:05 3
1023; respectively, which suggested that PLA2G7 may affect
the influence of physical activity on obesity. GESAT, which set
Table 2 Type I error rates of the G3Etest and the joint test for rare-variant (RV) simulations
Nominal level SimRega Burden-based GESAT
Joint testðaG;aGEÞ ¼ ð0;0Þ
0.05 0.0504 (0.0022)b 0.0511 (0.0022) NA
0.01 0.0093 (0.0010) 0.0110 (0.0010) NA
0.005 0.0047 (0.0007) 0.0056 (0.0007) NA
0.001 0.0010 (0.0003) 0.0011 (0.0003) NA
G3EtestðaG;aGEÞ ¼ ð0;0Þ
0.05 0.0496 (0.0022) 0.0523 (0.0022) 0.05090(0.0024) 0.01 0.0085 (0.0009) 0.0104 (0.0010) 0.0119 (0.0011) 0.005 0.0038(0.0006) 0.0044 (0.0007) 0.0050 (0.0007) 0.001 0.0007 (0.0026) 0.0008 (0.0003) 0.0007 (0.0003)
G3EtestðaG;aGEÞ ¼ ð0:02;0Þc
0.05 0.0473 (0.0021) 0.0482 (0.0021) 0.0602(0.0024) 0.01 0.0099 (0.0010) 0.0112 (0.0011) 0.0119 (0.0011) 0.005 0.0052 (0.0007) 0.0055 (0.0007) 0.0062 (0.0008) 0.001 0.0014 (0.0004) 0.0010 (0.0003) 0.0009 (0.0003)
Data were generated using a case–control design. The corresponding standard errors (SEs) are shown in parentheses. The values in italics/boldface type are those whose 95% confidence intervals (i.e., rate 61.96 3SE) fall below/above the nominal level.aGandaGEare the group PARs of the genetic main effect and the G3Eeffect, respectively. The results were obtained based on 10,000 replications.
aUsingp(the proportion of variation explained by the leading eigenvalues inS
G) = 0:99:
wm¼1;yielded aG3E P-value of 0.637. These results are not unexpected given the simulation results; i.e., the unweighted similarity scores did not have power to detect rare variants be-cause the contribution from rarer variants may be overwhelmed by the less rare variants during collapsing. TheP-values of the burden-based tests were 0.013 for the joint test and 3:8431023
for theG3Etest, which are larger than SimRegP-values but give the same significant conclusions as SimReg. The results agree with the observation from the RV simulations that the proposed method is more powerful in detectingG3Eeffects.
Analysis of TCF7L2-by-BMI effect on type 2 diabetes, using
WTCCC samples: The data were obtained from the type 2
diabetes (T2D) case–control study conducted by the WTCCC (Wellcome Trust Case Control Consortium 2007). The con-trols were samples from the 1958 British Birth Cohort. The case samples were collected from various sites across the United Kingdom to be comparable to the controls. The geno-typing was conducted on an Affymetrix 500K chip. Previous genome-wide association studies (Timpsonet al.2009) have indicated an interaction between TCF7L2 and BMI on T2D. Treating this TCF7L23BMI effect on T2D as a true positive, we evaluated the performance of the proposed SimReg test (with weightwm¼1) and compared to GESAT and the min-Ptest.
Wefitted a model where the response variable is the T2D status and the explanatory variables include the 29 SNPs in TCF7L2, BMI, TCF7L23BMI, and sex. After applying sample and SNP quality controlfilters to remove substantial missing data, the data set contained 1913 cases and 1455 controls. We first performed the joint test and obtained a P-value of 1:81310210for SimReg and 1:3931029for min-P. The
gene-levelP-value of min-Pis obtained as 12ð12 min
1#ℓ#29P-valℓÞ Keff;
where Keff¼19:8 is the effective number of independent
tests for TCF7L2 estimated by Moskvina and Schmidt (2008). TheP-values of the G3Etests are 4:0531025 for
SimReg, 6:7431026for GESAT, and 2:7231023 for min-P
(adjusted P-value). The difference between SimReg and GESAT P-values can be attributed to the different choices of kernels (e.g., IBS kernel for SimRegvs. linear kernel for GESAT) and the different algorithm to estimate the nuisance main effects (e.g., EM algorithmvs.ridge penalization). The
relatively largeP-values of min-Psuggest that there may be multiple moderate-effect loci in TCF7L2 contributing to the T2D risk, as opposed to a few strong-effect loci. The magni-tude of theP-value difference in the joint tests was relatively small compared to theP-value difference inG3Etests, sug-gesting a strong main effect of TCF7L2 on T2D as shown in the literature (Helgasonet al.2007; Scottet al.2007).
Conclusion
In this article we proposed a marker-set method based on similarity regression to examineG3Eeffects for binary traits and showed it is computationally feasible, powerful, and applicable to both common and rare variants. By demon-strating the equivalence of our gene-similarity regression model to a GLMM framework, we showed that SimReg is ro-bust against model misspecification, like other random-effects-based approaches (e.g., Linet al.2013). However, because the structure ofSGEis atypical, one cannot apply the general score test of GLMM as implemented in existing statistical software because it often yields invalid estimates of tG (e.g., negative values). We developed an EM algorithm to ad-dress the challenges associated with estimation and compu-tation encountered in GLMM modelfitting. The C code that implements the proposed joint andG3Etests is available at
http://www4.stat.ncsu.edu/~jytzeng/software_simreg.php.
We demonstrated the utility of SimReg in rare variantG3E analysis. We also found that for RVs, the low-rank approxi-mation to the main-effect similarity matrix (SG) is necessary to avoid an overconservative type I error rate.
One possible strategy to apply the proposed SimReg tests is to start with a joint test to detect the overall association induced by theGmain effect or theG3Eeffects. A screening by joint tests may lead to increasedflexibility and power to detect a signal because some genes can exhibit negligible marginal effects but strong effects among particular expo-sure groups (Kraft et al. 2007; Thomas 2010). If the joint test is rejected, a G3E test can then be used to identify whether the effects of the genetic variables are modified by the environmental variables.
One can view the SimReg framework as an implementa-tion of a class of models for modeling hGE;which includes GESAT as a special case. In SimReg, one can determine how
Table 3 Type I error rates of theG3Etest and the joint test for common-variant (CV) simulations
Effect size considered MAFs of the causal SNPs SimReg min-P GESAT
Joint testðgrG¼gGEr ¼0Þ NA 0.044 (0.0065)a 0.060 (0.0075) NA
G3EtestðgrGE¼0Þ
grG¼0 NA 0.037(0.0060) 0.054 (0.0072) 0.036(0.0059)
grG¼0:0912 0.009, 0.094 0.042 (0.0068) 0.040 (0.0062) 0.053 (0.0071)
grG¼0:0912 0.009, 0.1966 0.040 (0.0062) 0.043 (0.0064) 0.055 (0.0072)
grG¼0:0912 0.094, 0.1966 0.040 (0.0062) 0.045 (0.0066) 0.070(0.0081)
grG¼0:0912 0.1966, 0.2222 0.047 (0.0067) 0.044 (0.0065) 0.051 (0.0070)
grG¼0:0912 0.2991, 0.4188 0.049 (0.0068) 0.050 (0.0069) 0.054 (0.0072)
The corresponding standard errors (SEs) are shown in parentheses. The values in italics/boldface type are those whose 95% confidence intervals (i.e., rate61.963SE) fall below/above the nominal level. The results were obtained based on 1000 replications, andgrGandgrGEare the effect sizes of the causal SNPs for the main effect and theG3E effect, respectively.
theG3Eeffect is modeled by specifying a certain similarity metric,e.g., linear kernel, IBS kernel, or quadratic kernel, as well as by imposing variant-specific weights when collapsing the information across markers. If a linear kernel is used with wm¼1;the SimRegG3Etest is equivalent to GESAT. However, one subtle difference is that SimReg uses an EM algorithm to estimate the nuisance main effects, whereas GESAT uses a penalized method. Another remark concerns the role of the variant-specific weight based on MAFs. As we observed in the numerical studies, although the unweighted similarity performed satisfactorily in CV analyses, it has little power in RV analyses. This is because the sum of un-weighted similarity scores would be dominated by informa-tion from nonrare events. Consequently, when rare variants are studied, the multimarker similarity scores would exhibit little variation. The MAF-based weights in essence perform a soft thresholding to downweight or diminish the contribu-tion of less-frequent or common variants in the multimarker similarity score.
The rationale of a collapsing analysis is to detect the amplified effects of rare variants in aggregate. Experience from main-effect testing suggests that variance component-based tests such as SimReg would have better power than burden-based tests if genetic effects vary radically across variants or if
many null variants exist in the set (Pongpanichet al.2012; Lee et al.2014). However, the presence of many null variants can still unfavorably affect the test performance. For main-effect collapsing tests, efforts have been made to boost power when the signal sparsity is low by adaptively focusing on the subsets enriched with causal variants (e.g., Barnett 2014; Pan et al. 2014). Their extensions toG3Etests will be helpful to further optimize the power to detectG3Eeffects.
In this work we focused on examining the G3E interac-tion effect for a single environmental factor. However, a sim-ilar model involving multiple G3Einteraction effects could be fitted. This method could be easily extended to test for gene–gene interaction in cases where one gene is suspected to interplay with other genes.
Acknowledgments
The authors are grateful to Mark McCarthy, Timothy Frayling, William Rayner, and members of the Warren 2 Consortium for providing the BMI data. This work makes use of data generated by the Wellcome Trust Case Control Consortium (WTCCC). A full list of the investigators who contributed to the generation of the data is available fromhttp://www.wtccc. org.uk. The authors are also grateful to Peter Vollenweider
and Gerard Waeber, Principal Investigators of the CoLaus study, and Meg Ehm and Matthew Nelson, collaborators at GlaxoSmithKline, for providing the CoLaus phenotype and se-quence data. The authors thank Michael Wu for helping with the COSI simulation design and thank Shannon Holloway for her constructive input to improve the manuscript. The CoLaus study is supported by research grants from GlaxoSmithKline, the Faculty of Biology and Medicine of Lausanne, Switzerland, and by the Swiss National Science Foundation grants 33CSCO-122661 and 33CS30-139468. This work was partially supported by National Institutes of Health grants R01 MH084022 (to G.Z., D.Z., and J.-Y.T.), T32GM081057 (to R.M.), R01 CA85848-12 (to D.Z.), and P01 CA142538 (to J.-Y.T.).
Literature Cited
Barnett, I. J., 2014 SNP-set tests for sequencing and genome-wide association studies. Ph.D. Dissertation, Harvard University, Cambridge, MA. Available at:http://nrs.harvard.edu/urn-3: HUL.InstRepos:12274530
Beckmann, L., C. Fischer, M. Obreiter, M. Rabes, and J. Chang-Claude, 2005 Haplotype-sharing analysis using Mantel sta-tistics for combined genetic effects. BMC Genet. 6(Suppl. 1): S70.
Cai, T., G. Tonini, and X. Lin, 2011 Kernel machine approach to testing the significance of multiple genetic markers for risk pre-diction. Biometrics 67: 975–986.
Chatterjee, N., Z. Kalaylioglu, R. Moslehi, U. Peters, and S. Wacholder, 2006 Powerful multilocus tests of genetic association in the presence of gene-gene and gene-environment interactions. Am. J. Hum. Genet. 79(6): 1002–1016.
Dai, J. Y., B. A. Logsdon, Y. Huang, L. Hsu, A. P. Reiner et al., 2012 Simultaneously testing for marginal genetic association and gene-environment interaction. Am. J. Epidemiol. 176(2): 164–173.
Detopoulou, P., T. Nomikos, E. Fragopoulou, D. B. Panagiotakos, C. Pitsavoset al., 2009 Lipoprotein-associated phospholipase A2 (Lp-PLA2) activity, platelet-activating factor acetylhydro-lase (PAF-AH) in leukocytes and body composition in healthy adults. Lipids Health Dis. 8: 19.
Duchesne, P., and P. Lafaye De Micheaux, 2010 Computing the distribution of quadratic forms: further comparisons between the Liu-Tang-Zhang approximation and exact methods. Comput. Stat. Data Anal. 54(4): 858–862.
Figure 2 Power ofG3Eand joint tests for common-variant simulations. The side-by-side boxplots show the powers of the proposed SimReg method,
the minimumP-value method, and GESAT. A total of
29 2
¼406 scenarios were considered (i.e., letting each SNP pair of the 29 SNPs be causal), with
Elston, R., C. S. Buxbaum, K. B. Jacobs, and J. M. Olson, 2000 Haseman and Elston revisited. Genet. Epidemiol. 19: 1–17. Fan, R., and S. H. Lo, 2013 A robust model-free approach for rare variants association studies incorporating gene and gene-environmental interactions. PLoS ONE 8(12): e83057. Firmann, M., V. Mayor, P. Vidal, M. Bochud, A. Pecoud et al.,
2008 The CoLaus study: a population-based study to investi-gate the epidemiology and genetic determinants of cardiovascu-lar risk factors and metabolic syndrome. BMC Cardiovasc. Disord. 8(1): 6.
Haseman, J. K., and R. C. Elston, 1972 The investigation of link-age between a quantitative trait and a marker locus. Behav. Genet. 2(1): 3–19.
Helgason, A., S. Pálsson, G. Thorleifsson, S. F. A. Grant, V. Emilsson
et al., 2007 Refining the impact of TCF7L2gene variants on type 2 diabetes and adaptive evolution. Nat. Genet. 39: 218– 225.
Jiao, S., L. Hsu, S. Bézieau, H. Brenner, A. T. Chan et al., 2013 SBERIA: set based gene environment interaction test for rare and common variants in complex diseases. Genet. Epi-demiol. 37: 452–464.
Kraft, P., Y. C. Yen, D. O. Stram, J. Morrison, and W. J. Gauderman, 2007 Exploiting gene-environment interaction to detect ge-netic associations. Hum. Hered. 63(2): 111–119.
Li, Y., C. J. Willer, J. Ding, P. Scheet, and G. R. Abecasis, 2010 MaCH: using sequence and genotype data to estimate haplotypes and unobserved genotypes. Genet. Epidemiol. 34(8): 816–834.
Lin, X., S. Lee, D. C. Christiani, and X. Lin, 2013 Test for inter-actions between a genetic marker set and environment in gen-eralized linear models. Biostatistics 14: 667–681.
Lee, S., G. R. Abecasis, M. Boehnke, and X. Lin, 2014 Rare-variant association analysis: study designs and statistical tests. Am. J. Hum. Genet. 95: 5–23.
Madsen, B. E., and S. R. Browning, 2009 A groupwise association test for rare mutations using a weighted sum statistic. PLoS Genet. 5: e1000384.
Miao, H., 2009 Model selection and estimation in additive regres-sion models. Ph.D. Dissertation, North Carolina State University, Raleigh, NC.
Manolio, T. A., F. S. Collins, N. J. Cox, D. B. Goldstein, L. A. Hindorff
et al., 2009 Finding the missing heritability of complex diseases. Nature 461: 747–753.
Mechanic, L. E., H.-S. Chen, C. I. Amos, N. Chatterjee, N. J. Cox
et al., 2012 Next generation analytic tools for large scale ge-netic epidemiology studies of complex diseases. Genet. Epide-miol. 36: 22–35.
Moskvina, V., and K. M. Schmidt, 2008 On multiple-testing cor-rection in genome-wide association studies. Genet. Epidemiol. 32: 567–573.
Mukherjee, B., and N. Chatterjee, 2008 Exploiting gene-environment independence for analysis of case-control studies: an empirical Bayes-type shrinkage estimator to trade-off between bias and efficiency. Biometrics. 64:685–94.
Murcray, C. E., J. P. Lewinger, and W. J. Gauderman, 2009 Gene-environment interaction in genome-wide association studies. Am. J. Epidemiol. 169(2): 219–226.
Ninio, E., D. Tregouet, J. L. Carrier, D. Stengel, C. Bickel et al., 2004 Platelet-activating factor-acetylhydrolase (PAF-AH) and PAF-receptor gene haplotypes in relation to future cardiovascu-lar events in patients with coronary artery disease. Hum. Mol. Genet. 13(13): 1341–1351.
Pan, W., J. Kim, Y. Zhang, X. Shen, and P. Wei, 2014 A powerful and adaptive association test for rare variants. Genetics 197: 1081–1095.
Price, A. L., G. V. Kryukov, P. I. W. de Bakker, S. M. Purcell, J. Staples et al., 2010 Pooled association tests for rare
var-iants in exon-resequencing studies. Am. J. Hum. Genet. 86(6): 832–838.
Pongpanich, M., M. L. Neely, and J.-Y. Tzeng, 2012 On the aggre-gation of multimarker information for marker-set and sequenc-ing data analysis: genotype collapssequenc-ing vs.similarity collapsing. Front. Genet. 2: 1–14.
Schaffner, S. F., C. Foo, S. Gabriel, D. Reich, M. J. Daly et al., 2005 Calibrating a coalescent simulation of human genome sequence variation. Genome Res. 15(11): 1576–1583. Schaid, D. J., 2010a Genomic similarity and kernel methods I:
advancements by building on mathematical and statistical foun-dations. Hum. Hered. 70(2): 109–131.
Schaid, D. J., 2010b Genomic similarity and kernel methods II: genomic information. Hum. Hered. 70(2): 132–140.
Scott, L. J., K. L. Mohlke, L. L. Bonnycastle, C. J. Willer, Y. Liet al., 2007 A genome-wide association study of type 2 diabetes in Finns detects multiple susceptibility variants. Science 316: 1341–1345.
Sham, P., and S. Cherny, 2011 Analysis of Complex Disease Asso-ciation Studies [Electronic Re-Source]: A Practical Guide. Aca-demic Press/Elsevier, London/Burlington, MA.
Sohns, M., E. Viktorova, C. I. Amos, and P. Brennan, G. Fehringer
et al., 2013 Empirical hierarchical Bayes approach to gene– environment interactions: development and application to genome–wide association studies of lung cancer in TRICL. Genet. Epidemiol. 37: 551–559.
Song, K., M. R. Nelson, J. Aponte, E. S. Manas, S. A. Bacanuet al., 2012 Sequencing of Lp-PLA2-encodingPLA2G7gene in 2000 Europeans reveals several rare loss-of-function mutations. Phar-macogenomics J. 12(5): 425–431.
Thomas, D., 2010 Methods for investigating gene-environment interactions in candidate pathway and genome-wide association studies. Annu. Rev. Public Health 31: 21–36.
Thomas, D., 2011 Response to ‘Gene-by-environment experi-ments: a new approach to finding the missing heritability’by Van Ijzendoornet al.Nat. Rev. Genet. 12(12): 881.
Thompson, A., P. Gao, L. Orfei, S. Watson, A. E. Di et al., 2010 Lipoprotein-associated phospholipase A2 and risk of cor-onary disease, stroke, and mortality: collaborative analysis of 32 prospective studies. Lancet 375: 1536–1544.
Timpson, N. J., C. M. Lindgren, M. N. Weedon, J. Randall, W. H. Ouwehandet al., 2009 Adiposity-related heterogeneity in pat-terns of type 2 diabetes susceptibility observed in genome-wide association data. Diabetes 58: 505–510.
Tzeng, J.-Y., B. Devlin, L. Wasserman, and K. Roeder, 2003 On the identification of disease mutations by the analysis of haplotype similarity and goodness offit. Am. J. Hum. Genet. 72(4): 891– 902.
Tzeng, J.-Y., and D. Zhang, 2007 Haplotype-based association analysis via variance component score test. Am. J. Hum. Genet. 81: 927–938.
Tzeng, J.-Y., D. Zhang, S.-M. Chang, D. C. Thomas, and M. Davidian, 2009 Gene-trait similarity regression for multimarker-based association analysis. Biometrics 65: 822–832.
Tzeng, J.-Y., D. Zhang, M. Pongpanich, C. Smith, M. I. McCarthy
et al., 2011 Studying gene and gene-environment effects of uncommon and common variants on continuous traits: a marker-set approach using gene-trait similarity regression. Am. J. Hum. Genet. 89(2): 277–288.
van Os, J., and B. Rutten, 2009 Gene-environment-wide interac-tion studies in psychiatry. Am. J. Psychiatry 166(9): 964–966. Voorman, A., T. Lumley, B. McKnight, and K. Rice, 2011 Behavior
of qq-plots and genomic control in studies of gene-environment interaction. PLoS ONE 6: e19416.
Wang, X., N. J. Morris, X. Zhu, and R. C. Elston, 2013 A variance component based multi-marker association test using family and unrelated data. BMC Genet. 14(1): 1–8.
Wellcome Trust Case Control Consortium, 2007 Genome-wide association study of 14,000 cases of seven common diseases and 3,000 shared controls. Nature 447: 661–678.
Wessel, J., and N. J. Schork, 2006 Generalized genomic distance-based regression methodology for multilocus association analy-sis. Am. J. Hum. Genet. 79: 792–806.
Winham, S. J., and J. M. Biernacka, 2013 Gene–environment inter-actions in genome–wide association studies: current approaches and new directions. J. Child Psychol. Psychiatry 54(10): 1120–1134. Wootton, P. T., D. M. Flavell, H. E. Montgomery, M. World,
S. E. Humphrieset al., 2007 Lipoprotein-associated phospholipase
A2 A379V variant is associated with body composition changes in response to exercise training. Nutr. Metab. Cardiovasc. Dis. 17(1): 24–31.
Wu, M. C., P. Kraft, M. P. Epstein, D. M. Taylor, S. J. Chanocket al., 2010 Powerful SNP-set analysis for case-control genome-wide association studies. Am. J. Hum. Genet. 86: 929–942.
Wu, M. C., S. Lee, T. Cai, Y. Li, M. Boehnke et al., 2011 Rare variant association testing for sequencing data using the se-quence kernel association test (skat). Am. J. Hum. Genet. 89: 82–93.
Zhang, D., and X. Lin, 2003 Hypothesis testing in semiparametric addictive mixed models. Biostatistics 4: 57–74.
Appendix A: Marginal Trait Covariance cov(Yi;Yj)
Definehi¼hGiþhGE i:Under GLMM (2),
covYi;Yj
¼covh
EðYiX;hÞ;EðYjX;hÞþEh
covðYi;YjX;hÞ
¼covhEðYiX;hÞ;EðYjX;hÞ
ð∵conditional independence ofYiandYjÞ
¼covhg21ðXigþhiÞ;g21Xjgþhj
covh
8
>
>
>
>
<
>
>
>
>
:
"g21ðXigþEhiÞ þ "
@g21ðX
igþhiÞ @hi
hi¼Ehi
#
ðhi2EhiÞ
#
;
"
g21X
jgþEhj
þ
"
@g21Xjgþhj @hj
hj¼Ehj
#
hj2EhjÞ
#
9
>
>
>
>
=
>
>
>
>
;
[by taking thefirst-order Taylor expansion ofg21ðX
igþhiÞwith respect tohiaroundEhi¼0]
¼covh
n
"g21ðXigÞ þ
"
@g21ðXigþhiÞ @hi
hi¼0
# 3hi
#
;
"
g21Xjgþ
"
@g21Xjgþhj @hj
hj¼0
# 3hj
#
)
¼
"
@g21ðXigþhiÞ @hi
hi¼0
# 3
"
@g21X
jgþhj
@hj
hj¼0
#
3covhi;hj
¼
"
@g21ðX
igþhiÞ @hi
hi¼0
# 3
"
@g21Xjgþhj @hj
hj¼0
#
3covðhGiþhGEi;hGjþhGEjÞ
¼
(
@gðm0iÞ m0i
)21 3
8 < :
@gðm0jÞ m0j
9 = ;
21
3fcovðhGi;hGjÞ þcovðhGEi;hGEjÞg
¼ng9m0ig9
m0j
o21
3tGSijþtGEXEiXEjSij;
Appendix B: EM Algorithm to Estimate tG andsin the SimRegG3ETest
Under the null hypothesisHGE
0 :tGE¼0, model (3) becomesgðmÞ ¼XgþZGbwithbNð0;tGIL3L Þ:LetY¼ ðY1;. . .;YnÞbe the vector of binary traits, and letu¼ ðg;tGÞbe the parameter vector. We consider an expectation-maximization algorithm based on observed dataYand missing datab. Let logfðY;b;uÞbe the complete data log-likelihood. In the expectation step (E-step), we computeQðuuðtÞÞ as
QðuuðtÞÞ ¼E
n
logfðY;b;uÞY;uðtÞ
o
¼E
n
logfðYb;uÞY;uðtÞ
o
þE
n
logfðb;uÞY;uðtÞ
o
;
E
n
log fðYjb;uÞjY;uðtÞ
o
¼X
n
i¼1
E
n
Yi log miþ ð12YiÞlogð12miÞjY;uðtÞ
o
: (B1)
For the second term, note that
logfðb;uÞ ¼logfðb;tGÞ
¼log ð2pÞ2ðL=2ÞtGIL2ð1=2Þexp 21 2b
TðtGILÞ21
b
¼ 2L
2log 2p2 L
2log tG2 bTb 2tG;
wheretGIL¼tLG:Therefore,
E logfðb;uÞY;uðtÞ
¼E 2L
2log2p2 L
2logtG2 bTb 2tG
! Y;uðtÞ
¼ 2L
2log2p2 L
2logtG2 E
bTbjY;uðtÞ
2tG :
(B2)
By expressing the complete-data log-likelihood in two parts, the fixed effect g occurs only in the first term Eflogf ðYb;uðtÞÞgand variance componenttGoccurs only in the second term,Eflogfðb;uÞY;uðtÞg. Thus, the maximization steps for obtainingtbGðtþ1Þ andg^ðtþ1Þcan be discussed separately.
Maximization step for obtainingctG
(tþ1)
To obtaintbGðtþ1Þ;we can focus on Eflogfðb;uÞY;uðtÞgWe take the derivative of (B2) with respect totGand get
@E
n
logfðb;uÞY;uðtÞ
o
@tG
¼ 2 L
2tG þEðb
TbY;uðtÞÞ
2t2G :
Setting this equal to zero, we get
c
tGðtþ1Þ¼
EðbTbY;uðtÞÞ L
¼1 L
h
bðtÞTbðtÞþtraceSðtÞi:
(B3)
Equation B3 follows becauseðb
j
Y;uðtÞÞ NðbðtÞ;SðtÞÞapproximately. To derive this approximation, wefirst reexpressfðY;bÞ as fðYjbÞfðbÞ;i.e., a product of a Gaussian kernel and some function ofY. Finally, because fðY;bÞ ¼fðbjYÞfðYÞ;we have fðbjYÞ_N:We provide the details in the next subsection.
Derivation off(bjY)as well as its meanb(t)and varianceS(t) fðY;b;uðtÞÞ ¼fðYb;uðtÞÞfðb;uðtÞÞ
¼Y
n
i¼1 (
mYi
i ð12miÞ12Yið2pÞ2ðL=2Þ2t2ð L=2Þ
G exp
2bTb
2tG
)
¼exp
( Xn
i¼1
½Yilogmiþ ð12YiÞlogð12miÞ2 L
2log 2p2 L
2logtG2 bTb 2tG
)
where
hðbÞ ¼X n
i¼1
½Yi log miþ ð12YiÞlogð12miÞ2 L
2log 2p2 L
2logtG2 bTb 2tG:
(B4)
LetbðtÞ be the value that maximizeshðbÞ;i.e.,h9ðbðtÞÞ ¼0:By a Taylor expansion ofhðbÞwith respect tobaroundbðtÞ;we
have
hðbÞ hðbðtÞÞ þh9ðbðtÞÞðb2bðtÞÞ þ1 2ðb2b
ðtÞÞT
h$ðbðtÞÞðb2bðtÞÞ ¼hðbðtÞÞ þ1 2ðb2b
ðtÞÞT
h$ðbðtÞÞðb2bðtÞÞ:
Therefore, the complete data log-likelihood can be approximated by
fðY;b;uðtÞÞ exp hðbðtÞÞ þ1 2ðb2b
ðtÞÞT
h$ðbðtÞÞðb2bðtÞÞ
¼exp hðbðtÞÞ
exp 1 2ðb2b
ðtÞÞT
h$ðbðtÞÞðb2bðtÞÞ
: (B5)
In Equation B5, expf2ð1=2Þðb2bðtÞÞT½2
h$ðbðtÞÞðb2bðtÞÞgis a Gaussian kernel with2h$ðbðtÞÞ ¼ ½SðtÞ21:
Thus, the con-ditional distribution ofðbY;uðtÞÞapproximately follows a multivariate normal distribution with mean vectorbðtÞand variance–
covariance matrixSðtÞ¼ ½2h$ðbðtÞÞ21:
Next we calculate h9ðbÞ andh$ðbÞ:In Equation B4, we rewritemi asmiðbÞto emphasize that it is a function of b; i.e., miðbÞ ¼expðXigþZibÞ=ð1þexpðXigþZibÞÞ with Zið13LÞ; the ith row of matrix ZG: Note that m_iðbÞL31[@miðbÞ=@b¼ ZT
iðexpðXigþZibÞÞ=f1þexpðXigþZibÞg2¼ZTimiðbÞf12miðbÞg:Then
h9ðbÞ ¼@hðbÞ @b ¼
Xn
i¼1 (
Yi3_ miðbÞ miðbÞ
þ ð12YiÞ3 2_ miðbÞ 12miðbÞ
) 2 b
tG
¼X
n
i¼1
(
ZTiYif12miðbÞg2ZTið12YiÞmiðbÞ
)
2 b
tG
¼X
n
i¼1
(
ZTiYi2ZiTmiðbÞ
)
2 b
tG
¼ZTY2ZTmðbÞ2 b tG
¼ZTðY2mðbÞÞ2 b tG;
wheremðbÞ ¼ ðm1ðbÞ;m2ðbÞ; ::: ;mnðbÞÞ T;
and
h$ðbÞ ¼@h9ðbÞ @bT ¼
Xn
i¼1
(
ZTiYi2ZiTm_iðbÞ
)
21
tGIL
¼ 2Pn
i¼1
miðbÞf12miðbÞgZTiZi2 1 tGIL
¼ 2ZTWðbÞZ21 tIL
¼ 2ðZTWðbÞZþ1 tILÞ;
whereWðbÞ ¼diag½miðbÞf12miðbÞg:
Finally, we obtainbðtÞ;i.e., the maximizer ofhðbÞ:First, we rewritebðtÞasb
bðtkþ1Þ¼bð kÞ
t 2½h$ðbð kÞ
t Þ21h9ðb
ðkÞ t Þ ¼b
ðkÞ t þ
ZTW
bðtkÞ
Zþ 1 tGIL
21"
ZT
n
Y2m
bðtkÞ
o 2b
ðkÞ
t tG
#
;
which depends on tG andg, and we settG¼tbGðtÞ andg¼gðtÞ:The maximizer, bðtÞ;is obtained at each iteration until it converges,i.e., until the differencebðtkþ1Þ2b
ðkÞ
t falls below a prespecified threshold,e.g., 1027:We denote the maximizer as bðNÞt and also setbðtÞ¼bðNÞt :
Maximization step for obtainingg^(t+1)
To obtaing^ðtþ1Þ;we focus on thefirst term ofQðuuðtÞÞ;i.e.,
E
n
log fðYjb;uÞjY;uðtÞ
o
¼X
n
i¼1
E
n
Yi log miþ ð12YiÞlogð12miÞjY;uðtÞ
o [dðgÞ:
We rewritemiasmiðgÞhere to emphasize that it is a function ofg;i.e.,miðgÞ ¼expðXigþZibÞ=ð1þexpðXigþZibÞÞ:We have thatm_iðgÞ[@miðgÞ=@g¼XiTðexpðXigþZibÞ=f1þexpðXigþZibÞg2Þ ¼XiTmiðgÞf12miðgÞg. Then
d9ðgÞ ¼@dðgÞ @g ¼
@Pn i¼1E
n
Yilogmiþ ð12YiÞlogð12miÞY;uðtÞ o
@g
¼X
n
i¼1
E
(
XiTYim_iðgÞ miðgÞþX
T ið12YiÞ
2m_iðgÞ 12miðgÞ
)
¼X
n
i¼1
E
(
XiTYif12miðgÞg2XiTð12YiÞmiðgÞ
)
¼Xn i¼1
XiTðYi2miðgÞÞ
¼XTðY2mðgÞÞ;
wherem= (m1(g),m2(g),. . .,mn(g))T=m(b), and
d$ðgÞ ¼@d9ðgÞ @gT ¼
Xn
i¼1
XiTðYi2m_iðgÞÞ ¼ 2X n
i¼1
miðgÞf12miðgÞgXiTXi¼2XTWðgÞX:
Recall thatWðgÞ ¼diagnPni¼1miðgÞf12miðgÞg
o
¼diagnPni¼1miðbÞf12miðbÞg
o
¼WðbÞ:Using thefirst and second deriv-atives ofdðgÞ;the estimator ofgðtþ1Þ;rewritten asgtþ1;at theðkþ1Þth iteration, is given by
gðtþkþ11Þ¼gðtþkÞ12½d$ðgðtþkÞ1Þ21d9ðgðtkþÞ1Þ ¼gðtþkÞ1þ ½XTW
gðtþkÞ1
X21XT
Y2m
gðtþkÞ1
;
which depends ontGandb. We settG¼tbGðtÞandb¼bðtÞ:Thengðtþ1Þ¼gðNÞtþ1:
Putting it all together, at iterationtþ1 we have following estimators:
b
tGðtþ1Þ¼ 2ð1=rÞ½bðtÞTbðtÞþtraceðSðtÞÞ; where bðtÞ¼bðNÞt and bð kþ1Þ
t ¼bð kÞ
t þ ½ZTWðbð kÞ
t ÞZþ ð1=tGÞIL21½ZTðY2mðbð kÞ
t Þ 2bðtkÞ=tG:gðtþ1Þ¼gðNÞtþ1 andg
ðkþ1Þ
tþ1 ¼g
ðkÞ
tþ1þ ½XTmðg
ðkÞ
tþ1ÞX2 1
XTðY2mðgðkÞ
tþ1ÞÞ:
Appendix C: Asymptotic Distributions of the Score Test Statistics
Recall thatTGE¼ ð1=2ÞfðyW1 2X^gÞ T
V21
1 SGEV121ðyW1 2X^gÞg
j
tG¼tGb; tGE¼0 :Becauseg^¼ ðX TV021XÞ21XTV021Y1W;we have
yW
1 2Xg^¼ ½In2XðXTV121XÞ2 1
XTV21
1 ðyW1 2XgÞ ¼K1ðyW1 2XgÞ;
whereK1¼ ½In2XðXTV121XÞ2 1
XTV21
TGE¼1 2 ðy
W
1 2XgÞTK1TV121SGEV121K1ðy1W2XgÞ
¼1 2 ðy
W
1 2XgÞTV2 1=2 1 V
1=2
1 KT1V121SGEV121K1V11=2V2 1=2
1 ðyW1 2XgÞ
¼1 2
f
yW
1
T A1 yfW1
;
(C1)
where yfW 1 ¼V
21=2 1 ðy
W
1 2XgÞ; and A1¼V 1=2 1 K
T 1V2
1
1 SGEV121K1V 1=2
1 : In addition, the working vector y W
1 has mean Xg and
variance V1 (Zhang and Lin 2003), and thusyfW1 has mean 0 and varianceIn3n:
Leth1i;i¼1;. . .;L;denote the nonzero eigenvalues of matrixA1and letn1i denote the corresponding eigenvectors. Then, TGE¼SLi¼1hi1ðn1iTyfW1 Þ
2¼SL i¼1h1iðZiÞ
2;
whereZi_Nð0;1Þ:Therefore,TGEcan be approximated by a weighted sum ofx2 -dis-tributionsSLi¼1hc1ix2ið1Þ:By a similar derivation, the distribution ofTjointcan be approximated bySLi¼1ch0ixi2ð1Þ;where theh0i’s are the nonzero eigenvalues of matrixA0 ¼V01=2K0TV021ðSGþSGEÞV021K0V01=2;with K0 ¼ ½In2XðXTV021XÞ2
1
GENETICS
Supporting Information http://www.genetics.org/lookup/suppl/doi:10.1534/genetics.114.171686/-/DC1
Assessing Gene-Environment Interactions for
Common and Rare Variants with Binary Traits
Using Gene-Trait Similarity Regression
Guolin Zhao, Rachel Marceau, Daowen Zhang, and Jung-Ying Tzeng
File S1
Simulation code and data
Available for download as a .zip file at http://www.genetics.org/lookup/suppl/doi:10.1534/genetics.114.171686/‐/DC1