ISSN (Online) : 2319 - 8753
ISSN (Print) : 2347 - 6710
I
nternationalJ
ournal ofI
nnovativeR
esearch inS
cience,E
ngineering andT
echnologyAn ISO 3297: 2007 Certified Organization, Volume 2, Special Issue 1, December 2013
Proceedings of International Conference on Energy and Environment-2013 (ICEE 2013)
On 12th to 14th December Organized by
Department of Civil Engineering and Mechanical Engineering of Rajiv Gandhi Institute of Technology, Kottayam, Kerala, India
SURFACE ROUGHNESS CHARECTERIZATION
USING INTERFERENCE FRINGE ANALYSIS
Santhosh Kumar S V, Gopa Kumar S
Dept. of Mechanical Engineering, Government Engineering College Bartonhill, Trivandrum, Kerala , India 695035
Dept. of Mechanical Engineering, Government Engineering College Bartonhill, Trivandrum, Kerala , India 695035
ABSTRACT
In this work, a non-contact approach using interference fringes is used for characterizing the surface roughness of diamond polished stainless steel specimens. The interference fringes formed over the surfaces due to the interference of coherent beams can give important details about the surface topography of the material. A fringe intensity curve based parameter developed by plotting the fringe intensity curves at different heights was observed to have a linear relationship with stylus roughness. The value of coefficient of correlation obtained was is 0.71. The average standard deviation of the interference fringe intensity curves were observed to bear a linear relation with the measured stylus roughness with a correlation coefficient of 0.84.The non-contact optical methods used in this work for charactering the surface roughness are cost effective and has an advantage of non contact roughness characterization.
KEYWORDS: Surface roughness, Intensity fringe curve, image processing, machine vision, standard
deviation, roughness parameter
1.INTRODUCTION
The accurate measurement of surface roughness is important for producing standard products. The accurately finished products can reduce the energy losses, mainly due to the frictional resistance between the moving parts and can improve the life of engines and machines. Roughness parameters are, therefore, important in fields like automobiles, manufacturing .The methods based on interferrometric techniques which enable the measurement in terms of the wavelength of light source. When light is made to interfere, it produces a pattern of dark bands, which corresponds to accurate division.
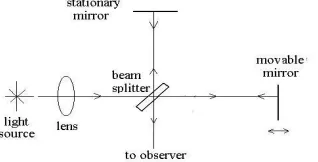
Lieca interference microscope used for experiment is shown in figure1.2.
FIGURE 1.1 SCHEMATIC DIAGRAM OFAN INTERFEROMETER
2. LITERATURE REVIEW
In the field of classification and evaluation of surface properties of materials using non contact methods, so many researcherch papers are available . Among them a few have used non contact approches for measuring surface texture of engineering surfaces. The statistical methods like mean, variance, skewness of the data collected were used for correlating surface properties ( Cohen and Fan 1988). The texture characteristics of a surface after manufacturing were studied using images obtained using image processing techniques.The images can give the details of surface nature and from these details the process parameters can be studied and used for control (Ramamoorthy and Radhakrishnan, 1993). For defining
periodicity of texture of a surface Parkkinen et al, (1990) defined a parameter. Luk et al, (1989) measured
the surface roughness of steel, copper, and brass samples using the statistical methods of intensity histogram and image analysis. The effect of surface roughness on mean value of intensity distribution is explained in this paper. A new optical parameter is defined for measuring surface roughness by using intensity histogram image processing in Kiran et al, (1998).Ulf Person et al (1993) studied the properties of the speckle pattern formed by the interference of coherent beams and used spectral speckle correlation for measurement of roughness. The advantage of this method is that it enables relative measurement of roughness on surface with range Ra = 0.5m-5m using visible light. Analysis and estimation of surface finish of milled and ground has been done by B. Dhanasekhar et al (2008) with the help of image processing. Various correlation functions are used for developing the relation with the roughness of surfaces. Interferometry, Phase shifting and unwrapping techniques are used for surface roughness analysis by B Dhansekhar et al (2008). Five frame phase shift algorithm has been used for assessing the surface roughness of ground surfaces. Halioua.M and HC Liu et al (1989) presented an interferometric phase measuring algorithm for 3D measurement of roughness. G.Lai and T.Yaagai et al (1991) presented a generalized phase shifting algorithm using Fast Fourier Transform EXPERIMENTAL PROCEDURE:
Nine staineless steel specimens were prepeared and polished using various grades of emery sheets and finally mirror like surface finish was obtained in each specimen by diamond polishing method. Each specimens were placed on the space provided on microscope and illuminated. A white light beam of wavelenghth 532 nm is used for lighting the object. Surface having around 1mm x 1mm at exact middle of specimen is selected for experiment .The fringes developed over the surface can be viewed through the eyepiece provided. A CCD camera provided over the microscope grabs the images and sents to the computer connected to it.The digitized images of interference fringes obtained from all nine specimens were grabbed and used for analysis. the fringe images obtained are shown in figure 1.3.
Nine SS specimens used for experiment
FIGURE 1.3.SPECIMENS AND INTERFERENCE FRINGES OBTAINED FROM SPECIMENS
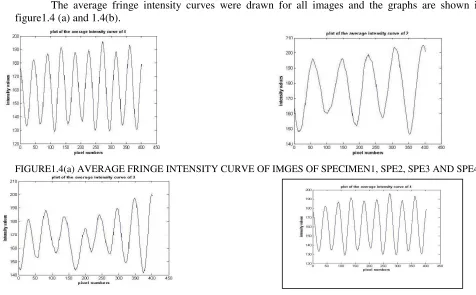
The average fringe intensity curves were drawn for all images and the graphs are shown in figure1.4 (a) and 1.4(b).
FIGURE 1.4 (b) AVERAGE FRINGE INTENSITY CURVES OF IMAGES OF SPECIMEN 5, SPE6,SPE7,SPE8 AND SPE9
3. IMAGE ANALYSIS
Fringe intensity curve of each pixel row represents the gray scale intensity variation along horizontal direction .Y axis of the graph represents grey scale value which varies from 0 (dark) to 255(white) and X axis of the graph represents pixel numbers.At each pixel of image the grey value depends on the amplitude of the interfered light beam falling ,and the amplitude of the light beam is determined by the nature of surface from which it is reflected. Using image analysis techniques the fringe intensity curve of images can be generated and its properties can be correlated with surface roughness of the work specimens.In the reference paper(Sabazalipour et al., 2011 ) the authors have used a pixel shift method for finding out the thickness of a step made on a thin film. The average of x-directional shift (pixel shift) of
peaks between average intensity curves of upper and lower parts is taken as ∆x. If is the wavelength of monochromatic light used and X is the average of x-directional distances between peaks or valleys of intensity curve then thickness of the step is given by the equation:
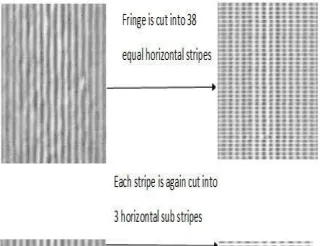
FIGURE 1.5. STEPS FOR CUTTING THE FRINGES
For each specimen, the average of x-directional shift (pixel shift) of peaks between average intensity
curves of horizontal stripes and its sub stripes (∆x) and average of x directional distance between the
crest points (X) are calculated and substitutes in the equation .This value is taken as the roughness parameter based on intensity curve.
roughness parameter(r) = D x
.
l
2
X
The values of intensity curve based roughness parameter and corresponding stylus roughness are given in Table 1.1 and the relationship is shown in figure 1.7.
TABLE 1.1 ROUGHNESS PARAMETER OBTAINED FROM INTENSITY CURVES AND STYLUS ROUGHNESS (Ra)
Ra value Intensity
Specimen obtained from curve based
number stylus roughness
instrument( m) parameter
1 0.045 11.649
2 0.028 09.643
3 0.031 09.315
4 0.056 11.674
5 0.050 11.959
6 0.035 08.817
7 0.053 09.555
8 0.034 08.226
9 0.028 11.665
FIGURE 1.6. TYPICAL FRINGE INTENSITY CURVES FOR MAINSTRIPE AND SUB
FIGURE 1.7. RELATIONSHIP BETWEEN STYLUS ROUGHNESS VALUES AND COMPUTED VALUES
A straight line relationship with coefficient of correlation R=0.71 has been obtained.
4. ANALYSIS USING STANDARD DEVIATION
FIGURE1.8. PART OF FRINGE INTENSITY CURVE SHOWING REGION SELECTED TO FIND STANDARD DEVIATION
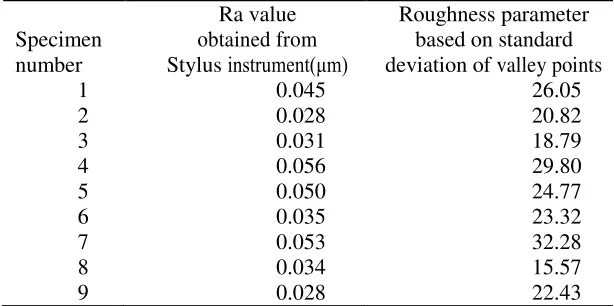
Standard deviation of fringe intensity curve is calculated by selecting the curve region within X as shown in figure1.8. In each specimen there are 8 to 12 regions depending on the fringe width in the image. Standard deviation of each region is calculated and averaged for getting the roughness parameter based on the intensity fringe curve. Same is repeated for all nine specimens and values obtained are compared with stylus roughness which is shown in Table1.2.
TABLE 1.2 Ra VALUES AND STANDARD DEVIATION OF VALLEY POINTS BASED ROUGHNESS PARAMETER
Ra value Roughness parameter
Specimen obtained from based on standard
number Stylus instrument( m) deviation of valley points
FIGURE 1.9 RELATIONSHIPS BETWEEN STYLUS ROUGHNESS AND STANDARD DEVIATIONS VALLEY POINTS
It shows a straight line relationship having coefficient correlation 0.815 between stylus roughness and standard deviations.
A
B
FIGURE 1.10. PART OF FRINGE INTENSITY CURVE SHOWING REGION SELECTED TO FIND STANDARD DEVIATION
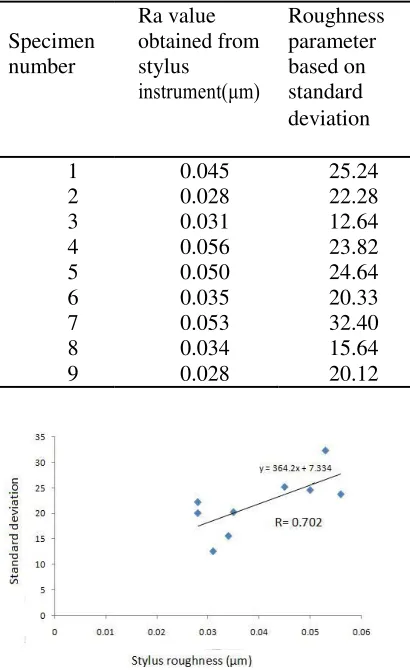
TABLE 1.3 Ra VALUES AND STANDARD DEVIATION BASED ROUGHNESS PARAMETER
Ra value Roughness
Specimen obtained from parameter
number stylus based on
instrument( m) standard deviation
1 0.045 25.24
2 0.028 22.28
3 0.031 12.64
4 0.056 23.82
5 0.050 24.64
6 0.035 20.33
7 0.053 32.40
8 0.034 15.64
9 0.028 20.12
FIGURE1.11. RELATIONSHIPS BETWEEN STYLUS ROUGHNESS AND STANDARD DEVIATIONS
5. CONCLUSION
2. Dhanasekar B, N Krishna Mohan, Basanta Bhaduri and B Ramamoorthy,2008 , Evaluation of surface roughness based on monochromatic
speckle correlation using image processing, PrecisionEngineering, 32, 196-206.
3. Dhanasekar B and B Ramamoorthy ,2008 ,Digital speckle interferometry for assessment of surface roughness, Optics and Lasers
engineering, 46,272-280.
4. Galante G P, M Piacentine and V F Ruisi, 1999, Surface roughness detection by tool imageprocessing, Wear, 148(2), 211-220.
5. Gonzalez, R. and R Woods, DigitalImage Processing, Addison-WesleyPublishing Company, 1992, p 442
6. Kiran M B, B Ramamoorthy and V Radhakrishnan ,1998, Evaluation of surface roughness by vision system, International journal of
machine tools and manufacture, 38, 685-690.
7. Kurita M., M Sato and K Nakano 1992, Technique for rapidly measuring surface roughness using a laser, JSMEInternational journal, 35(3)
,335-339
8. Luk F, V Huynh and W North , 1989, Measurement of surface roughness by machine vision, J.phys.E.Sci.Instrum, 22 , 977-980.
9. Persson U,1992, Real time measurement of surface roughness of ground surfaces using speckle contrast technique, Optics and laser
engineering, 11, 61-67.
10. Ramamoorthy B and V Radhakrishnan , 1993, Statistical approaches to surface texture classification, wear, 167, 155-161.
11. Ramesh S and B Ramamoorthy, 1996, Measurement of surface finish using an optical refraction technique, Wear ,195, 148-151.
12. Sabazalipour A and M H Mohammadizadeh ,2011,Thickness and roughness measurement of thin films by interference, Iranian journal of
physics reasearch,11,15-23.
13. Sprague R A and B J Thompson ,1972, Quantitative visualization of large variation phase objects, Journal ofapplied optics, 11, 1469-1479.
14. Tay C J , S LToh , H M Shankg and J B Zhang,1995, Whole field determination of surface roughness by speckle correlation, Journal of
appliedoptics, 34 ,2324-35.
15. Tamura H and T Yamwaki,1978,Textural features corresponding to visual perpception,
IEEE Trans. Systems,Man Cybem,8(6),460-473.
16. Ulf Persson,1993, Measurement of surface roughness on rough machined surfaces using spectral speckle correlation and image analysis,
Wear, 160,221-225.
17. Windecker R, H J Tiziani, 1999,Optical roughness measurement using extended white light interferometry, Optical engineering,