Frac
Scientific 1 (mksahu@ ABSTRA In componen on two pip circumfer temperatu test. Any for these Subsequen The exper FEA resul INTROD T extracting these pipi operationa pipes are been impo componen credible te by Bhabh pipes and Engineeri Chattopad steel, SA3 reactor te conditions initiated b this progr 300oC. Opening Finite Ele and FEA rFRACTU Test Spec
cture Tes
Officer, Rea @barc.gov.in ACTn order to s nts used in PH
pes of carbon rential part t ure of 300oC.
crack growth pipes is th ntly, three di rimental and lts have been
DUCTION
The piping com g the heat fro
ing componen al loading lik
primary subj ortant criterio nts, Leak Bef est data is req ha Atomic Res d elbows with ing Research dhyay et al.]. 333Gr6. Sinc emperature (≈ s on the integ by BARC in 2 ram, two stra Different exp Displacemen ement Analys results have b
URE TESTIN
cimens
ting and
Temper
M. K. Sahuctor Safety D n)
study the eff HT (Primary H n steel, SA333
through notc Different ex h has not been he NSCL (N
imensional fin FEA results discussed in
mponents are om heat gene nts to steam g ke thermal stre
jected to bend on for smooth
fore Break (L quired. To ad search Centre h and withou
Centre (SER The material ce the pipes
≈300oC) unde grity of pipin 2004. Under t aight pipes h perimental re nt (CMOD), e sis (FEA) hav been compare
NG OF PIPE
Analyse
rature un
u1, J. ChattopDivision, Bhab
fect of high Heat Transpo 3Gr6. Two pi ch, have bee xperimental re n detected till Net Section C
nite element have been co the light of p
e an integral p eration unit b generators for esses, interna ding moment h running of p LBB) criterio
ddress these i e (BARC), Ind ut cracks, had RC), CSIR (C
l of PHT (Pri are subjected er plant oper ng component
this program, have been tes esults like tot etc were mon ve been perfo ed.
ES
s of Pipin
nder Ben
padhyay, B.K
bha Atomic R
temperature ort) piping of
ipes of nomin en tested un esults have b l last loading Collapse Loa analyses (FE ompared. The prevalent temp
part of all typ by coolants. T
r steam produ al pressure an t and its integ power plants. on is a well e
issues, a Com dia in 1998. U d been tested Council of Sc
mary Heat Tr d to internal
ation conditi ts, an Advanc , few straight sted under b tal load, Loa nitored and r ormed to sim
ng Comp
ding Mo
K. Dutta, K. KResearch Cent
on the frac Indian PHWR nal diameters nder monoto been recorded point. Hence ad Criterion) EA) have been
e present diff perature distri
pes of power p These coolan uction. These nd self weight grity assessm For ensuring established cr mponent Integ
Under this pro d under pure cientific and I
ransport) pipi pressure of r on. Hence to ced Compone
pipes and ma ending mom ad Line Displ recorded duri mulate those t
ponents a
ment
K. Vazetre, Mumbai,
cture behavio Rs, fracture te of 219 mm an onic bending d during expe
e the governin not the fra n performed ference in the
ibution, durin
plants. These nts are then tr
are exposed t t, etc. During ment under ben
g integrity of riterion. For L grity Test Pro
ogram large n e bending mo Industrial Re ing of Indian reactor pressu o address the
ent Integrity any elbows h ment at elevat lacement (LL
ng test. The tests and diffe
at Elevate
India
our of the p est were cond nd 406mm, h g and at ele eriment releva
ng failure crit acture mecha for both the p e experimenta ng the testing.
pipes are use ransferred thr to different ty earth quake, nding momen pressurized p LBB qualific ogram was pla numbers of str oment in Stru search), Chen PHWRs is c ure (≈10MPa e reactor oper
Test Program ave been test ted temperatu LD), Crack M
22nd Conference on Structural Mechanics in Reactor Technology San Francisco, California, USA - August 18-23, 2013 Division II
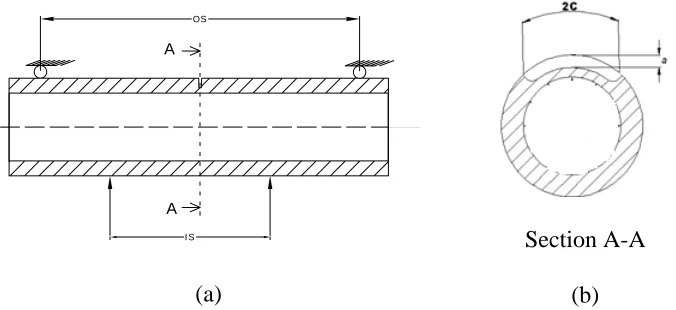
Both straight pipes have been fabricated with outside part throughwall circumferential cracks. Nominal diameters of these pipes are 8 inch and 16 inch. Relevant dimensions of pipes are shown in Table 1. The loading configuration is shown in schematic diagram in Figure 1 (a). Crack configurations are shown in Figure 1(b). Both pipes have been fatigue cracked to produce very sharp crack from machined crack. The maximum cyclic load was 20% of the predicted collapse load while minimum cyclic load corresponds to 10% of the maximum cyclic load. The cyclic load was applied using computer controlled servo-hydraulic actuator. The cyclic load was applied till the crack growth was approximately 2-3mm.
Table 1: Dimensions of Pipes.
Test Outer Diameter
(mm)
Thickness (mm)
Outer span (mm)
Inner span (mm)
Crack length(2C)
(mm)
Crack Depth (After fatigue pre cracking) (a)
(mm)
TSPPTC8-1 219 18.8 4000 880 65 8.5
TSPPTC16-1 406 26.9 5000 1620 134.5 16.14
Test Outer
Diameter
(mm)
Thickness
(mm)
Outer
span
(mm)
Inner
span
(mm)
Crack
length(2C)
(mm)
Crack Depth
(After fatigue
pre cracking) (a)
(mm)
A
A OS
IS
(a)
Section A-A
(b)
Figure 1:(a) Schematic diagram of pipe showing IS (Inner Span) and OS (outer span). (b) Schematic diagram of surface crack for pipes.
Test arrangement
(a)
Figure 2
depicts th provided
2: (a) Schema point be
hat the test t at one end an
(b)
atic diagram o ending and co
temperature i nd roller supp
of test set up. onstant interna
is maintained port at other e S
(a)
(b) TSPPTC1 al pressure. (c
d at 300oC d end. Steel ped Strong floor
Not CL
16-1 subjecte c) Test tempe
during entire destals were u tch
Load cell 500 T Hydra Reaction fra
(c)
d to combine erature is sho
testing. A h used for supp Loading m aulic jack me
d loading of f own.
hinge suppor porting the pi member
Pipe specim
four
t was ipe. A men
22nd Conference on Structural Mechanics in Reactor Technology San Francisco, California, USA - August 18-23, 2013 Division II
distribution beam with roller was used for applying two concentrated loads on the pipes over a distance i.e. inner span. The hydraulic jack/actuator was connected to the distribution beam by the suitable plates and tie rods. Details are available in [Saravanan et al.]. The hydraulic jack system consisted of an external Linear Variable Displacement transducer (LVDT) for measuring load-line displacement and a load cell for measuring the applied load. The actuator system consisted of an in-built LVDT for measuring load line displacement and a load cell for measuring the applied load.
Heating Arrangement
For heating the pipe at the notch location, the notch portion of the pipe was wrapped with heating elements covered with ceramic cloth. Above this insulation material was provided to prevent heat loss. This arrangement can be seen in Figure 2 (b). Temperature regulators were used for setting the required temperature and maintaining the same throughout the test. The temperature was measured with regular intervals with a non contact type laser based temperature measuring instrument. In addition, thermocouples were also used to measure the temperature
Loading
A static and monotonic load is applied on the pipe specimens under displacement control. The rate of displacement was fixed at 0.05mm/sec. Since the actuator has the maximum displacement of 130mm, the test is stopped manually after the maximum displacement of 130mm. The test is again continued after adjusting the displacement of the actuator using manual control and by providing packing plates at the loading points.
Instrumentation and data acquisition
Different instrumentations are mounted on test configurations for monitoring and recording different experimental results like total applied load, CMOD, LLD, crack growth, strains, etc. The inbuilt strain gauge based load cell in the actuator is used for knowing total applied load while inbuilt LVDT is used to know total displacement of actuator. CMOD is measured by specially fabricated clip gauge that is fitted to the centre of crack. Deflection of pipe at different typical location is measured by installed LVDT. Crack growth in the fracture test of piping components is measured by the Alternate Current Potential Difference (ACPD technique. Steel pins of 1 mm diameter were spot welded at regular intervals of 10mm along the notch length. These pines were connected to the crack micro-gauge. During the fracture test, the readings were taken of ACPD at regular intervals of loading which is post processed later for crack growth data.
THREE DIMENSIONAL FINITE ELEMENT ANALYSES:
Finite Element (FE) Model
The 3D- elastic-plastic FEA were performed for both test cases. Due to symmitricity in the geometry and material only one fourth of pipe is needed to be modelled. At symmetric planes, appropriate constraints are applied to fix the planes. Very fine mesh is adopted near crack front to capture the steep gradient of stress and strain near crack front.
true stress vs. strain data obtained from the testing of standard tensile specimen at elevated temperature of 300oC from same piping material is incorporated in the FE model
.
(a)
(b)
(c)
Figure 3: (a) Finite element mesh used for pipe having part throughwall crack (b) zoomed on region B. (c) Detailed crack front meshing in the region C.
Material Parameters:
Tensile specimens have been machined from the 16 inch piping material (SA333Gr6 Carbon
Steel) is shown in Figure 4.
Table 2summarizes the material properties [Singh et al.]. The true
stress-strain data derived from the uni-axial test is fitted in the Ramberg Osgood equation (1) and
the constants are given in Figure 4.
ߝ
ߝ
ൌ
ߪ
ߪ
ߙ ൬
ߪ
ߪ
൰
(1)
Where, σ
0and ε
0are the value of true stress and strain at the yield point. E=σ
0/ε
0,α is a
constant and n is the strain hardening exponent.
1
JUL 10 2009
22nd Conference on Structural Mechanics in Reactor Technology San Francisco, California, USA - August 18-23, 2013 Division II
0.0 0.5 1.0 1.5 2.0 2.5 3.0 3.5 4.0 4.5
0 500 1000 1500 2000 2500
tr
u
e
st
re
ss
(
M
P
a
)
true strain
For SA333Gr6 Material at 300oC
σ
y=220ΜPa σu=467ΜPa
Ramberg Osgood Constants
α=29.13;n=2.156
Figure 4. True stress-strain curve obtained from tensile specimen machined from the pipe
Table 2: mechanical properties of piping material (SA333Gr6 steel) at 300oC
Yield Strength,
σ
0220MPa
Ultimate Tensile Strength,
σ
u464MPa
Young’s modulus of elasticity,
E
183GPa
Poisson’s Ratio, ν
0.3
RESULTS AND DISCUSSION
Comparison between experimental and FEA results for pipe
Figure 5 (a) depicts the comparison of load vs. load-point displacement data predicted from finite element analysis with the experimental result for TSPPTC8-1. Load vs. load-point displacement is showing good agreement between FEA results and experimental result in linear loading part. After LLD of 50mm, the results are deviating from experimental results. After deviation, the FEA result is reaching to an asymptotic value, while experimental result are increasing continually or in other words it is keeping constant positive slope. Similar trend is also observed in the plot of load vs. CMOD as shown in Figure 5(b).
identical analysis is performed with the material properties of SA333Gr6 at room temperature [Tarafder et. al.] given in Table 3 and Figure 6(a). The corresponding load vs. LLD plot is depicted in Figure 6(b). It can be observed that asymptotic load value is shifted upward from 175kN to 230kN. From this study it can be concluded that the better agreement in non linear region can be achieved by changing the material properties from 300oC to room temperature along length when one moves from notch to the end of pipe.
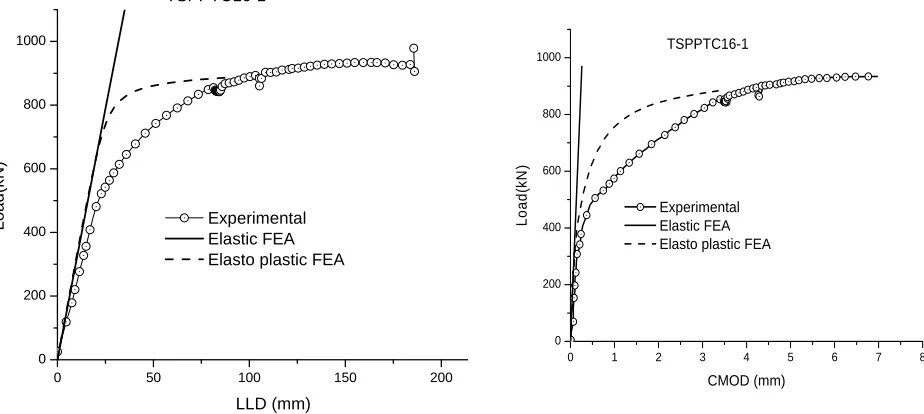
Figure 7(a) shows the load vs. LLD data computed by FEA and experiment for TSPPTC16-1. They are in agreement in the elastic regime and beyond LLD value of 90mm. Similar trend can be observed in the plot of load vs. CMOD data as shown in Figure 7(b). This deviation between FEA and experimental results may be due to local overheating of the notch of pipe.
0 50 100 150 200 250
0 50 100 150 200 250 300
Lo
ad
(k
N)
LLD (mm) Experimental Elastic FEA Elasto plastic FEA TSPPTC8-1
0.0 0.5 1.0 1.5 2.0 2.5 3.0
0 50 100 150 200 250 300
TSPPTC8-1
Loa
d(kN)
CMOD(mm) Experimental Elastic
EPL using Ramberg-Osgood Fit
(a) (b)
Figure 5. Comparison between experimental and FEA results for TSPPTC8-1. (a) Load vs. load line displacement data. (b) Load vs. CMOD data
Table 3: Mechanical properties of piping material (SA333Gr6 steel) at room temperature
Yield Strength,
σ
0288MPa
Ultimate Tensile Strength,
σ
u420MPa
Young’s modulus of elasticity,
E
203GPa
Poisson’s Ratio, ν
0.3
Observation of crack propagation
22nd Conference on Structural Mechanics in Reactor Technology San Francisco, California, USA - August 18-23, 2013 Division II
investigated was A106B carbon steel. Test showed that pipes with small crack or no crack at all, behave as predicted by NSCL (Net Section Collapse Load Criterion). SA333Gr6 pipes having part through circumferential crack can be equalized with the pipes with smaller circumferential throughwall cracks. Hence this finding is in agreement with the literature.
0.00 0.05 0.10 0.15 0.20 0.25
0 100 200 300 400 500 600
Engg. stress - strain
Ramberg-Osgood fit of true stress vs. true strain
S
tre
ss
(M
P
a
)
Strain
Properties of SA333Gr6 at room temperature
(a)
0 50 100 150 200 250
0 50 100 150 200 250
300 TSPPTC8-1
Loa
d(kN)
LLD (mm) Experimental Elastic
Elasto plastic FEA at 300oC Elasto plastic FEA at Room Temp
(b)
Figure 6. (a) Stress and strain data at room temperature for PHT piping material. (b) Comparison between experimental and FEA results of Load vs. load line displacement data for TSPPTC8-1.
0 50 100 150 200
0 200 400 600 800 1000
Load(
k
N
)
LLD (mm) Experimental Elastic FEA Elasto plastic FEA TSPPTC16-1
0 1 2 3 4 5 6 7 8
0 200 400 600 800 1000
TSPPTC16-1
Lo
ad
(k
N
)
CMOD (mm) Experimental Elastic FEA Elasto plastic FEA
Figure 7.Comparison between experimental and FEA results for TSPPTC16-1. (a) Load vs. LLD data. (b) Load vs. CMOD data
SUMMARY AND CONCLUSIONS
• Fracture test were conducted on a two numbers of 8 inch diameter pipe and a 16 inch diameter pipe with a part-through crack at outer surface.
• These pipes were subjected to monotonically increasing four point bending moment load. During entire testing the temperature was maintained at 300oC.
• Different experimental results like load, LLD and CMOD have been monitored and recorded during the experiment.
• Crack initiation is not predicted till final loading. Hence it can be concluded that the governing failure criterion for the elevated temperature condition is NSCL (Net Section Collapse Load Criterion).
• Experimental results like load versus load line displacement and load versus CMOD are in agreement in elastic regime but there is considerable deviation beyond elastic limit for both pipes.
• For TSPPTC8-1 this deviation is attributed to the prevalent temperature gradient in pipe.
• The difference in the experimental and FEA results for TSPPTC16-1 is attributed to the overheating of notched portion of the pipe.
ACKNOWLEDGEMENTS
The authors acknowledge the technical support of Dr. G. Raghava, Shri P Gandhi and other fatigue testing laboratory staff of SERC, Chennai, India in conducting pipe fracture test.
REFERENCES