Division S3 Material Analysis 2
MATERIAL MODELS IN APPLICATIONS OF THE DISCRETE
ELEMENT METHOD (DEM) TO 3D CONCRETE COMPRESSION
Jorge Daniel Riera1, Letícia Fleck Fadel Miguel2 and Ignacio Iturrioz3
1 Invited Professor, Civil Eng. Dept., Univ. Federal do Rio Grande do Sul, RS, Brazil.
2 Associate Professor, Mechanical Eng. Dept., Univ. Federal do Rio Grande do Sul, RS, Brazil. 3 Titular Professor, Mechanical Eng. Dept., Univ. Federal do Rio Grande do Sul, RS, Brazil.
ABSTRACT
The authors successfully employed the Discrete Element Method (DEM) in numerical determinations of the response up and beyond failure of reinforced concrete structures subjected to impact and impulsive loadings in which tensile fracture usually controls the dominant failure modes. The approach is also applicable to structures that fail by shear or unconfined compression, cases in which it is capable to predict size and strain rate effects. It was previously verified that DEM models predict the strength increase observed in concrete subjected to static multi axial compression in relation with the unconfined strength, for confining (lateral) pressures up to about 20% of the unconfined compressive stress, although overestimating the effect of the latter. In this paper the consideration of the random distribution of concrete local stiffness on DEM predictions of material response under 3D compression is examined, confirming previous conclusions concerning the marginal influence of this factor. On the other hand, it is
widely recognized that in situ concrete compressive strength of drilled cores in the direction normal to the
direction of casting is slightly smaller than the strength in the vertical direction. The consideration of both factors should lead to improvement in the predicting capability of the DEM formulation proposed in the paper.
INTRODUCTION
Basically, in the truss-like DEM approach the solid is modeled by means of an array of uniaxial elements, which interconnect nodal three degrees of freedom masses. The Lattice DEM formulation used in this paper was proposed by Riera (1984). The constitutive criterion was based on Hillerborg’s model (1978). DEM applications in studies of non-homogeneous materials subjected to fracture were reported by
Miguel et al. (2010) and Riera et al. (2011), while DEM analyses of Nuclear Power Plant containments
and other engineering structures were described by Riera and Iturrioz (1998) and Kosteki et al. (2014).
The behavior of quasi-fragile materials under simple tension, which is governed by fracture, is better known than under confined compression, which involves more complex phenomena. Krajcinovic (1996) studied this problem, proposing approaches such as the Sliding Crack Mechanism, which appears to capture the post peak part of the damage process (Nemat-Nasser and Hori, 1982). Gross and Seelig (2006) describe the behavior of fragile materials subjected to compression: in a first stage, a micro-fissures field is formed in the same direction of load application. Then, influenced by heterogeneities of the material, the fissures grow in inclined directions and mode II fractures appear with subsequent sliding with friction.
Riera et al. (2015) presented DEM numerical simulations of the response of cubic and prismatic concrete
samples subjected to 3D compression tested by Van Geel (1998), while Riera et al. (2016) extend the
study to include available experimental results of cylindrical samples subjected to confined compression
obtained by Candappa et al. (2001) and Vu et al. (2012). Predictions of the peak compressive stresses and
for higher confinement. Introduction of imperfections in the cubic mesh geometry, as suggested by
Iturrioz et al. (2014), improved the performance of the method under unconfined compression.
In previous applications, both the specific mass and the elastic properties of concrete were assumed to be
constant, i.e. equal to the mean values reported for the material under consideration, in which only the
variability of the specific fracture energy was assumed to be a 3D random field. This formulation was adopted to reduce computational time, in view of the negligible influence of stiffness variability verified in applications in which tensile failure is the dominant mode. Thus, schemes to represent the nonhomogeneous nature of concrete in DEM models are described in the paper. Moreover, a degree of
anisotropy – it is widely recognized that in situ compressive strength of drilled cores in the direction
normal to the direction of casting is slightly smaller than the strength in the vertical direction – may exert an additional influence on concrete response, to the author’s knowledge never examined in controlled experimental studies. Alternative approaches to account for this effect are finally discussed in the paper.
THE DISCRETE ELEMENT METHOD IN FRACTURE PROBLEMS
The computational model employed in this paper is based on the representation of a solid by means of an arrangement of elements able to carry only axial loads. The equivalence between an orthotropic elastic continuum and a cubic arrangement of uni-axial elements consisting of a cubic cell with eight nodes at its corners plus a central node was shown by Nayfeh and Hefzy (1978). This discrete elements representation of an orthotropic continuum was adopted by Riera (1984) to solve structural dynamics problems by means of explicit direct numerical integration of the equations of motion, assuming the mass lumped at the nodes. The softening law for quasi-fragile materials proposed by Hilleborg (1978) was adopted to model the behavior of quasi-fragile materials by means of a triangular constitutive relationship (ECR) for the DEM bars, which allows accounting for the irreversible effects of crack nucleation and propagation.
The area under the force vs. strain curve is related to the energy density necessary to fracture the area of
influence of the element (Riera et al., 2016). Once the damage energy density equals the fracture energy,
the element fails and loses its load carrying capacity. Since under compression the material is assumed to remain linearly elastic, failure in compression is induced by indirect tension. The energy dissipated by a
cubic DEM module and its distribution in the various elements were examined by Iturrioz et al. (2014).
The introduction of small perturbations of the cubic arrangement, generated by small initial displacements
of nodal points, was explained in previous papers (Iturrioz et al. (2014)). In previous applications (Riera
et al., 2016) of the truss-like DEM formulation, the specific mass and the elastic properties of the material
were assumed constant, while the specific fracture energy Gf was regarded as a random field (Miguel et
al. (2010))
REPRESENTATION OF MATERIAL INHOMOGENEITY
In order to improve the DEM performance in simulations of the response of concrete samples subjected to
3D compression (Riera et al., 2016), more refined material models were examined, in which both the
local modulus of elasticity E and the specific fracture energy Gf are assumed uncorrelated 3D random
fields characterized by a Type III (Weibull) extreme value distribution. The same correlation length lc is
assumed to apply in both cases. Thus, in view of the expected small influence of this effect, a single model of the random distribution of elastic properties was considered in the ensuing simulations. In the models described above it is assumed that the properties of interest can be described by a given probability distribution and a spatial correlation structure. The most relevant parameter of the latter would
be the correlation length lc, which is assumed dependent on the maximum size of the coarse aggregates. In
all simulations presented herein it was therefore required that the correlation length lc exceeds that largest
coarse aggregate, denoted material 2. Let also a and b denote the relative volumes of both materials (note
that a + b = 1). In a first approximation, the elastic modulus of both materials, E1 and E2,may be
considered constant, that is, both the mortar and the aggregate may be assumed homogeneous. In such case the expected value of the elastic modulus of mix is:
μ (E) = a E1+ bE2 (1)
Similarly, it may be shown that the variance σ2(E) of the elastic modulus of the mix is given by:
σ2 (E) = a E
12+ bE22 – μ2 (E) (2)
Equation (1) estimates the mean of a concrete mix, while equation (2) should be a lower bound of the
variance, because both E1 and E2 are in fact random fields whose inner variability is not taken into
account by equation (2). On the basis of equations (1) and (2), the coefficient of variation of E is given by
the ratio between the standard deviation and the expected value, yielding:
CV(E) = [a E12+ bE22 – μ2 (E)]½ / (a E1+ bE2) (3)
When E1= E2 then CV(E) = 0, as expected. For a conventional concrete, in order to simplify the resulting
expressions, it may be accepted that a = b = 0.5, in which case the coefficient of variation CV(E) would
depend only on the ratio between E2 and E1. When E2 ≥ 3 E1 then CV(E) ≥ 1, situation that is regarded as
unrealistic when the variability of the material property is described by means of a Weibull function, in
view of both numerical and experimental probability density functions (pdf) of the local modulus of
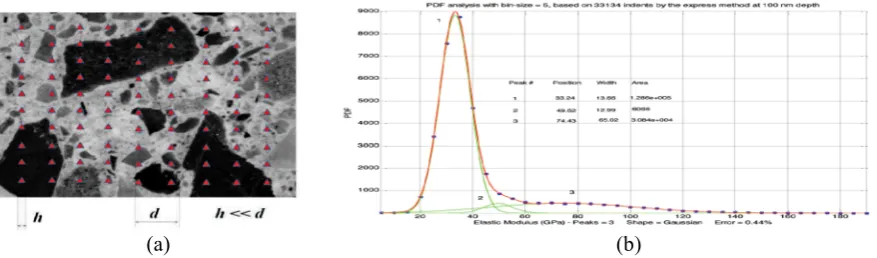
concrete proposed in the literature. Figure 1 (a) shows the view of a slice of a concrete sample in which the coarse aggregate (material 2) according to the two phase model described above can be readily identified, as well as the locations of nano-indentation points (Sebastiani, 2013) where the desired material property is measured. A plot of local values of the elastic modulus determined by Sebastiani (2013) on a Portland cement mortar employing the same technique, as well as the resulting probability density function (pdf) is shown in Figure 1 (b).
(a) (b)
Figure 1: Concept of statistical nano-indentation to map the mechanical properties of multi-phase materials. (a) a grid of tests performed and (b) example of the frequency distribution plot of measured
values of the Elastic modulus and proposed pdf model (Sebastiani, 2013).
Another illustration of experimental observations of the pdf of the elastic modulus of concrete is presented in Figure 2 which shows the resulting composite function of a four phases high strength concrete mix, each phase modelled by means of a Gaussian pdf. The experimental evidence suggests therefore that a type III extreme value distribution (Weibull) may be an appropriate model to describe the random distribution of the local elastic modulus of concrete mixes, since in addition to satisfying the
physical requirement of not allowing negative local values of E, only two parameters are required, the
mean value E(E) and either the CV(E) or the shape parameter γ of the distribution. In this context, note
that for the Weibull (minimum) function, there is a monotonic relation between CV(E) and γ, shown in
CV(E) = exp [ - 0.1616 + 0.17648 / γ - 0.8839 ln γ ] (4)
For values of γ larger than 2, the shape of the function presents a resemblance to experimentally
determined density functions and, in addition, the pdf does not exist for negative values of the argument, physical requirement that is not satisfied by the frequently used Gaussian model, for example.
S = 0.02914956 r = 0.99952977
X Axis (units)
Y
A
xi
s
(u
n
it
s)
0.1 0.8 1.5 2.2 2.9 3.6 4.3
0.02 0.42 0.83 1.23 1.63 2.03 2.44
Figure 2: Experimental pdf of a 4 phases concrete Figure 3: Relation between CV(E), plotted in
the mix, each modeled by a Gaussian function vertical axis, and the shape parameter γ of a
(da Silva et al., 2012) Weibull distribution, in the abscissa axis.
On the basis of the preceding reasoning, random fields with a constant γ, i.e. defined only by the expected
value of Young’s modulus, in addition to the correlation length, were adopted in the ensuing simulations.
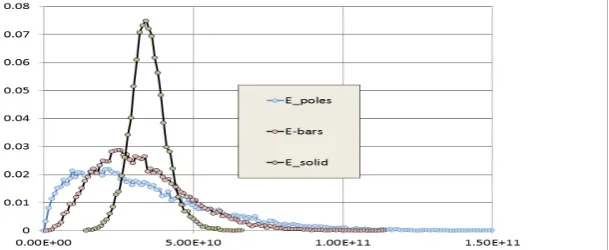
Figure 4 shows with blue dots a plot of the probability density function adopted for concrete, for CV(E) =
0.7. This CV corresponds to a shape factor γ ≈ 1.3, which is regarded as a lower bound of the range of
feasible values for concrete mixes, implying larger stiffness variability than in most concretes or mortars, and thus a more pronounced effect on response predictions. The figure also shows the resulting pdf of elastic constants for individual DEM elements, determined by the value of the field at the location of the center of the element under consideration. As described before, this value is obtained by interpolation
from the values of the field at the nodes, distant lc from each other, and hence the CV is somewhat smaller
than the CV of the property (E or Gf) being simulated.
Figure 4: View of pdf of local elastic modulus adopted for concrete with coefficient of variation
CV(E) = 0.7. Original pdf (E_poles), DEM elements (E_bars) and basic cubic volume (E_solid).
SIMULATION OF VAN GEEL’S TESTS ON CUBIC SAMPLES UNDER 3D COMPRESSION
The response of standard 100mm cubic concrete samples tested by Van Geel’s (1998) under unconfined and tri-axial compression was numerically determined by simulation using the DEM. The samples had no restrictions on their upper and lower faces. Displacements were imposed on the upper face of the samples,
while nodal forces were applied on the four lateral faces. Material properties were m(E) = 32GPa, CV(E)
load, Lo = 0.004m and lc= 0.008m. Introducing these values in the equations presented previously, leads
to the mean failure strain m(er) = 5.12×10⁻³, the ratio between m(er) and m(ep), kr = 72.1. The response of
simulated samples was determined for perturbations in this mesh with CVp equal to 2.5%. However, the
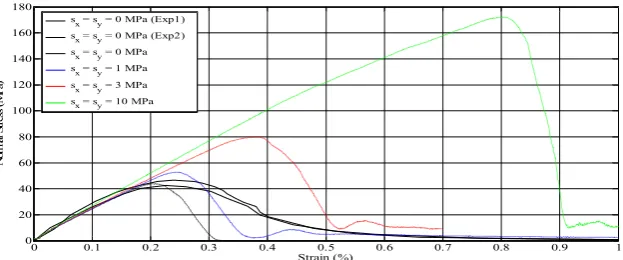
coordinates of nodes within a narrow region close to the cubic boundary were not altered, to maintain the nominal external geometry. Samples of Van Geel’s (1998) cubes were simulated applying the confining
stress with the same rate adopted for the vertical stress. For higher confining stresses (σx = σy), sliding
with friction along existing fractures, not accounted for in the numerical solution, begins to influence the response. It may be seen that the mean stress-strain curves differ marginally from those determined
assuming that E is constant, but for low confinement predict smaller peak values.
0 0.1 0.2 0.3 0.4 0.5 0.6 0.7 0.8 0.9 1
0 20 40 60 80 100 120 140 160 180
Strain (%)
N
or
m
al
S
tr
es
s
(M
P
a)
sx = sy = 0 MPa (Exp1)
sx = sy = 0 MPa (Exp2)
sx = sy = 0 MPa
s
x = sy = 1 MPa
sx = sy = 3 MPa
sx = sy = 10 MPa
Figure 5: Nominal vertical stress vs. vertical strain curves for Van Geel (1998) cubic samples subjected to
unconfined and confined compression for revised material model. Full lines show one simulation result
for confining stresses σx = σy = 0, 1, 3 and 10 MPa. Dashed lines show experimental curves for two
unconfined compression tests.
SIMULATION OF TESTS ON CYLINDRICAL SAMPLES UNDER 3D COMPRESSION
The response of 196mm long and 98mm in diameter cylindrical concrete samples tested by Candappa et
al. (2001) under unconfined and tri-axial compression was numerically simulated. The samples had no
restrictions in their upper and lower faces on which vertical displacements were imposed, while nodal
forces were applied on the lateral surface of the cylinders. Material properties were m(E) = 41GPa, CV(E)
= 0.7, r = 2300kg/m3, m(G
f) = 130N/m, CV(Gf) = 0.9, m(ep) = 0.3434×10⁻³ that is the strain at the peak
load, Lo = 0.0049m and lc= 0.0049m. Leading to the mean failure strain m(er) = 2.02×10⁻², the ratio
between m(er) and m(ep), kr = 58.9. CVp = 2.5% was assumed, however, the nodal coordinates within a
narrow region close to the theoretical cylinder boundary were not altered.
Figures 6 and 7 show lateral and top views of the DEM models of the cylindrical concrete samples, while mean vertical stress versus mean vertical strain diagrams determined by simulation on samples under
unconfined and confined compression are plotted in Figure 8, in which E and Gf were modeled as
0 0.1 0.2 0.3 0.4 0.5 0.6 0.7 0
20 40 60 80 100 120 140 160
Strain (%)
N
or
m
al
S
tr
es
s
(M
P
a)
sr = 0 MPa (Exp)
sr = 0 MPa
sr = 4 MPa
sr = 8 MPa
Figures 6 and 7: Lateral and top views of the Figure 8: Nominal vertical stress vs. vertical strain
cylindrical concrete samples. curves for Candappa et al. (2001) cylindrical samples.
SIMULATION PREDICTIONS ASSUMING MESOSCALE ISOTROPIC BEHAVIOR
As discussed by Riera et al. (2015), DEM predictions of concrete response under compression
considering E constant overestimate the effect of low confinement, up to confining stresses of the order of
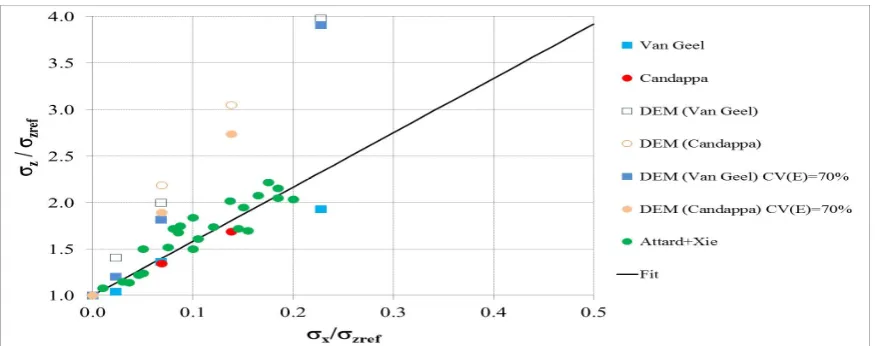
40% of the unconfined strength. Although the nonhomogeneous nature of concrete was previously shown to exert a marginal influence on both the static and dynamic responses of structural elements that fail by tension, shear or unconfined compression, its influence in cases of confined compression had not been previously examined. The simulation results reported above indicate, however, that for low confinement, the confined strength is lower than the strength predicted assuming that E is constant, and therefore it is closer to the experimental evidence. Figure 9 presents a summary of the relations between the peak mean
vertical stress σz and the confining stress σx = σy or σr, both normalized by the unconfined vertical stress,
measured by various authors in cylindrical or cubic samples, and determined with DEM models
considering E constant or variable. The linear relation plotted in the graph fits the experimental results. It
is quite clear that both DEM models correctly predict the experimentally observed increase of the compressive strength due to the confining stress, but for low confinement, overestimate the effect of the latter. It seems also evident that the consideration of the random distribution of the local stiffness improves the correlation between numerical predictions and experimental results, since the peak of the
simulated stress-strain curves are about 10% lower than the peaks assuming E constant.
Figure 9: Ratios between the peak nominal vertical stress σz and the confining stresses σx = σy or σr, both
normalized by the unconfined vertical stress, measured by various authors in cylindrical or cubic samples,
Before suggesting further refinements in the numerical approach, it should be underlined that, in all cases, the fracture and stiffness parameters were selected in order to reproduce the experimental results for unconfined compression. The experimental results are also plotted in Figures 5 and 8, for unconfined compression, and it may be verified that both the peak values and corresponding strains coincide with those of DEM simulations. The second issue is related to the fact that in both DEM models a mesoscale isotropic behavior is implicitly assumed, implying that, for a sufficiently large sample, the material may be described as isotropic.
INFLUENCE OF MESOSCALE ANISOTROPIC BEHAVIOR
It is shown by the results presented in previous sections, in which mesoscale isotropic behavior of concrete is assumed, that consideration of the randomness of the stiffness of DEM elements exerts a minor influence on predictions of the response of concrete samples subjected to static 3D compression. There is overwhelming evidence, however, that in normal concrete there is some degree of mesoscale orthotropic behavior, which results from gravitational effects during concrete casting and hardening. According to Ozyildirim and Carino (2010), weak interfacial regions tend to occur more frequently under coarse aggregate particles, due to bleeding and other causes. As a direct consequence, in normal concrete, horizontal initial fractures - not produced by load applications - may be expected to be more numerous than fractures in other orientations, resulting in a smaller compressive strength in the orientation parallel to the predominant orientation of the cracks, that is, the horizontal plane, in relation to the compressive strength in the vertical direction (Neville, 1996; Suprenant, 1985). This fact has been widely verified in pavement and highway construction: AASHTO T124 (2005) instructions clearly state that the strength of cores drilled in directions parallel to a horizontal plane tends to be lower than the strength of cores drilled in the vertical direction. The previous considerations lead to two important conclusions: first, horizontal cracks tend to close when subjected to vertical compression and therefore their presence should not influence either experimental nor DEM numerical determinations of the (vertical) unconfined compressive strength. On the other hand, these horizontal cracks may cause a reduction of the influence of confining stresses on the vertical strength, in relation to the influence that might be expected in an
isotropic material. The effect may be simulated by affecting the Gf value of selected DEM elements
oriented during casting in the vertical direction by a reduction coefficient Cred, approach examined in the
following section. It may be expected that the appropriate reduction coefficient Cred for any given
concrete depends on its composition, fabrication procedure and other factors. Moreover, its value in connection with the experimental results reported in the technical literature is obviously not well understood, since a reliable quantification of its influence would require extensive experimental studies.
In view of these factors, the authors initially adopted coefficients Cred varying between 1 (no weakening)
and 0 (no tensile strength), for the elements at the corners of DEM cubes. Thus the total area of elements affected is about 12% of the cross-sectional area, but uniformly distributed throughout the sample. In such case, the direct tensile strength in the vertical direction (direction of casting) of cubic samples modelled
with the DEM decreases as Cred decreases, in relation to the strength of the same sample in which the
Table 1: Tensile strength of simulated samples. Tensile strength of simulated samples (MPa)
100% Gf 70% Gf 40% Gf 10% Gf 5% Gf 1% Gf 0% Gf(*)
Simulation 1 2.4783 2.3865 2.2729 2.1059 2.0648 2.0225 2.0169
Simulation 2 2.4761 2.3834 2.2694 2.1001 2.0580 2.0163 2.0107
Simulation 3 2.5767 2.4831 2.3650 2.1888 2.1418 2.0976 2.0928
Mean 2.5104 2.4177 2.3024 2.1316 2.0882 2.0455 2.0401
CV (%) 2.29 2.34 2.35 2.33 2.23 2.21 2.24
(*) Percentage of toughness reductions in the vertical bars of the model (100% no reduction, 0% full reduction).
0 0.005 0.01 0.015 0.02 0.025 0.03 0.035 0.04 0.045 0.05 0 0.5 1 1.5 2 2.5 3 Strain (%) N or m al S tr es s (M Pa
) 100%Gf 70%Gf
40%Gf 10%Gf 5%Gf 1%Gf 0%Gf
0 0.005 0.01 0.015 0.02 0.025 0.03 0.035 0.04 0.045 0.05 0 0.5 1 1.5 2 2.5 3 Strain (%) N or m al S tr es s (M Pa
) 100%Gf 70%Gf
40%Gf 10%Gf 5%Gf 1%Gf 0%Gf
(a) (b)
Figure 10: Global stress-strain curves in uniaxial tension. (a) Simulation 1, (b) Simulation 2.
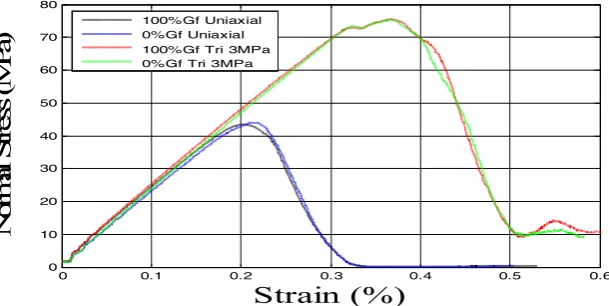
0 0.1 0.2 0.3 0.4 0.5 0.6 0 10 20 30 40 50 60 70 80 Strain (%) N or m al S tr es s (M P a) 100%Gf Uniaxial 0%Gf Uniaxial 100%Gf Tri 3MPa 0%Gf Tri 3MPa
Figure 11: Global stress-strain curves in uniaxial and 3D compression (confining stress 3MPa) for Simulation 1. Percentage of toughness reductions in the vertical bars of the model (100% no reduction,
0% full reduction).
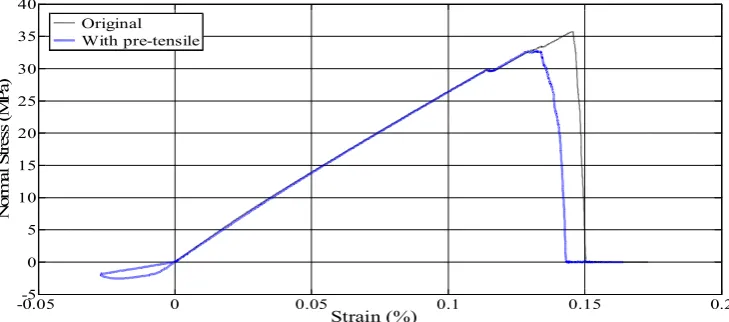
In view of the evidence reported above, an alternative scheme was adopted to weaken elements in the model, in order to simulate more realistically the presence of initial small horizontal fractures. This was achieved by subjecting the simulated globally isotropic samples to a uniaxial tensile stress in the
horizontal (Ox) direction, up to 80% of the uniaxial tensile strength of the sample, before applying a
uniaxial compressive stress in the vertical (Oz) orientation. The data for Van Geel’s (1998) cubes reported
above was used in the simulated samples. Only the rate of the displacement-controlled test was further
decreased in relation to previous values, to 2×10⁻³/s, which led to a small reduction of the strength as
does not change, in accordance with experimental evidence. A total of six simulations were performed, with the results summarized in Table 2. The DEM model predicts a reduction of the unconfined compressive strength of cubes in the orientation normal to the orientation of concrete casting, compatible with the scarce experimental evidence reported in the open literature. The mean reduction resulted of around 3.5%, but it was observed that in roughly half the samples there is no reduction, while in the other
half the mean reduction exceeds 7%. This effect seems to be associated to whether the pre-tensile loading,
i.e. the additional horizontal fractures, causes an alteration in the rupture configuration or not, and
requires further numerical and experimental studies.
-0.05-5 0 0.05 0.1 0.15 0.2
0 5 10 15 20 25 30 35 40
Strain (%)
N
or
m
al
S
tr
es
s
(M
P
a)
Original With pre-tensile
Figure 12: Plot of one compression test simulation, for the original sample (thin line) and for the sample with a pre-tensile loading cycle (thick line) in an orthogonal orientation.
Table 2: Effect of anisotropy on unconfined strength in vertical and horizontal orientations.
SAMPLE 1 2 3 4 5 6 MEAN
σz 35.74 33.62 41.47 38.32 36.62 39.22 37.50
(σz)pre-tensile 32.71 33.54 41.57 38.30 32.80 38.13 36.18
Cred 0.92 1.00 1.00 1.00 0.90 0.97 0.965
CONCLUSIONS
The results reported in the paper confirm the capability of the truss-like DEM approach employed by the authors to determine the response of quasi-fragile materials like concrete or rock, to predict material behavior under arbitrary excitations, although it overestimates the strength in case of 3D compression, under confining stresses smaller than around half the unconfined compressive strength. It is also shown that consideration of the random distribution of the initial stiffness of concrete improves the predicting capability of the method, but is not sufficient to completely account for differences between DEM and experimental results in samples subjected to 3D compression. Approaches to introduce in DEM models the anisotropy observed in conventional concrete are also examined. The effect of anisotropy in cubes subjected to unconfined compression in the orientation of concrete casting (vertical) and in a horizontal direction is successfully reproduced, on the basis of the scarce experimental evidence available, but its influence on concrete response under 3D compression requires additional research.
REFERENCES
da Silva, W. R. L.; Němeček, J. and Štemberk, P. (2012): “Nanotechnology and construction: use of nanoindentation measurements to predict macroscale elastic properties of high strength cementitious composites”, Rev. IBRACON Estrut. Mater. Vol.5, No.3 São Paulo, Brasil.
Candappa, D.C.; Sanjayan, J.G., and Setunge, S. (2001): "Complete triaxial stress-strain curves of high
strength concrete", Journal of Materials in Civil Engineering, ASCE, Vol. 13, No. 3, pp. 209-215.
Gross D. and Seelig T. (2006). “Fracture Mecanics with and Introduction to Micromechanics”, Mechanical Engineering Series. Ed. Ling F. F., Springer. p319. doi 10.1007/b22134.
Hillerborg, A. (1978): “A model for fracture analysis”, Coden, LUTVDG/TVBM 3005/1-8, 1978.
Iturrioz, I., Riera, J.D. and Miguel, L.F.F. (2014): “Introduction of imperfections in the cubic mesh of the
truss-like Discrete Element Method”, Fatigue and Fracture of Engineering materials and Structures,
Sage Publ. Co., Vol 1, 2014
Krajcinovic D., (1996) “Damage Mechanics”. Elsevier, Amsterdam.
Miguel, L. F. F., Iturrioz, I., and Riera, J. D., (2010). “Size effects and mesh independence in Dynamic
Fracture Analysis of Brittle Materials.” Computer Modeling in Engineering & Sciences, Vol. 56, No.
1, pp. 1-16.
Nayfeh, A. H. and M. S. Hefzy (1978), “Continuum modeling of three-dimensional truss-like space
structures”, AIAA Journal, 16(8), 779-787.
Nemat-Nasser, S. and Horii, H., (1982), Compression-Induced Nonplanar Crack Extension with
Application to Splitting, Exfoliation and Rock Burst, J. Geophys. Res., Vol. 87, pp. 6805-6821.
Neville, A. M. (1996): Properties of Concrete, 4th ed., John Wiley & Sons, Inc., New York, USA.
Ozyildirim, C. and Carino, N.J. (2010): Chapter 13. Concrete Strength Testing, ASTM STP169D,
Significance of Tests and Properties of Concrete & Concrete-Making Materials, Lamond, J.F.
and Pielert, J.H.(Editors), PA, USA.
Riera, J.D. (1984): “Local effects in impact problems on concrete structures”. Proceedings, Conference on Structural Analysis and Design of Nuclear Power Plants. Oct. 1984, Porto Alegre, RS, Brasil, Vol. 3, CDU 264.04:621.311.2:621.039.
Riera, J.D., Iturrioz, I. (1998): “Discrete elements model for evaluating impact and impulsive response of
reinforced concrete plates and shells subjected to impulsive loading”. Nuclear Engineering and
Design, Vol. 179, pp. 135-144.
Riera, J.D., Miguel, L.F.F., Iturrioz, I., (2011): “Strength of Brittle Materials under High Strain Rates in
DEM Simulations”, Computer Modeling in Engineering & Sciences, Vol. 82, pp. 113-136.
Riera, J.D., Miguel, L.F.F., Iturrioz, I., (2014): “Study of imperfections in the cubic mesh of the truss-like
discrete element method”, International Journal of Damage Mechanics, August 2014, vol. 23, 6, pp.
819-838.
Riera, J.D., Miguel, L.F.F., Iturrioz, I., (2015): “Assessment of the Discrete Element Method (DEM) in
the prediction of concrete behavior in 3D compression”, Proceedings, 22thInternational Conference
on Structural Mechanics in Reactor Technology (SMiRT 22), Manchester, UK.
Riera, J.D., Miguel, L.F.F., and Iturrioz, I. (2016): “Evaluation of the discrete element method (DEM) and
of the experimental evidence on concrete behaviour under static 3D compression”, Fatigue Fract
Engng Mater Struct. doi: 10.1111/ffe.12453
Sebastiani, M. (2013): “Mapping the Mechanical Properties of Cement-based Materials By Using CSM and Ultra-fast Nanoindentation”, Agilent Technologies, Inc. 2013, Published in USA, October 15, 2013, 5991-3389EN
Suprenant, B. A. (1985): “An Introduction to Concrete Core Testing”, Civil Engineering for Practicing
and Design Engineers, Vol. 4, No. 8, 1985, pp. 607–615.
Van Geel, E. (1998): “Concrete behavior in multi-axial compression”, Doctoral Dissertation, Technische Universität Eindhoven, ISBN 90-6814-548-7.