INVESTIGATION
A Resolution of the Mutation Load
Paradox in Humans
Yann Lesecque,*,†,1Peter D. Keightley,‡and Adam Eyre-Walker*,2 *School of Life Sciences, University of Sussex, Brighton BN1 9QG, United Kingdom,†Ecole Normale Superieure, Lyon, BP 7000 69342 Lyon, Cedex 07, France, and‡Institute of Evolutionary Biology, School of Biological Sciences, University of Edinburgh, Edinburgh EH9 3JT, United Kingdom
ABSTRACTCurrent information on the rate of mutation and the fraction of sites in the genome that are subject to selection suggests that each human has received, on average, at least two new harmful mutations from its parents. These mutations were subsequently removed by natural selection through reduced survival or fertility. It has been argued that the mutation load, the proportional reduction in population mean fitness relative to the fitness of an idealized mutation-free individual, allows a theoretical prediction of the proportion of individuals in the population that fail to reproduce as a consequence of these harmful mutations. Application of this theory to humans implies that at least 88% of individuals should fail to reproduce and that each female would need to have more than 16 offspring to maintain population size. This prediction is clearly at odds with the low reproductive excess of human populations. Here, we derive expressions for the fraction of individuals that fail to reproduce as a consequence of recurrent deleterious mutation (u) for a model in which selection occurs via differences in relativefitness, such as would occur through competition between individuals. We show thatuis much smaller than the value predicted by comparingfitness to that of a mutation-free genotype. Under the relative fitness model, we show thatudepends jointly onUand the selective effects of new deleterious mutations and that a species could tolerate 10’s or even 100’s of new deleterious mutations per genome each generation.
A
LL organisms are subject to recurrent deleterious mu-tation, which cause some individuals to die or fail to reproduce. Deleterious mutations therefore impose a cost or load on the population. The evolutionary consequences of deleterious mutations were first studied by J. B. S. Haldane, who showed that the reduction in mean fitness in a diploid organism caused by recurrent semidominant deleterious mutation at a single locus is equal to twice the mutation rate (Haldane 1937). This led H. J. Muller to suggest that each new deleterious mutation ultimately leads to one genetic death, irrespective of the mutation’sfitness effect (Muller 1950). Subsequently, the mutation load was more formally defined as the proportional reduc-tion in mean fitness of a population relative to that of a
mutation-free genotype, brought about by deleterious mutations (Crow 1970):
L¼wmax2w
wmax ; (1)
wherewis the meanfitness of the population at equilibrium andwmaxis the mean fitness of a deleterious mutation-free
individual.
Under viability selection, the mutation load is equivalent to the proportion of individuals that fail to survive and hence leave no descendants in the next generation. For example, if an individual carries 10 mutations, each reducing the chance of surviving to reproductive age by 10%, then this individual is expected to survive with probability (1–0.1)10= 0.35. If all
individuals in the population have this genotype, then 65% of them would fail to have any descendants in the next genera-tion. The load does not have such a simple interpretation un-der fertility selection, as we discuss below.
If the fitness effects of deleterious mutations are in-dependent from one another, the mutation load across all loci subject to recurrent mutation is approximately
Copyright © 2012 by the Genetics Society of America doi: 10.1534/genetics.112.140343
Manuscript received March 8, 2012; accepted for publication May 24, 2012 1Present address: UMR CNRS 5558, Biométrie et Biologie évolutive, UCB Lyon 1,
Bât. Grégor Mendel, 43 Boulevard du 11 Novembre 1918, 69622 Villeurbanne Cedex, France.
L12e2U (2)
(Kimura and Maruyama 1966), whereUis the overall rate of deleterious mutation per diploid genome per generation. This simple formula is a classic result of evolutionary genet-ics and appears in almost every textbook on the subject.
It has previously been estimated that U is considerably greater than one in humans (Kondrashov and Crow 1993; Eyre-Walker and Keightley 1999; Nachman and Crowell 2000) and may be as high as 10 (Reed et al.2005). Under Crow’s (1970) definition of the mutation load and a viability selection model, the fraction of individuals that fail to repro-duce,u, is predicted to be considerable; for example, ifUis as high as 3,u=1–e23= 95%. However, previous estimates
of Uhave relied on indirect estimates of the mutation rate, based on the neutral divergence between human and chim-panzee, and inaccurate estimates of the proportion of sites in the genome that are subject to natural selection (Kondrashov and Crow 1993; Eyre-Walker and Keightley 1999; Nachman and Crowell 2000). The mutation rate per nucleotide site in humans (m) has recently been directly estimated by compar-ing the genome sequences of offsprcompar-ing and their parents. Three studies (Awadallaet al.2010; Durbinet al.2010; Roach et al.2010) have yielded consistent estimates, with a mean of m = 1.1 · 1028. Assuming a diploid genome of 6 · 109
nucleotides, each newborn therefore receives66 new single nucleotide mutations from its parents. To estimateU, we need to multiply this figure by the fraction of mutations that are deleterious (z) (Kondrashov and Crow 1993). Comparisons of the human and mouse genomes and the human and macaque genomes suggest that 5–6.5% of sites are subject to some degree of purifying selection (Meaderet al.2010; Lindblad-Toh et al. 2011; Mouse Genome sequencing Consortium 2002). However, the level of conservation, and hence z, was not explicitly estimated in these analyses, making it
dif-ficult to estimateU. A more formal analysis has estimatedzby comparing the human–chimp nucleotide divergence for trans-posable element (TE) remnants, which appear to evolve largely neutrally (Lunter et al. 2006; Meader et al. 2010), with the divergence for the remainder of the genome (Eory et al.2010). The non-TE fraction evolves at 94.3% the rate of the TE fraction, suggesting that 5.7% of non-TE mutations are deleterious and removed by natural selection. The non-TE fraction constitutes 55% of the genome (Cordaux and Batzer 2009), so an estimate ofU = 66·0.55 ·0.057 = 2.1. This is an underestimate, because some TEs are subject to selection (Brosius 2003) and we have disregarded inser-tion and deleinser-tion mutainser-tions, which occur at 0.05–0.1 the rate of single nucleotide mutations (Nachman and Crowell 2000; Kondrashov 2003) and are more likely to be delete-rious. Furthermore, we have ignored adaptive mutations, which leads to an underestimate of the proportion of sites in genome that are subject to negative selection.
Our estimate ofUis similar to previous estimates, but this is largely coincidental, since those analyses generally
con-sidered only the rate of deleterious mutation in protein cod-ing genes (Eyre-Walker and Keightley 1999; Nachman and Crowell 2000). If we calculate the deleterious mutation rate for protein-coding sequences using a recent estimate for the number of genes and the mutation rate we obtain a much smaller estimate. There are estimated to be20,000 genes in the human genome of average length 1500 bp;70% of mutations in protein coding genes are nonsynonymous and the mean level of constraint (i.e., the proportion of the mutations that are deleterious) is estimated to be0.75 at nonsynonymous sites (Eoryet al.2010). This yields an esti-mate of 0.35 deleterious nonsynonymous mutations per dip-loid genome, which is substantially smaller than previous estimates (Eyre-Walker and Keightley 1999; Nachman and Crowell 2000), principally because recent estimates of the mutation rate and the number of protein coding loci are lower than previous estimates.
Our conservative estimate of U = 2.1, which includes mutations in coding and noncoding DNA, predicts that f = 12e22.1= 88% if mutations act independently;i.e.,
88% of the population is predicted to fail to reproduce as a consequence of recurrent deleterious mutation under a vi-ability selection model (Equation 2). Furthermore, each indi-vidual would have to have an average of 1/(120.88) = 8.3 offspring, and since there are two sexes in humans, each fe-male would have to have at least 16 children to maintain the population size. Such a high frequency of genetic death is implausible in humans, particularly if many individuals fail to reproduce for nongenetic reasons. This is the muta-tion load paradox (Kondrashov and Crow 1993; Eyre-Walker and Keightley 1999; Nachman and Crowell 2000; Reed and Aquadro 2006; Bartonet al.2007; Charlesworth and Charlesworth 2010).
A number of factors can lead to a reduction in the mutation load (Agrawal and Whitlock 2012), two of which have been discussed in relation to the problem in humans. First, it has been suggested that many genetic deaths occur in the cell lineages leading to the gametes (Reed and Aquadro 2006) and prior to birth, since many pregnancies spontane-ously abort at an early stage (Wanget al.2004). However, this can explain only a small proportion of the mutation load, because the fraction of sites in the genome effectively selected in germ-line cell lineages is likely to be small, and most spon-taneous abortions occur for nongenetic reasons or because of major genetic defects (Nagaishiet al.2004), which are not included in our calculation ofu. Second, the mutation load can be reduced by synergistic epistasis, such that the com-bined effects of deleterious mutations are more severe than their independent effects (Kimura and Maruyama 1966; Crow and Kimura 1979). However, there is little em-pirical evidence that synergistic epistasis is more frequent than diminishing returns epistasis (Kouyos et al. 2007; Halligan and Keightley 2009), which has the opposite effect on the load.
fertility. Under fertility selection, in which fitnesses are absolute, the load is the reduction in fertility relative to that of a mutation-free individual, not the proportion of individuals that fail to have descendants in the next generation. Definingxas the number of offspring that a del-eterious mutation-free individual can produce, the average number of offspring per individual is z = x e2U, since the
meanfitness of the population ise2U. Each offspring has two
parents, so z = 2 when the population size is stationary. Hence, if x . 2/e2U, the population is expanding and
potentially at a rate such that u 0. On the other hand if x ,2/e2Uthe population is contracting and u may
ap-proach 1 for smallx. Therefore, the proportion of individuals that fail to have offspring depends both on the deleterious mutation rate and x. The rate of deleterious mutation that can be tolerated is therefore limited byx, but unfortunately, the value ofxis not known with any degree of certainty. To prevent population decline x must be greater than 16 in humans if selection acts solely on absolute fertility differ-ences. Agrawal and Whitlock (2012) have argued that x may substantially exceed 16, since human family sizes can be large in modern societies and males can potentially have many offspring by mating with multiple females. However, reproductive potential may have been much more limited in ancestral human populations. In hunter–gatherer societies, which may have reproductive patterns similar to ancient hominid populations, females breastfeed their offspring for several years; this suppresses ovulation and leads to an av-erage interbirth interval of approximately 3 years (Eaton et al.1994). Since hunter–gatherer females typically reach menarche at16 years and menopause at47 years (Eaton et al. 1994), they have the potential to produce only11 children, and actual average family size is6 live births per female (Eaton et al. 1994). Since the ages of menarche, menopause, and weaning are probably under stabilizing se-lection in such populations, and close to their optima, it is difficult to envisage howxcould be much greater than 11 offspring for hunter–gatherer females. Fertility selection could potentially be stronger in males, if males can mate with several females. However, humans seem to have been largely monogamous, at least over the last million years (Labudaet al.2010), and this trait is also likely to be under stabilizing selection. It therefore seems difficult to explain the mutation-load paradox in humans by assuming that se-lection acts largely on fertility, given what is known about human reproductive biology in extant populations.
Here we examine an alternative explanation for how humans can tolerate their high rate of harmful mutation. Wallace (1970) noted that the classic formulation of the load implicitly assumes that selection acts upon absolute
fitness differences, such that the effect of a mutation in one individual is independent of the genotypes of other indi-viduals in the population. Examples of mutations falling into this category are those that reduce cold tolerance or completely penetrant lethal mutations that knock out developmental pathways. However, Wallace argued that
if selection occurs via competition between individuals within a species, then the proportion of individuals that fail to survive or reproduce depends on the variation in fitness between individuals, not the difference infitness between the population mean and a deleterious mutation-free individual, as in Equation 1 (Crow 1970). The consequences of recurrent deleterious mutation for the magnitude ofumight therefore be much smaller than suggested by Equation 2 under a relative
fitness model. Similar arguments have been made by Sved et al.(1967) in relation to the number of balanced polymor-phisms that can be maintained in a population, and by Ewens (1970) in relation to the substitution load.
Wallace (1970) argued that the proportion of individ-uals failing to reproduce is significantly reduced under a relative fitness model compared to the prediction from the classic calculation of the load, but he did not demonstrate this either theoretically or empirically. Here, we calculate the proportion of individuals that fail to have an adult descendant in the next generation under a rela-tive fitness model. We refer to the fraction of nonrepro-ducing individuals under this model as ur, and under the old definition of load under a viability selection model (Equation 2), asua.
Models
Consider a diploid organism with a genome containing M loci, each subject to deleterious mutation at rate u. Assume that mutations are not completely recessive and that their fitness effects in heterozygous individuals (s) are sufficiently strong that mutant alleles segregate only in heterozygous form. Assuming free recombination be-tween loci, the average frequency of a deleterious muta-tion is expected to be u/s. An individual will therefore carry 2Mu/s=U/sdeleterious mutations, on average. In-formation on the rate and distribution offitness effects of deleterious mutations suggests thatU/s.20 (Lohmueller et al.2008; Charlesworth and Charlesworth 2010), so the number of deleterious mutations per individual is expected to be approximately normally distributed with a variance equal to its mean. Assuming that the fitness effects of mutations are multiplicative, then the fitness of an individual carryingkmutations is w(k) = (12s)k,
andfitness is approximately lognormally distributed with a location parameter m =U/s Log(12s) and a squared scale parameter s2=U/s(Log(12s))2.
Viability selection
the case, for example, if individuals compete for somefinite resource that limits population size. An individual’sfitness is then determined both by its own genotype and the geno-types of other individuals. If all individuals have the same
fitness then individuals can fail to reproduce by chance. However,urincreases if there is variation infitness, because some individuals will have greater reproductive success than average, and others will have few or no surviving offspring. The fraction of nonreproducing individuals in this model can be calculated as follows. The proportion of offspring in the next generation contributed by a zygote withkmutations is w9ðkÞ ¼wðkÞ=w, wherew is the mean ofw(k), and the dis-tribution ofw’is lognormal withs2=U/s (Log(12s))2. We
assume that the population size is stationary, so the number of offspring to which an individual contributes is Poisson distributed with a mean of 2. The proportion of individuals leavingxdescendants is therefore
QðxÞ ¼
Z N
0
Dðw9ÞPð2w9;xÞdw; (3)
whereP(m,x) is the Poisson distribution with a mean ofm andD(w9) is the distribution ofw9. The probability of a cou-ple producing no offspring is ur=Q(0).
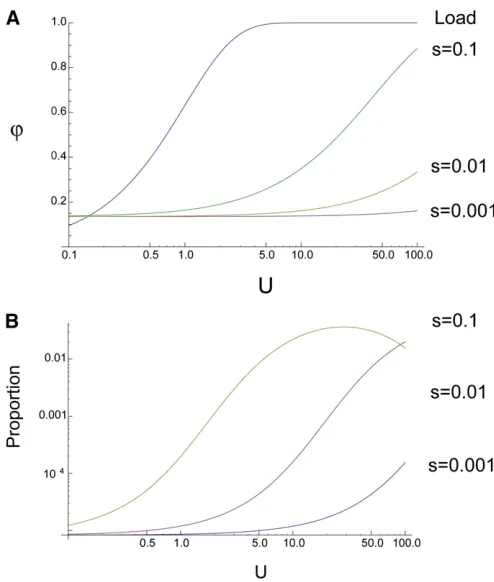
Evaluation of Equation 3 shows thaturincreases as both the genomic deleterious mutation rate and the strength of selection on a new mutation increase (Figure 1A). However,
uris generally substantially lower thanua(calculated using Equation 2), and approaches ua only if selection is very strong and the deleterious mutation rate very high. For ex-ample, if we assume, unrealistically, that every new muta-tion in the human genome is deleterious (i.e.,U= 66) and s= 1%uris only 28% whereasuais close to 100%.
The fraction of nonreproducing individuals has a minimum value, which represents the probability that an individual has no offspring by chance alone. We assume a stationary population size, so the mean number of offspring per individual is 2, and therefore the chance of an individual having no offspring ise22= 0.14. This component is not
included inua. The proportion of nonreproducing individ-uals explained by selection alone is (ur2e22)/(12e22),
which is lower thanurand hence even lower thanua(see below).
Although the predicted proportion of nonreproducing individuals is small under a relative fitness model, it is important to check that the model does not predict the existence of super-fit individuals, since even the most successful individuals have limited reproductive potential. We investigated this by estimating the proportion of individuals that have.10 offspring by evaluating Equation 3 for a range of U and s values, summing the result for x.10. It is evident that the proportion is generally small and consistent with levels of reproduction seen in humans (Figure 1B).
The proportion of individuals having no descendants in the next generation is smaller under a relative than absolute
fitness model becauseuris determined by the variance in
fitness among individuals, and this is generally small. Unless the deleterious mutation rate is very high and the selection strength against each deleterious mutation very strong, the model predicts that the fittest individuals (or couples) are not muchfitter than the leastfit individuals (Figure 2). For example, if U = 10 and s = 0.01 and we scale fitness to a mean of 1, then 97% of individuals have relativefitnesses between 0.5 and 2.
Figure 1 The fraction of nonreproducing individuals, ur, (A) and the
proportion of couples that have more than 10 offspring (B) plotted as a function of the deleterious mutation rate (U) and the strength of selec-tion against a deleterious mutaselec-tion (s).
Other models of selection
In the model described above, we calculated ur assuming viability selection since ua is equal to the mutation load under this model, and the consequences of recurrent dele-terious mutation are therefore comparable under relative and absolute fitness models. However, it is also of interest to calculateurunder a fertility selection model. If individu-als are free to interbreed, rather than forming monogamous relationships, then the proportion of offspring produced by an individual with kmutations is w9ðkÞ ¼wðkÞ=w and rela-tivefitness is lognormally distributed with a mean of 1 and a squared scale parameter ofs2=U/s(Log(12s))2. Since
we assume that the population size is stationary each indi-vidual will contribute to an average of two offspring in the next generation, so an individual withkmutations will con-tribute to a Poisson discon-tributed number of offspring with a mean of 2w9(k). The proportion of the population leaving xoffspring is therefore as given by Equation 3.
To investigate the consequences of monogamy let us assume that there is random mating and that the fertility of a couple is a function of the total number of deleterious mutations carried by the couple. In this case the proportion of offspring contributed by a couple to the next generation is w9ðkÞ ¼wðkÞ=w, which is lognormally distributed with a squared scale parameter s2= 2U/s (Log(1 2s))2. Since
we assume that the population is stationary each couple is expected to have two offspring. The proportion of couples leaving x offspring is therefore given by Equation 3, but D(w’) has a squared scale parameter of s2 = 2U/s
(Log(1 2 s))2 rather than s2 = U/s (Log(1 2 s))2; i.e.,
the mutation rate is effectively doubled by considering couples rather individuals.
For completeness, let us consider an asexual organism with discrete generations. Each generation, an individual can have several offspring, but the carrying capacity of the environment is such that the population is reduced to its former size before the next round of reproduction. Although asexual, we ignore the complication of Hill–Robertson in-terference, so the average frequency of a deleterious mu-tation is expected to be u/s as above. As before, the contribution of an individual with k mutations to the next generation isw9ðkÞ ¼wðkÞ=w. Hence relativefitness,w9, is lognormally distributed with a mean of one and a squared scale parameters2=U/s(Log(12s))2. However, because
there is no sex, an individual is expected to have only one adult descendent, on average, in the next generation rather than two if population size is stationary. The proportion of the population leavingxoffspring is therefore:
QðxÞ ¼
Z N
0
Dðw9ÞPðw9;xÞdw: (4)
Let us refer to the three models above as MF (monogamy with fertility selection), SEX (all models involving sex except MF) and ASEX (asexual). The proportion of nonreproducing
individuals,ur= Q(0), under these three models is shown in Figure 3. As expected, given the difference in the effective mutation rate between the two models, ur under SEX is always lower than that under MF. The value of ur under the ASEX model is generally higher than under either MF or SEX; this is largely due to the greater proportion of indi-viduals having no offspring at low mutation rates under the ASEX model, since each individual is expected to have only one descendant, not two as under the SEX models. If we remove the effect of chance by calculatingurattributable to selection alone as (ur–e22)/(1–e22) for the MF and SEX
models and (ur–e21)/(1–e21) for the ASEX model, then
wefindurexplained by selection is identical for the SEX and ASEX models and consistently lower than for the MF model (Figure 4).
Figure 3 The fraction of nonreproducing individuals,ur, under various
Recessive mutations
The analysis above has assumed that mutations are not completely recessive and sufficiently strongly selected that we need consider only the selection against them when they are heterozygous. Let us now consider the value ofur pre-dicted under a model of recessive mutations. We consider a model in which selection is due to viability, or equivalently, fertility with free interbreeding. If the fitness of the three genotypes are 1, 1–2hs, and 1–2sthen Kimura (1964) has shown that the time that a new mutation spends at fre-quency xis
fðx;S;hÞ ¼e2
2Shx2Sð122hÞx2
xð12xÞ
R1
x e2ShqþSð122hÞq 2
dq
R1
0e2ShqþSð122hÞq
2
dq; (5)
where S= 4Nes andNeis the effective population size. To
estimateur, we need to know the expected number of loci for which an individual is homozygous for the recessive al-lele. This is
RrðS;QÞ ¼Q
Z 1
x¼0
fðx;S;0Þx2dx; (6)
whereQ= 4MNeuandMis the number of loci.
The expected number of loci that are expected to be heterozygous for a semidominant mutation is
RsðS;QÞ ¼Q
Z 1
x¼0
fðx;S;1=2Þ2xð12xÞdx; (7)
which is approximately 2U=s¼2Q=S:Evaluation of Equa-tions 6 and 7 suggests that the average number of homozy-gous recessive loci is between 25% and 50% of the number of heterozygous semidominant loci (assuming equal num-bers of loci and mutation rates) (Table 1). This can also be seen by an analytical approximation. The average frequency of a deleterious recessive mutation is approximately u ffiffiffiffiffiffiffiffiffiffiffiffiffipNe=s
p
¼upffiffiffiffip=2pffiffiffiS, where u = 4Neu and S= 4Nes, if
u 1 (Nei 1968) (note the classic formula pffiffiffiffiffiffiffiu=s applies only in infinite populations). Hence the average frequency of each deleterious mutation introduced into the population isffiffiffiffi
p p
=2pffiffiffiS, so the expected frequency of the homozygous ge-notype for each of these mutations is approximatelyp=4Sand the expected number of loci that are homozygous is
Rr9ðS;QÞ ¼Qp=4S: (8)
Comparing this against the expected number of semidom-inant loci that are heterozygous suggests that we expect approximately 8/p = 2.5 times more sites to be heterozy-gous for semidominant mutations than homozyheterozy-gous for re-cessive mutations (Table 1).
The contribution of an individual with z loci that are homozygous for a deleterious recessive to the next genera-tion isw9ðzÞ ¼wðzÞ=w. Hence the relativefitness,w9, is log-normally distributed with a mean of one and a squared scale parameter s2 =R
r(Q,S) (Log(122s))2. Since we assume
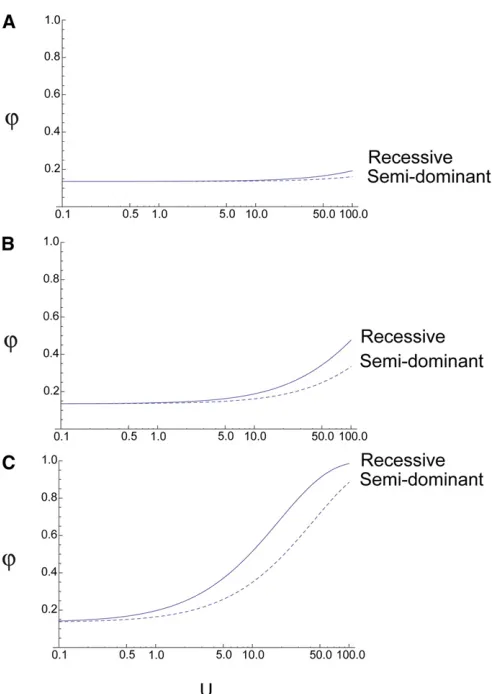
that the population size is stationary, each individual will Figure 4 The fraction of nonreproducing individuals,ur, with the effect
of chance removed: (A)s¼0.001, (B)s¼0.01, (C)s¼0.1.
Table 1 The expected number of homozygous and heterozygous loci, whenQ¼1, for recessive and semidominant mutations respectively
S recessive loci (Equation 6)No. of homozygous
Approximate no. of homozygous recessive loci (Equation 8)
No. of heterozygous semidominant loci (Equation 7)
Ratio (column 2/4)
0.01 0.50 79.0 1.0 0.50
0.1 0.49 7.9 0.98 0.50
1 0.44 0.78 0.84 0.52
10 0.073 0.078 0.20 0.37
100 0.0055 0.0079 0.020 0.28
contribute to two offspring in the next generation and so the proportion of the population leavingxoffspring is
QðxÞ ¼
Z N
0
Dðw9ÞPð2w9;xÞdw; (9)
whereP(m, x) is the Poisson distribution with a mean ofm andD(w9) is the distribution ofw9.
The value of ur, predicted under a model of recessive mutations (Equation 9), is compared to ur, under a model of semidominant mutations (Equation 3), in Figure 5. From this it can seen that with recessive mutationsuris somewhat higher than under a model with semidominant mutations for the same rate of mutation forNe= 10,000. The situation
can be reversed if Neis much smaller, but theuris always
quite similar.
Simulations
We ran a series of simulations to check our analytical approach. A population of Ndiploid individuals withM in-dependent loci was subject to recurrent deleterious muta-tion at a rateuper locus, such that 2Mu=U. Thefitness of each individual withkmutations was calculated as (12s)k.
In each generation we randomly selected pairs of individuals in proportion to their relative fitnesses (e.g., if we had four individuals with absolute fitnesses of 0.1, 0.2, 0.3, and 0.2 we would select the first individual on average 0.1/(0.1 + 0.2 + 0.3 + 0.2) = 0.125 of the time to mate). Each mating produced one offspring, with alleles drawn at random from the parental genomes (i.e., assuming free re-combination). This process of selecting individuals to form pairs was repeated until N offspring had been produced; individuals could contribute to multiple matings. The value ofurin the simulations was very close to that expected from Equation 3 suggesting that our analytical derivation of ur was satisfactory (Table 2).
Discussion
We have shown that the proportion of individuals that fail to have descendants in the next generation under a relative
fitness model is substantially lower than that predicted under an absolute viability fitness model and that species could potentially survive a mutation rate of 10’s if not 100’s of deleterious mutations per genome per generation if selec-tion was largely mediated through competiselec-tion.
The fraction of nonreproducing individuals (u) depends on both the rate of deleterious mutation and the strength of Figure 5 The fraction of nonreproducing individuals,ur, under models
with semidominant and completely recessive mutations forNe= 10,000.
(A)s= 0.001, (B)s= 0.01, (C)s= 0.1.
Table 2 Simulations under a relativefitness model
S U fr(theory) fr(simulated)(SE)
Observed average frequency over expected (SE)
0.01 0.1 0.136 0.135 (0.000) 1.03 (0.00)
1 0.138 0.138 (0.000) 1.03 (0.00)
2 0.141 0.141 (0.000) 1.03 (0.00)
5 0.149 0.148 (0.000) 1.03 (0.00)
10 0.161 0.161 (0.000) 1.04 (0.00)
0.1 0.1 0.138 0.138 (0.000) 1.00 (0.00)
1 0.164 0.163 (0.000) 1.00 (0.00)
2 0.190 0.188 (0.000) 1.01 (0.00)
5 0.258 0.254 (0.000) 1.02 (0.00)
10 0.349 0.342 (0.000) 1.06 (0.00)
selection acting on deleterious mutations. The meanfitness effect of a deleterious mutation in humans is unknown, but mutation accumulation experiments in other animals and plants suggest that nonlethal mutations havefitness effects of at most 1–20% (Keightley and Halligan 2009). However, such estimates are upwardly biased because they are gener-ally made under the unrealistic assumption that mutations have equal selective effects, implying that the true mean value ofsis likely to be substantially lower. Even assuming sas high as 20%,urwould be only 51% ifU= 5. The load from lethal mutation is expected to be much lower than that for nonlethals, since lethal mutations have been estimated to occur at about one-hundredth the rate of nonlethals (Crow and Simmons 1983).
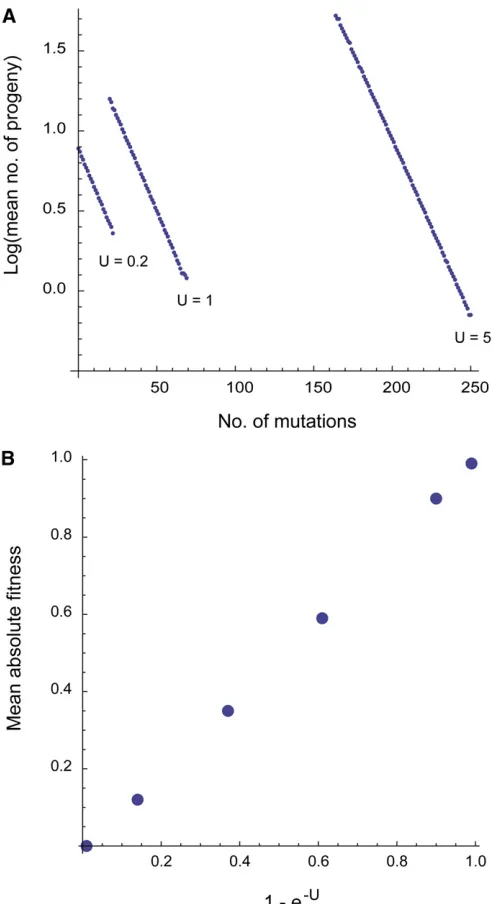
The extent to which selection is mediated through competition between conspecifics is unknown. If individuals compete for resources or mates, and competitive ability is genetically determined, then the success of an individual will depend both on its own genotype and the genotypes of its competitors. This might suggest that there is epistasis generated in a relativefitness model, and it has been shown that the mutation load can be substantially reduced if there is synergistic epistasis (Kimura and Maruyama 1966). How-ever, synergistic epistasis is not expected to be a feature of our model, since the contribution of a genotype withk muta-tions to the next generation isw9ðkÞ ¼wðkÞ=w, so log(w9(k)) is linear with respect to k. To check that epistasis is not an emergent property of our model we tabulated the number of offspring produced in our simulation (see above). As expected, the log of the mean number of offspring pro-duced by individuals withkmutations is linearly related to k (Figure 6A), demonstrating that epistasis does not emerge within this model. We also kept track of the mean absolute fitness of the population within the simulation. As expected, the mean absolutefitness ise2U. If synergistic
epis-tasis had been present then we would expect the mean abso-lutefitness to be higher than this expected value (Figure 6B). It has been suggested that sexual reproduction might be maintained because sexual species can have substantially lower mutation loads than asexual species if there is synergistic epistasis (Kimura and Maruyama 1966). IfU .1 this can be sufficient to offset the twofold cost of sex (Kondrashov 1982; Kondrashov 1988). This is known as the deterministic mutation hypothesis. However, since the overall effect of recurrent deleterious mutation on popu-lationfitness is considerably reduced, if selection is medi-ated by competition, it is likely that the conditions under which sexual species have an advantage will also be greatly reduced.
The consequences of recurrent deleterious mutation for the proportion of the population that fails to reproduce is less extreme under a relative compared to an absolute
fitness model. One might therefore expect natural selection to be weaker under a relative fitness model and that deleterious mutations would accumulate in the population. However, this is not the case: in our simulation the average
frequency of a deleterious mutation is close to the value expected under an absolute fitness model (Table 2). The average frequency of a deleterious mutation is very slightly higher than we expect, but this is likely to be due to Hill– Robertson interference.
to the fraction of nonreproducing individuals if selection acts on absolute differences under a viability selection model, as would be the case if the fitness of a genotype were inde-pendent of the genotypes of conspecifics. Iffitness depends on the genotypes of conspecifics, then the proportion of nonreproducing individuals depends on the distribution of
fitness among individuals and tends to be much lower than predicted by the absolute mutation load. Evaluation of our model, assuming plausible values for the genomic delete-rious mutation rate and strength of selection against a new mutation, suggests that the proportion of individuals that fail to reproduce is much lower than predicted by the classic formula for the absolute load, and there is no requirement for some individuals to be unrealistically fecund. Our analytical results and simulations suggest a resolution of the muta-tion load paradox by showing that a very high number of deleterious mutations can be eliminated from the population each generation and that the population can still be viable. Our results also demonstrate that one mutation does not necessarily result in one genetic death.
Acknowledgments
The authors are grateful to Austin Burt, Michael Whitlock, Aneil Agrawal, Alex Kondrashov, Liz Somerville, and anon-ymous referees for helpful discussion and comments.
Literature Cited
Agrawal, A., and M. C. Whitlock, 2012 Mutation load: thefitness of individuals in populations where deleterious mutations are abundant. Annu. Rev. Ecol. Evol. Syst. 43: (in press).
Awadalla, P., J. Gauthier, R. A. Myers, F. Casals, F. F. Hamdan et al., 2010 Direct measure of the de novo mutation rate in autism and schizophrenia cohorts. Am. J. Hum. Genet. 87: 316–324.
Barton, N. H., D. E. G. Briggs, J. A. Eisen, D. B. Goldstein, and N. H. Patel, 2007 Evolution. Cold Spring Harbor Laboratory Press, New York.
Brosius, J., 2003 The contribution of RNAs and retroposition to evolutionary novelties. Genetica 118: 99–116.
Charlesworth, B., and D. Charlesworth, 2010 Elements of Evolu-tionary Genetics. Ben Roberts, Greenwood Village, CO. Cordaux, R., and M. A. Batzer, 2009 The impact of
retrotranspo-sons on human genome evolution. Nat. Rev. Genet. 10: 691– 703.
Crow, J. F., 1970 Genetic loads and the cost of natutal selection. Mathematical Topics in Population Genetics, pp. 128–177. Springer-Verlag, New-York.
Crow, J. F., and M. Kimura, 1979 Efficiency of truncation selec-tion. Proc. Natl. Acad. Sci. USA 76: 396–399.
Crow, J. F., and M. J. Simmons, 1983 The mutation load in Dro-sophila, pp. 1–26 in The Genetics and Biology of Drosophila, edited by M. Ashburner, H. L. Carson, and J. L. Thompson. Academic Press, London.
Durbin, R. M., G. R. Abecasis, D. L. Altshuler, A. Auton, L. D. Brooks et al., 2010 A map of human genome variation from popula-tion-scale sequencing. Nature 467: 1061–1073.
Eaton, S., M. Pike, R. Short, N. Lee, J. Trussell et al., 1994 Women’s reproductive cancers in evolutionary context. Q. Rev. Biol. 69: 353–367.
Eory, L., D. L. Halligan, and P. D. Keightley, 2010 Distributions of selectively constrained sites and deleterious mutation rates in the hominid and murid genomes. Mol. Biol. Evol. 27: 177–192. Ewens, W. J., 1970 Remarks on the substitutional load. Theor.
Popul. Biol. 1: 129–139.
Eyre-Walker, A., and P. D. Keightley, 1999 High genomic delete-rious mutation rates in hominids. Nature 397: 344–347. Haldane, J. B. S., 1937 The effect of variation infitness. Am. Nat.
71: 337–349.
Halligan, D. L., and P. D. Keightley, 2009 Spontaneous mutaion accumulation studies in evolutionary genetics. Annu. Rev. Ecol. Evol. Syst. 40: 151–172.
Keightley, P. D., and D. L. Halligan, 2009 Analysis and implica-tions of mutational variation. Genetica 136: 359–369.
Kimura, M., 1964 Diffusion models in population genetics. J. Appl. Probab. 1: 177–232.
Kimura, M., and T. Maruyama, 1966 The mutational load with epistatic gene interactions infitness. Genetics 54: 1337–1351. Kondrashov, A. S., 1982 Selection against harmful mutations
in large sexual and asexual populations. Genet. Res. 40: 325– 332.
Kondrashov, A. S., 1988 Deleterious mutations and the evolution of sexual reproduction. Nature 336: 435–440.
Kondrashov, A. S., 2003 Direct estimates of human per nucleotide mutation rates at 20 loci causing Mendelian diseases. Hum. Mutat. 21: 12–27.
Kondrashov, A. S., and J. F. Crow, 1993 A molecular approach to estimating the human deleterious mutation rate. Hum. Mutat. 2: 229–234.
Kouyos, R. D., O. K. Silander, and S. Bonhoeffer, 2007 Epistasis between deleterious mutations and the evolution of recombina-tion. Trends Ecol. Evol. 22: 308–315.
Labuda, D., J. F. Lefebvre, P. Nadeau, and M. H. Roy-Gagnon, 2010 Female-to-male breeding ratio in modern humans-an analysis based on historical recombinations. Am. J. Hum. Genet. 86: 353–363.
Lindblad-Toh, K., M. Garber, O. Zuk, M. F. Lin, B. J. Parkeret al., 2011 A high-resolution map of human evolutionary constraint using 29 mammals. Nature 478: 476–482.
Lohmueller, K. E., A. R. Indap, S. Schmidt, A. R. Boyko, R. D. Hernandez et al., 2008 Proportionally more deleterious ge-netic variation in European than in African populations. Nature 451: 994–997.
Lunter, G., C. P. Ponting, and J. Hein, 2006 Genome-wide identi-fication of human functional DNA using a neutral indel model. PLOS Comput. Biol. 2: e5.
Meader, S., C. P. Ponting, and G. Lunter, 2010 Massive turnover of functional sequence in human and other mammalian genomes. Genome Res. 20: 1335–1343.
Mouse Genome Sequencing Consortium, 2002 Initial sequencing and comparative analysis of the mouse genome. Nature 420: 520–562.
Muller, H. J., 1950 Our load of mutations. Am. J. Hum. Genet. 2: 111–176.
Nachman, M. W., and S. L. Crowell, 2000 Estimate of the mutation rate per nucleotide in humans. Genetics 156: 297–304.
Nagaishi, M., T. Yamamoto, K. Iinuma, K. Shimomura, S. A. Berend et al., 2004 Chromosome abnormalities identified in 347 spon-taneous abortions collected in Japan. J. Obstet. Gynaecol. Res. 30: 237–241.
Nei, M., 1968 The frequency distribution of lethal chromosomes infinite populations. Proc. Natl. Acad. Sci. USA 60: 517–524. Reed, F. A., and C. F. Aquadro, 2006 Mutation, selection and the
future of human evolution. Trends Genet. 22: 479–484. Reed, F. A., J. M. Akey, and C. F. Aquadro, 2005 Fitting
and divergence along the human autosomes. Genome Res. 15: 1211–1221.
Roach, J. C., G. Glusman, A. F. Smit, C. D. Huff, R. Hubleyet al., 2010 Analysis of genetic inheritance in a family quartet by whole-genome sequencing. Science 328: 636–639.
Sved, J., T. E. Reed, and W. F. Bodmer, 1967 The number of balanced polymrophisms that can be maintained in a natural population. Genetics 55: 469–471.
Wallace, B., 1970 Genetic Load: Its Biological and Conceptual Aspects. Prentice-Hall, Englewood Cliffs, NJ.
Wang, J. X., R. J. Norman, and A. J. Wilcox, 2004 Incidence of spontaneous abortion among pregnancies produced by assisted reproductive technology. Hum. Reprod. 19: 272– 277.