| INVESTIGATION
Two Novel Candidate Genes for Insulin Secretion
Identi
fi
ed by Comparative Genomics of Multiple
Backcross Mouse Populations
Tanja Schallschmidt,*,†,1Sandra Lebek,*,†,1Delsi Altenhofen,*,†Mareike Damen,*,†Yvonne Schulte,*,† Birgit Knebel,*,†Ralf Herwig,‡Axel Rasche,‡Torben Stermann,*,†Anne Kamitz,†,§Nicole Hallahan,†,§
Markus Jähnert,†,§Heike Vogel,†,§Annette Schürmann,†,§Alexandra Chadt,*,†,2and Hadi Al-Hasani*,†,2
*Institute for Clinical Biochemistry and Pathobiochemistry, German Diabetes Center (DDZ), Medical Faculty, Heinrich Heine University, D-40225 Duesseldorf, Germany,†German Center for Diabetes Research (DZD), D-85764 München-Neuherberg, Germany,‡Department of Computational Molecular Biology, Max Planck Institute for Molecular Genetics, D-14195 Berlin, Germany, and§Department of Experimental Diabetology, German Institute of Human Nutrition Potsdam-Rehbruecke, D-14558 Nuthetal, Germany
ABSTRACTTo identify novel disease genes for type 2 diabetes (T2D) we generated two backcross populations of obese and diabetes-susceptible New Zealand Obese (NZO/HI) mice with the two lean mouse strains 129P2/OlaHsd and C3HeB/FeJ. Subsequent whole-genome linkage scans revealed 30 novel quantitative trait loci (QTL) for T2D-associated traits. The strongest association with blood glucose [12 cM, logarithm of the odds (LOD) 13.3] and plasma insulin (17 cM, LOD 4.8) was detected on proximal chromosome 7 (designatedNbg7p, NZO blood glucose on proximal chromosome 7) exclusively in the NZOxC3H crossbreeding, suggesting that the causal gene is contributed by the C3H genome. Introgression of the critical C3H fragment into the genetic NZO background by generating recombinant congenic strains and metabolic phenotyping validated the phenotype. For the detection of candidate genes in the critical region (30–46 Mb), we used a combined approach of haplotype and gene expression analysis to search for C3H-specific gene variants in the pancreatic islets, which appeared to be the most likely target tissue for the QTL. Two genes,Atp4aandPop4, fulfilled the criteria from our candidate gene approaches. The knockdown of both genes in MIN6 cells led to decreased glucose-stimulated insulin secretion, indicating a regulatory role of both genes in insulin secretion, thereby possibly contributing to the phenotype linked to Nbg7p. In conclusion, our combined- and comparative-cross analysis approach has successfully led to the identification of two novel diabetes susceptibility candidate genes, and thus has been proven to be a valuable tool for the discovery of novel disease genes.
KEYWORDSdiabetes; quantitative trait loci; positional cloning; candidate disease genes; haplotypes
T
YPE 2 diabetes (T2D) is a complex metabolic disease affecting nearly half a billion people worldwide (Choet al.2018). It is well established that both genetic factors and lifestyle contribute to the pathophysiology of the disease (Permutt et al.2005; Das and Elbein 2006). Genome-wide
association studies and familial linkage analyses in humans have led to the identification of.100 gene variants poten-tially associated with the pathogenesis of T2D (Dorajooet al.
2015; Fuchsbergeret al.2016). However, the known genetic variants that have been identified so far only account for a relatively small fraction of the interindividual variability in diabetes-related traits in humans, indicating that a consider-able proportion of the underlying genetic variants still re-mains to be identified (Morriset al. 2012; Schwenk et al.
2013; Tsaihet al.2014).
Mouse models have proven to be an essential experimental tool for the identification of novel disease genes and signaling pathways for human diseases (Attie et al. 2017; Kleinert
et al. 2018). Inbred strains are available that differ in their Copyright © 2018 by the Genetics Society of America
doi:https://doi.org/10.1534/genetics.118.301578
Manuscript received September 6, 2018; accepted for publication October 16, 2018; published Early Online October 19, 2018.
Supplemental material available at Figshare: https://doi.org/10.25386/genetics. 7066604.
1These authors contributed equally to this work.
prevalence toward obesity and T2D, thereby providing genetic diversity with respect to diabetes risk. In contrast to human studies, mice can be used for the introduction of targeted mu-tations or naturally occurring risk alleles with the help of well-established genetic tools, and tissues can be collected for the analysis of gene expression or functional assays (Attie et al.
2017; Kleinert et al.2018). Moreover, the ability to control the environment and short generation times in combination with large litter sizes represent further advantages that empha-size the utility of mouse models over human studies.
The New Zealand Obese (NZO) mouse strain presents features of the metabolic syndrome, including early onset hyperglycemia, hyperinsulinemia, hypercholesterinemia, hy-perlipidemia, and hypertension, in response to high-fat diet (HFD) consumption (Jürgenset al.2006, 2007; Kluthet al.
2011; Joost and Schürmann 2014). In the course of the dis-ease, 70% of the mice progress into islet cell failure and develop overt diabetes (Jürgens et al.2006). Consequently, NZO mice have been utilized in several studies as a polygenic model for obesity-driven human T2D (Joost and Schürmann 2014).
Previous linkage analyses with outbred populations derived from obese, diabetes-prone NZO and lean, diabetes-resistant mice, such as C57BL/6J, NON, and SJL, have contributed substantially to the understanding of the genetic architec-ture of T2D, and the underlying gene–diet interactions that determine the onset and progression of the disease. Several genomic regions, designated quantitative trait loci (QTL), that show linkage to disease-related phenotypes have been identified and, in some cases, subsequent positional cloning has led to the identification of causal, strain-specific gene variants including Tbc1d1,Zfp69, andIfi202b(Chadtet al.
2008; Schernecket al.2009; Vogelet al.2012). Analysis of the risk alleles, and their interaction with genetic and envi-ronmental factors in experimental mouse breeding studies, provides a relevant picture of the genetic architecture of T2D and related traits. Importantly, clinical and experimental studies have provided evidence that genes identified from mouse studies are also linked to the onset and progression of obesity, insulin resistance, and diabetes in humans (Dash
et al.2009; Schernecket al.2009; Vogelet al.2012). Despite successful positional cloning of diabetes risk genes in rodents, many causal gene variants for the majority of diabetes-related QTL are unknown and the complexity of T2D genetics is not well understood. However, current ge-nome and phege-nome databases, as well as modern bioinfor-matics resources, may be used for data mining and subsequent reduction of the number of candidate genes identified by linkage scans (Keaneet al.2011; Yalcinet al.2011).
To identify novel risk loci for obesity and T2D, we conducted crossbreeding experiments using the obese and diabetes-susceptible NZO, and two different lean mouse strains. Genome-wide linkage analysis and subsequent QTL mapping revealed two novel diabetes-related gene variants that might be involved in the regulation of insulin secretion in pancreaticb-cells.
Materials and Methods
Animals and breeding strategy
All experiments were in accordance with the National Institutes of Health guidelines for the care and use of laboratory animals, and were approved by the Ethics Committee (references: 84-02.04.2013.A118 and 84-02.04.2015.A354) of the State Min-istry of Agriculture, Nutrition and Forestry (State of North Rhine-Westphalia, Germany). Diabetes-prone NZO/Hl [NZO; German Diabetes Centre Duesseldorf (Herberg and Coleman 1977)], and diabetes-resistant 129P2/OlaHsd (129P2; German Institute of Human Nutrition, Nuthetal, Germany) and C3HeB/FeJ [C3H; Helmholtz Center Munich, Germany (Gailus-Durneret al.2005)] mice were housed at three to six mice per cage (Macrolon type III) at a constant temperature of 22°and a 12-hr light–dark cycle (lights on at 6AM). Animals had free access to food and waterad
libitum. Female NZO, and male 129P2 or C3H mice, respectively, were used to generate a F1generation (NZOx129P2; NZOxC3H), and male F1offspring were subsequently backcrossed with NZO females (N2: NZOxF1). For each backcross generation, N2(NZOx F1(NZOxC3H)) and N2(NZOx F1(NZOx129P2)), 300 males and 300 females were generated, designated N2(NZOxC3H) and N2(NZOx129P2). For the introgression of heterozygous C3H alleles on chromosome 7 on the NZO background, repeated backcrosses were performed until the generation of an N5/N6 generation. Subsequently, intercrosses (brother–sister breeding) were conducted to produce homozygous C3H alleles on chromo-some 7. Homozygous N5F1and N6F1mice with the same geno-type were intercrossed to obtain 100% homozygous mice in the N5F2/N6F2generation, which were metabolically phenotyped in this study. After weaning at the age of 21 days, all experimental animals received a HFD containing 45 kcal% fat, 20 kcal% pro-tein, and 35 kcal% carbohydrates with 4.73 kcal/gm energy (D12451; Research Diets, New Brunswick, NJ). All backcross (week 21 of age) and recombinant congenic strains (RCSs) (week 17 of age) mice were fasted for 6 hr before they were killed by cardiac puncture under isoflurane anesthesia. For the collection of the pancreatic islets, parental and RCS mice were killed at the age of 6 weeks by cervical dislocation. Due to severe
b-cell loss with the progression of the disease in parental NZO and NZO allele carriers for chromosome 7, we could not collect sufficient islets from older animals.
Genotyping
Genomic DNA was isolated from mouse tail tips using the InViSorb Genomic DNA Kit II (Invitek, Berlin, Germany). The genotyping was performed by Kompetitive Allele-Specific PCR using appropriate SNP assays (LGC Genomics, Teddington, UK). Informative SNP markers [118 for N2(NZOx129P2) and 115 for N2(NZOxC3H)] polymorphic between NZO and 129P2 or C3H, respectively, were selected at a distance of 20 Mbp for each chromosome.
Body weight and body composition
15 by noninvasive nuclear magnetic resonance spectroscopy (EchoMRI-100 System; Echo Medical Systems, Houston, TX).
Blood glucose levels, determination of T2D prevalence, and survival rate
Blood glucose was measured weekly in the morning between 8 and 10AMusing a CONTOUR XT glucometer (Bayer Con-sumer Care AG, Leverkusen, Germany). T2D prevalence was calculated by determining the cumulative number of diabetic animals (N2: blood glucose.300 mg/dl for 3 consecutive weeks) and expressing the percentage of affected mice in relation to the total number of animals. The survival rate (living animals/total animals) was calculated accordingly.
Analysis of plasma insulin and C-peptide
Insulin and C-peptide levels were measured in plasma samples (N2: week 21 of age and RCS: week 17 of age) by ELISA (Insulin: Mouse Ultrasensitive ELISA Kit; DRG, Marburg, Germany; C-Peptide: Mouse C-Peptide ELISA Kit; CrystalChem, Chicago, IL) according to the manufacturer’s recommendations.
Pancreatic islet isolation
At the age of 6 weeks, experimental mice were killed by cervical dislocation and the pancreatic islets were isolated by ductal collagenase perfusion of the pancreas, as previously described (Yesil et al. 2009). Subsequently, the islets were cultivated overnight in CMRL (Connaught Medical Research Laborato-ries) islet medium (see cell culture) at 37°with 5% CO2.
RNA extraction and microarray analysis
Total RNA from pancreatic islets (collected from 6-week-old animals) and MIN6 cells was isolated using the RNeasy mini kit (QIAGEN, Valencia, CA) including DNase digestion, according to the manufacturer’s instructions. For microarray analysis of the pancreatic islets, the quality of the isolated RNA was tested using an RNA 6000 nano kit (Agilent Tech-nologies, Taufkirchen, Germany). Only samples with RNA integrity number (RIN) values.8 were selected for the sub-sequent microarray analysis. Genome-wide expression anal-yses (n= 5 per genotype) were performed with 150 ng RNA according to the Ambion WT Expression Kit and the WT Terminal Labeling Kit (Thermo Fisher Scientific, Darmstadt, Germany). All protocol steps were monitored using an RNA 6000 nano kit (Agilent). Mouse Gene 1.0 ST arrays were hybridized with labeled complementary RNA samples. Data were collected with the GeneChip scanner 3000 7G and anal-yses of primary data were performed with the GDAS 1.4 package, [Affymetrix, (Thermo Fisher Scientific)]. Data were analyzed with Expression ConsoleTM v1.1 and Transcrip-tome Analysis ConsoleTMv2.0 (Affymetrix) as previously de-scribed (Knebelet al.2015).
cDNA synthesis and quantitative real-time PCR
cDNA was synthesized using the GoScript Reverse Transcrip-tase Kit (Promega, Madison, WI) using 500 ng RNA. For
quantitative real-time (qRT)-PCR, the GoTaq qPCR Master Mix (Promega) on a QuantStudio 7 Flex PCR System (Applied Biosystems, Foster City, CA) was used. For the three genes
Ffar2, Ffar3, and Zfp719, TaqMan probes (Thermo Fisher Scientific) were used. TATA box binding protein (Tbp) for pancreatic islets andb-actin(Actb) for MIN6 cells was used as an endogenous control, and gene expression was
quanti-fied using the 22DDCTmethod (Livak and Schmittgen 2001).
Cell culture
Isolated pancreatic islets were cultivated in CMRL medium (Thermo Fisher Scientific) containing 15% fetal calf serum, 0.05 mM b-mercaptoethanol (Thermo Fisher Scientific), 1% penicillin/streptomycin, 10 mM glucose, and 39.2 mM NaHCO3. MIN6 cells (a gift from S. Baltrusch from the Uni-versity of Rostock, Germany) were cultured in Dulbecco’s Modified Eagle Medium (Thermo Fisher Scientific) with 25 mM glucose, supplemented with 10% fetal calf serum and 1% penicillin/streptomycin. Both cell types were con-stantly cultivated at 37°with 5% CO2.
Electroporation of MIN6 cells
For the knockdown ofAtp4aandPop4, MIN6 cells were electro-porated with small interfering RNA (siRNA) oligonucleotides using the SF Cell Line 4D-Nucleofector kit (Lonza, Cologne, Germany) in combination with the 4D-Nucleofector system (Lonza). Cells were electroporated according the Amaxa 4D-Nucleofector protocol for SH-SY5Y cells provided from Lonza (bio.lonza.com/go/op/290). Two million cells from each cu-vette were split into six wells of a 12-well plate; three of the wells were used for glucose-stimulated insulin secretion (GSIS) (technical triplicates) and the other three for RNA isolation to confirm the knockdown efficiency by qRT-PCR. The medium was changed 1 day after the electroporation.
GSIS assay in MIN6 cells
The GSIS assay was executed 2 days after the electroporation of siRNA. For the assay, MIN6 cells (cultivated in 12-well plates) were washed three times with 500ml of Krebs-Ringer HEPES (KRH) buffer (containing 15 mM HEPES, 5 mM KCl, 120 mM NaCl, 24 mM NaHCO3, 1 mM MgCl2, 2 mM CaCl2, and 1 mg/ml BSA). After starvation for 1 hr in glucose-free KRH buffer, the medium was removed and cells were incu-bated for 2 hr in 500ml KRH buffer either containing no or 25 mM glucose, respectively. Subsequently, the supernatant was collected for the determination of the insulin concentra-tions. All incubation steps were conducted at 37°with 5% CO2.Finally, cells were detached in lysis buffer [containing 20 mM Tris, 150 mM NaCl, 1 mM EGTA, 1 mM EDTA, and 1% (v/v) Triton-X-100] and protein content was determined by bicinchoninic acid (BCA) assay (Pierce Chemical, Rockford, IL) for normalization of insulin levels.
Linkage analysis
linkage analysis. Distributions of phenotypic data were tested for normality by the use of the D’Agostino-Pearson omnibus test (GraphPad Software, La Jolla, CA). All data sets that were not normally distributed were log2 transformed. QTL analyses including the genetic map, genotyping errors, and linkage between individual traits and genotypes were per-formed on N2(NZOx129P2) (290 males and 307 females) and N2(NZOxC3H) (329 males and 310 females) mice using the R/qtl 1.40-8 package (Broman and Sen 2009) of R (ver-sion i386 3.3.2). Single-QTL genome scans were performed by interval mapping with the Expectation-maximization algo-rithm (Lander and Botstein 1989). The significance thresholds (P,0.05) for linkage were estimated by 1000 permutations (Lander and Kruglyak 1995).
Sequence and haplogroup analysis
Data for mouse SNPs and SNP–gene assignments were from the Sanger Welcome Trust Institute Database (https://www. sanger.ac.uk/sanger/Mouse_SnpViewer). Coding nonsynon-ymous SNPs were analyzed for their potential impact on protein function using the“Sorting Tolerant From Intoler-ant”algorithm (http://sift.jcvi.org; (Kumaret al.2009). As described before (Schmidtet al.2008), intervals of 250 kbp were selected for the determination of the frequency of polymorphic SNPs between the different mouse strains, and a threshold of 100 SNPs /window was chosen to distin-guish the QTL into regions that are identical-by-descent (IBD, genomic regions that are identical between individu-als due to descent from a common ancestor without re-combination) and polymorphic (non-IBDs) between the different mouse strains. For the determination of the total number, all SNPs annotated for the C57BL/6J reference genome with calls for C3H/HeJ, 129P2/OlaHsd, and NZO/HlLtJ were counted.
Statistical analysis
Data are presented as mean values6SEM. Statistical signif-icance was reported by two-tailed Student’st-test or one/ two-way ANOVA followed by post hoc Bonferroni test as appropriate. Differences were considered significant when
P , 0.05. Statistical analysis was conducted by GraphPad Prism 7 (GraphPad Software).
Data availability
Supplemental Material, File S1 contains R/qtl formatted mapping information, including mouse identifiers, phenotype information, and SNP marker identifiers, locations, and ge-notypes (A = NZO/NZO, and H = NZO/C3H or NZO/129P2) from both N2 (NZOxC3H and NZOx129P2) populations. File S2 contains the sequences of all qRT-PCR primers and siRNAs, as well as information about the SNP markers used for genotyping of RCS.NZO.C3H-Nbg7mice. File S3 con-tains further data supporting material. Microarray data are available under accession number GSE117553. Supplemen-tal material available at Figshare:https://figshare.com/s/ 3666e6e39dced467c48f.
Results
Diverging prevalence for obesity and T2D in the parental strains
Wefirst phenotyped the experimental animals by measuring basic metabolic features of male NZO, 129P2, and C3H mice on a HFD with 45% calories from fat. One week after weaning at the age of 4 weeks, NZO mice started to exhibit significantly higher body weight compared to C3H and 129P2 mice (NZO 25.4 60.6 g, 129P2 19.960.7 g, and C3H 15.960.4 g; Figure 1A). At week 20, NZO mice had gained substantially more weight than C3H and 129P2 mice (NZO 62.162.3 g, 129P2 37.661.2 g, and C3H 44.060.4 g), most of it due to increased body fat (week 15 of age: NZO 22.561.2 g, 129P2 6.760.7 g, and C3H 10.760.3 g). Moreover, in contrast to the lean strains, NZO mice developed early-onset hypergly-cemia (.300 mg/dl) and hyperinsulinemia. On average, at the age of 6 weeks, NZO mice started to exceed the T2D threshold (. 300 mg/dl), whereas C3H and 129P2 mice maintained blood glucose levels constantly below 190 mg/dl (Figure 1B). The most significant differences in glycemia be-tween NZO mice and the lean strains were observed at week 15, when NZO mice exhibited on average 361632 mg/dl blood glucose, compared to 16068 mg/dl observed in C3H and 14266 mg/dl in 129P2 mice. In week 8, 16-hr fasting plasma insulin levels were about threefold higher (P ,
0.001) in NZO (1.0 mg/liter60.13 mg/liter) compared to C3H (0.2360.04mg/liter) and 129P2 (0.3760.06mg/liter) mice. At 21 weeks of age, 6-hr fasting plasma insulin levels were significantly lower in the 129P2 strain (1.060.2mg/ liter) compared to levels in the NZO (6.261.1mg/liter) and C3H (4.960.7mg/liter) strains.
Genome-wide linkage analysis on both N2populations revealed 30 novel T2D-associated QTL
Two F1populations were generated by mating NZO females with either 129P2 or C3H males. All males from both F1 generations were metabolically phenotyped. As expected, the phenotypic data from both F1generations, including body weight and blood glucose levels, were intermediate to those from the parental mice (Figure S1 and File S3). In general, F1(NZOxC3H) males exhibited higher mean blood glucose levels compared to F1(NZOx129P2) males [week 20 of age: F1(NZOxC3H) 377623 mg/dl and F1(NZOx129P2) 1986 23 mg/dl, P,0.001], whereas body weight development was similar between the two F1generations. Subsequently, two N2populations were generated by breeding female NZO mice with males from the F1(NZOx129P2) cross or from the F1(NZOxC3H) cross.
N2populations (Figure S2 and File S3). Compared to the female N2(NZOx129P2) population, females from the N2-(NZOxC3H) backcross exhibited higher blood glucose levels [week 20 of age, N2(NZOxC3H) 194 64 mg/dl and N2-(NZOx129P2) 141 6 2 mg/dl, P , 0.001, Figure S2C] and body weight [week 20 of age, N2(NZOxC3H) 61 6 1 and N2(NZOx129P2) 5161 g,P,0.001, Figure S2D]. Also, for the N2males of the N2(NZOxC3H) population, we measured higher blood glucose levels [week 20 of age: N2-(NZOxC3H) 350 69 mg/dl and N2(NZOx129P2) 2526 7 mg/dl, P , 0.001, Figure S2A] but lower body weight values compared to males from the other backcross [week 20 of age: N2(NZOxC3H) 68 61 g and N2(NZOx129P2) 7361 g,P,0.001, Figure S2B].
For genetic linkage analysis, as described in theMaterials and Methods, a genome-wide SNP panel was used to interro-gate each animal (males and females) at.100 loci. For the N2(NZOxC3H) cross, a total number of 25 QTL (LOD.4) were mapped, compared to only five QTL identified in the N2(NZOx129P2) cross (File S3 and Table S1). Details on the major QTL from both male N2populations, which revealed significance for several weeks, are shown in Table 1.
Major T2D modifier QTL on chromosomes 4, 7, and 15
Several loci revealed significant linkage with body weight, blood glucose, or plasma insulin for several consecutive weeks in life (Table 1). In the N2(NZOx129P2) population, the strongest QTL for blood glucose levels was identified on chro-mosome 4 at weeks 12–20 (week 17 of age: LOD 7.4 at 44 cM, Figure 2A), this locus was designated Nbg4d(NZO
blood glucose on distal chromosome 4). The NZO allele for
Nbg4dwas associated with lower blood glucose levels (Nbg4d is associated with decreased blood glucose levels in NZO-allele carriers).Nbg4drevealed only suggestive linkage (LOD 2.1 at 47 cM) with plasma insulin levels measured at week 21. Homozygous allele carriers exhibited significantly lower lev-els of plasma insulin compared to heterozygous allele carriers (Nbg4dNZO/NZO8.3mg/liter60.6 andNbg4dNZO/12911.3mg/ liter 60.8, D: 3 mg/liter, P= 0.003). Starting from week 15 of age, another QTL for blood glucose (Nbg4p, NZO blood glucose on proximal chromosome 4) appeared at a more proximal position on chromosome 4 (weeks 17 of age: LOD 5.8 at 28 cM, Figure 2A) in the N2(NZOx129P2) population. Similar to what was observed forNbg4d, the NZO allele for
Nbg4pwas associated with lower blood glucose levels (week 17 of age:Nbg4pNZO/NZO23469 mg/dl andNbg4pNZO/129 307611 mg/dl,D74 mg/dl,P,0.001).
Also in the N2(NZOxC3H) population, a strong QTL for blood glucose levels mapped to distal chromosome 4 at weeks 14–20 (week 20 of age: LOD 6.6 at 42 cM, Figure 2C), thus the locus was likewise designated Nbg4d. As ob-served in the N2(NZOx129P2) cross, homozygous NZO allele carriers exhibited lower mean blood glucose levels compared to the heterozygous NZO/C3H allele carriers for Nbg4d
(week 20 of age: Nbg4dNZO/NZO 291 6 11 mg/dl and
Nbg4dNZO/C3H 389615 mg/dl, D: 98 mg/dl, P,0.001). In the N2(NZOxC3H) population,Nbg4dwas further signifi -cantly linked with plasma insulin levels (week 21 of age: LOD 4.2 at 45 cM). Different from the N2(129P2xNZO) population, homozygous allele carriers exhibited higher plasma insulin
levels compared to heterozygous allele carriers (week 21 of age: Nbg4dNZO/NZO 10.860.9mg/liter andNbg4dNZO/C3H 7.2 6 0.7 mg/liter, D: 3.6 mg/liter, P = 0.005). A more proximal locus on chromosome 4 from the N2(NZOxC3H) population (Nbw4, NZO body weight on chromosome 4) revealed significant linkage with body weight at weeks 6–20 (week 19 of age: LOD 8.2 at 32 cM, Figure 2C). Homo-zygous allele carriers gained on average more body weight compared to heterozygous allele carriers for Nbw4 (week 19 of age: Nbw4NZO/NZO 69.1 6 0.7 g and Nbw4NZO/C3H 62.760.7 g,D: 6.4 g,P,0.001).
The most striking linkages with blood glucose (week 10 of age: LOD 13.3 at 12 cM) and plasma insulin levels (week 21 of age: LOD 4.8 at 17 cM) in the N2(NZOxC3H) population were detected on proximal chromosome 7 (Nbg7p,NZO blood glu-cose on proximal chromosome 7). The linkage ofNbg7pwith blood glucose levels was already significant at 3 weeks of age and persisted until the end of the study. In addition, this locus was further linked to body weight at weeks 12–20 (week 17 of age: LOD 7.4 at 17 cM, Figure 2B) and lean mass at week 15 (LOD 8.6 at 11 cM; File S3 and Table S1). Homozygous NZO allele carriers for Nbg7p exhibited on average higher blood glucose levels (week 10 of age:Nbg7pNZO/NZO3696 12 mg/dl andNbg7pNZO/C3H24768 mg/dl,D: 122 mg/dl,
P,0.001), in combination with lower plasma insulin levels (week 21 of age: Nbg7pNZO/NZO 6.5 6 0.6 mg/liter and
Nbg7pNZO/C3H 11.3 6 1.1 mg/liter, D: 4.8 mg/liter, P , 0.001) and lower body weight (week 17 of age:Nbg7pNZO/NZO 59.860.6 g andNbg7pNZO/C3H64.460.6 g,D: 5.6 g,P, 0.001) compared to heterozygous mice. Moreover, in the same backcross, a second peak for the blood glucose QTL (week 10 of age: LOD 12.5 at 26 cM, Figure 2B) was identified at a more distal region on chromosome 7 (Nbg7d,NZO blood glu-cose on distal chromosome 7). Similar toNbg7p, the NZO allele forNbg7dwas associated with increased blood glucose levels (week 10 of age: Nbg7dNZO/NZO 374 6 12 mg/dl and
Nbg7dNZO/C3H25268 mg/dl,D: 122 mg/dl,P,0.001).
Furthermore, in the N2(NZOxC3H) population, we de-tected two loci on chromosome 15 that were strongly associ-ated with blood glucose levels at weeks 7–20 (week 15 of age: LOD 6.7 at 23 cM and 5.2 at 35 cM). Whereas the prox-imal QTL (Nbg15p,NZO blood glucose on proximal chromo-some 15) was exclusively linked to blood glucose levels, the distal QTL (Nbg15d,NZO blood glucose on distal chromosome 15) showed additional suggestive linkage with body weight (week 15 of age: LOD 2.9 at 42 cM) and plasma insulin levels (week 21 of age: LOD 2.2 at 44 cM) (Figure 2D). Homozy-gous animals for both QTL had higher blood glucose levels compared to the heterozygous allele carriers (week 15 of age:
Nbg15pNZO/NZO409612 mg/dl andNbg15pNZO/C3H3106 12 mg/dl, D: 99 mg/dl, P , 0.001; week 10 of age:
Nbg15dNZO/NZO349611 mg/dl andNbg15dNZO/C3H2726 10 mg/dl,D: 77 mg/dl,P,0.001) (Table 1).
Nbg4d is associated with decreased blood glucose levels in NZO allele carriers
Figure 3 shows the development of blood glucose levels, T2D prevalence, and body weight for homozygous NZO and het-erozygous allele carriers forNbg4dfrom the N2(NZOx129P2) population. Starting at week 8 of age, heterozygous allele car-riers exhibited significantly higher mean blood glucose levels (week 17 of age: 307610 mg/dl inNbg4dNZO/129P2compared to 23067 mg/dl inNbg4dNZO/NZO,P,0.001, Figure 3A) in line with a higher T2D prevalence (week 20 of age: 55% in
Nbg4dNZO/129P2 compared to 35% in Nbg4dNZO/NZO, Figure 3B). In contrast, the development of body weight was similar between the two genotypes (Figure 3C).
Three loci on chromosomes 4, 7, and 15 contribute to distinct steps in the onset and development of T2D in the N2(NZOxC3H) population
Next, we tested whether the loci on chromosomes 4, 7, and 15 may contribute distinctly at different stages in the devel-opment of diabetes in the N2(NZOxC3H) population. We
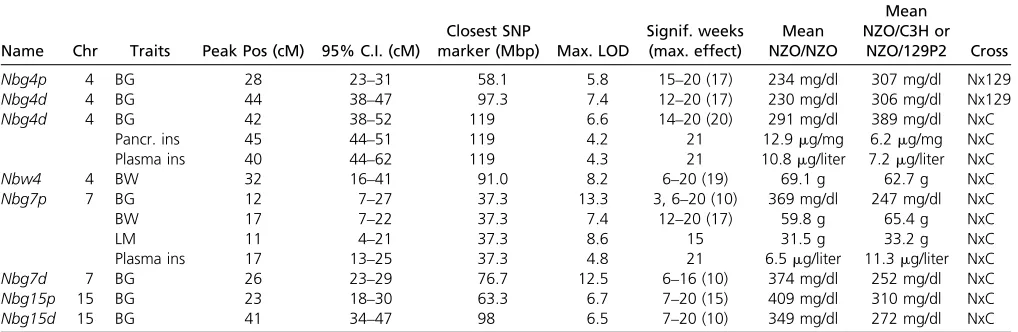
Table 1 Summary of the major QTL with significance for several weeks from both male N2(NZOxC3H and NZOx129P2) populations
Name Chr Traits Peak Pos (cM) 95% C.I. (cM)
Closest SNP
marker (Mbp) Max. LOD
Signif. weeks (max. effect)
Mean NZO/NZO
Mean NZO/C3H or
NZO/129P2 Cross
Nbg4p 4 BG 28 23–31 58.1 5.8 15–20 (17) 234 mg/dl 307 mg/dl Nx129
Nbg4d 4 BG 44 38–47 97.3 7.4 12–20 (17) 230 mg/dl 306 mg/dl Nx129
Nbg4d 4 BG 42 38–52 119 6.6 14–20 (20) 291 mg/dl 389 mg/dl NxC
Pancr. ins 45 44–51 119 4.2 21 12.9mg/mg 6.2mg/mg NxC
Plasma ins 40 44–62 119 4.3 21 10.8mg/liter 7.2mg/liter NxC
Nbw4 4 BW 32 16–41 91.0 8.2 6–20 (19) 69.1 g 62.7 g NxC
Nbg7p 7 BG 12 7–27 37.3 13.3 3, 6–20 (10) 369 mg/dl 247 mg/dl NxC
BW 17 7–22 37.3 7.4 12–20 (17) 59.8 g 65.4 g NxC
LM 11 4–21 37.3 8.6 15 31.5 g 33.2 g NxC
Plasma ins 17 13–25 37.3 4.8 21 6.5mg/liter 11.3mg/liter NxC
Nbg7d 7 BG 26 23–29 76.7 12.5 6–16 (10) 374 mg/dl 252 mg/dl NxC
Nbg15p 15 BG 23 18–30 63.3 6.7 7–20 (15) 409 mg/dl 310 mg/dl NxC
Nbg15d 15 BG 41 34–47 98 6.5 7–20 (10) 349 mg/dl 272 mg/dl NxC
therefore calculated mean values for blood glucose levels, cumulative T2D prevalence, and survival rates for each risk/protective allele on chromosomes 4, 7, and 15, and for the combined effect of all risk/protective alleles. The results of the analysis are illustrated in Figure 4. Starting in week 11, higher blood glucose levels were observed in mice carrying the C3H allele ofNbg4d(week 20 of age: 389615 mg/dl in
Nbg4dNZO/C3Hcompared to 291611 mg/dl inNbg4dNZO/NZO,
P,0.001, Figure 4A). This was accompanied by a higher T2D prevalence of C3H allele carriers ofNbg4d(week 18 of age: 79% inNbg4dNZO/C3Hcompared to 61% inNbg4dNZO/NZO, Figure 4D). However, risk allele carriers ofNbg4d exhibiteda higher survival rate (week 20 of age: 90% inNbg4dNZO/C3H compared to 76% inNbg4dNZO/NZO, Figure 4G).
In contrast, already starting from 6 weeks of age, the NZO allele forNbg7pwas associated with increased blood glucose levels (week 10 of age: 369 612 mg/dl inNbg7pNZO/NZO compared to 2476 8 mg/dl inNbg7pNZO/C3H,P ,0.001, Figure 4B), an increased T2D prevalence (week 10 of age: 57% in Nbg7pNZO/NZO compared to 17% in Nbg7pNZO/C3H, Figure 4E), and a lower survival rate (week 20 of age: 73% inNbg7pNZO/NZOcompared to 92% inNbg7pNZO/C3H, Figure 4H).
Similarly,Nbg15pNZO/NZOmice exhibited higher blood glu-cose levels (week 15 of age: 409612 mg/dl inNbg15pNZO/NZO compared to 310612 mg/dl inNbg15pNZO/C3H,P,0.001, Figure 4C), an increased T2D prevalence (week 13 of age: 75% inNbg15pNZO/NZOcompared to 45% inNbg15pNZO/C3H, Figure 4F), and a lower survival rate (week 20 of age: 74% in
Nbg15pNZO/NZO compared to 93% inNbg15pNZO/C3H, Figure 4I) compared toNbg15pNZO/C3Hmice.
Blood glucose levels increased with the number of risk alleles. Mice carrying all three risk alleles (Nbg4dNZO/C3H,
Nbg7pNZO/NZO, andNbg15pNZO/NZO) exceeded the T2D thresh-old of 300 mg/dl already at 7 weeks of age and reached a maximum average blood glucose level of 486 mg/dl in life-week 15. Conversely, mice carrying the protective alleles for all three QTL (Nbg4dNZO/NZO,Nbg7pNZO/C3H, andNbg15pNZO/C3H) exhibited substantially lower mean blood glucose levels (D: 238 mg/dl) in the same week of life and did not exceed the T2D threshold until the end of the study (Figure 4J). The T2D prevalence reached 93% in the risk allele carriers but only 36% in the protective allele carriers for the three QTL (Figure 4K). However, we did not observe that a com-bination of the three protective alleles improved the sur-vival rate of the animals (week 20 of age: 85% in risk allele combination compared to 95% in protective allele combination, Figure 4L).
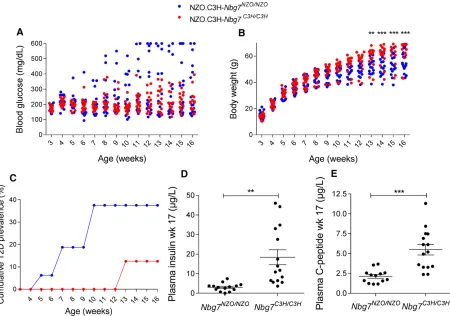
Validation for the linkage of Nbg7p with blood glucose and plasma insulin in recombinant congenic mice
To validate linkage of the Nbg7plocus with blood glucose and plasma insulin, we generated recombinant congenic mouse lines (RCS.NZOxC3H.Nbg7C3H/C3Hand
RCS.NZOxC3H.-Ngb7NZO/NZO) that harbor theNbg7plocus on an NZO back-ground (see Materials and Methods). Both genotypes were fed a 45% HFD and were metabolically characterized at weeks 3–16. Blood glucose levels were lower in RCS. NZOxC3H.Nbg7C3H/C3H mice compared to
RCS.NZOxC3H.-Nbg7NZO/NZO mice (week 12 of age: 219 6 17 mg/dl vs. 299644 mg/dl, not significant). At 10 weeks of age, 38% of the RCS.NZOxC3H.Nbg7NZO/NZO mice were already dia-betic (blood glucose . 300 mg/dl), whereas all RCS. NZOxC3H.Nbg7C3H/C3H mice were normoglycemic (blood glucose , 300 mg/dl) (Figure 5B). Moreover, starting at 13 weeks of age, RCS.NZOxC3H.Nbg7C3H/C3Hanimals gained
Figure 2 LOD score profile of the major identified QTL
for blood glucose, body weight, and plasma insulin in the N2population of the NZOx129P2 and NZOxC3H
cross. In the N2(NZOx129P2) population, two QTL for
blood glucose (Nbg4pandNbg4d) were detected on chromosome 4 (A). Further QTL were detected in the N2(NZOxC3H) population. A QTL for blood glucose and
plasma insulin (Nbg4d) was detected at a similar posi-tion on chromosome 4 compared toNbg4dfrom the N2(NZOx129P2) population. Another locus on
more body weight compared to RCS.NZOxC3H.Nbg7NZO/NZO mice (week 16 of age: 63.7 62.5 gvs.55.0 61.8 g,P,
0.001, Figure 5C). In addition, RCS.NZOxC3H.Nbg7C3H/C3H mice exhibited significantly higher plasma levels of insulin (18.364mg/litervs.3.060.5mg/liter,P= 0.0012; Figure 5D) and C-peptide (5.560.7mg/litervs.2.160.2mg/liter,
P , 0.001; Figure 5E) than RCS.NZOxC3H.Nbg7NZO//NZO mice.
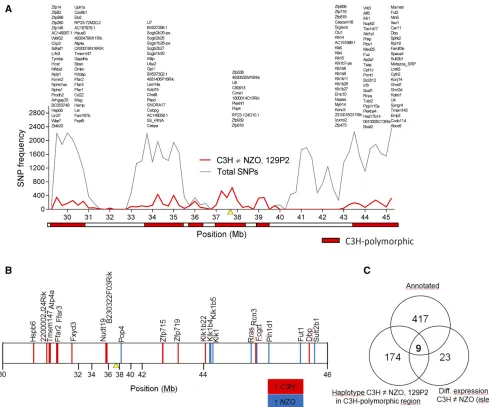
Selection of candidate genes for Nbg7p by combined haplotype and gene expression analysis
For the selection of candidate genes forNbg7p, we analyzed SNPs of the parental strains by using the database from the Wellcome Trust Sanger Institute (Keane et al.2011; Yalcin
et al.2011). Since the genomic sequence for our C3H sub-strain is not available in the database, the sequence from the closely related C3H/HeJ strain was used instead. AsNbg7p
was exclusively detected in N2(NZOxC3H) progeny and thus likely underlies a C3H-specific gene variant, we searched for C3H polymorphisms in the critical region (30–46 Mb) that differed from NZO and 129P2. We identified 26 coding non-synonymous SNPs (File S3 and Table S2) and 6 indel (in-sertion/deletion) polymorphisms (File S3 and Table S3) where C3H differs from both NZO and 129P2, but none of these variants are likely to affect protein function. Further haplotype analyses were conducted to narrow down regions of interest. For the dissection of the QTL peak into regions that are IBD between the strains and C3H polymorphic re-gions, we determined the number of C3H polymorphic SNPs each 250 kbp. As described before (Schmidt et al. 2008), regions exceeding a threshold of 100 SNPs/window were considered as C3H polymorphic (Figure 6A). Only genes with C3H-specific SNPs located in C3H polymorphic regions were considered as candidates for the QTL. Hence, out of 417 genes annotated in the database for the region, the number of can-didates forNbg7pcould be narrowed down to 174 genes.
Next, to further reduce the number of candidates, we integrated genome-wide transcriptome data from a
micro-array analysis of the islets of the parental strains C3H and NZO. This analysis revealed 23 genes with differential ex-pression and thus potential candidates forNbg7p(Figure 6B). In total, we found an overlap of nine genes [Heat shock protein, a-crystallin-related, B6 (Hspb6); Gastric hydrogen-potassium exchanging ATPasea(Atp4a);Transmembrane pro-tein 147(Tmem147);Free fatty acid receptor 2(Ffar2);Free fatty acid receptor 3(Ffar3);Zincfinger protein 719(Zfp719);
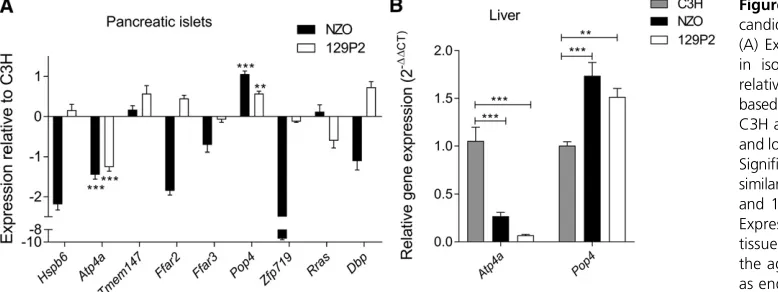
D site albumin promoter binding protein(Dbp); and Related RAS viral (r-ras) oncogene (Rras)] from our candidate gene approaches (Figure 6C). We further analyzed the expression of these genes by qRT-PCR and could validate the expression differences of seven genes, whereas differential expression forTmem147andRrascould not be confirmed. In addition, we integrated pancreatic islets from 129P2 in the qRT-PCR analysis to search for C3H-specific expression. Only the two candidates Atp4aand Pop4were distinctively regulated in islets from C3H, thus representing the most likely candidates forNbg7p. mRNA levels ofAtp4awere significantly higher in islets from C3H compared to NZO and 129P2. In contrast, expression ofPop4was downregulated in C3H compared to the other two strains (Figure 7A). For both genes, a similar expression pattern as in the pancreatic islets was further de-tected in liver tissue of the parental strains (Figure 7B). We further analyzed the expression of Atp4a and Pop4 in the pancreatic islets (Figure 8A) and liver (Figure 8B) of our RCS.NZO.C3H.Nbg7 mice, and found the same expression differences between NZO and C3H allele carriers for chromo-some 7 as observed in the parental strains.
Atp4a and Pop4 alter GSIS in MIN6 cells
We investigated the roles ofAtp4aandPop4in insulin secre-tion using MIN6 cells. By applying specific siRNA oligonucle-otides, mRNA levels could be reduced by 92% for Atp4a
(Figure 9A) and by 81% for Pop4 (Figure 9B). Insulin se-cretion without glucose was not different between control (nontarget transfected) and knockdown (target siRNA-transfected) cells. In contrast, upon glucose stimulation
Figure 3 Quantitative effect ofNbg4d. Mean values for blood glucose levels (6SEM) (A), cumulative T2D prevalence (B), and body weight (C) for homozygous NZO and heterozygous allele carriers forNbg4dfrom the N2(NZOx129P2) population.Nbg4dNZO/129P2:n= 150;Nbg4dNZO/NZO:n= 138. N,
Figure 4 Single and combined effects of major QTL in the N2(NZOxC3H) population. Mean values for blood glucose levels (6SEM) (A), cumulative T2D
prevalence (D), and survival (G) for NZO/C3H and NZO/NZO allele carriers forNbg4d. Mean values for blood glucose levels (6SEM) (B), cumulative T2D prevalence (E), and survival (H) for NZO/C3H and NZO/NZO allele carriers forNbg7p. Mean values for blood glucose levels (6SEM) (C), cumulative T2D prevalence (F), and survival (I) for NZO/C3H and NZO/NZO allele carriers forNbg15p. Combined effect of all three risk alleles on the development of blood glucose levels (6SEM) (J), cumulative T2D prevalence (K), and survival (L).n:Nbg4dNZO/NZO= 125–180,Nbg4dNZO/C3H= 110–147;Nbg7pNZO/NZO=
(25 mM glucose), significantly lower insulin secretion was observed for both Atp4a- (40% reduction) and Pop4 -(50% reduction) knockdown cells (Figure 9C). Moreover, we measured insulin mRNA levels in our knockdown cells and observed a significant reduction inPop4-deficient cells compared to controls (Figure 9D).
Discussion
Numerous inbred mouse strains are available that exhibit substantial genetic diversity and may reflect susceptibility to various metabolic diseases in humans, including obesity and diabetes (Clee and Attie 2007). Previous studies have investigated the genetic architecture of diabetes and related diseases by taking advantage of different physiological prop-erties that segregate in outbred populations, advanced se-quencing resources, and publicly available data sets (Bogue
et al.2018).
Most linkage studies used a single outcross population to search for the genetic determinants for phenotypic distinc-tions between two strains. However, the genetic comparison of only two strains usually results in a high nomination of candidate genes. The use of more than one inbred cross
may substantially improve the mapping resolution of candi-dates and thus can facilitate gene discovery (Liet al.2005; Vogelet al.2018). In our study, we combined linkage data from two different backcross populations generated from the breeding of obese and T2D-prone NZO mice with two widely used lean strains, C3H and 129P2, thereby allowing the iden-tification of strain-specific linkage signals. The strongest QTL for blood glucose and plasma insulin on proximal chromo-some 7 (designatedNbg7p), presumably directly influencing pancreatic function, appeared exclusively in the NZOxC3H crossbreeding. Through a combination of sequence and ex-pression data from the three different parental inbred strains, we identifiedPop4andAtp4aas candidates in C3H polymor-phic regions with C3H-specific expression patterns in the pancreatic islets, and thus as likely candidates for the QTL
Nbg7p.
In response to a HFD, NZO mice develop obesity and insulin resistance, with rapid progression ofb-cell failure and severe hyperglycemia (Jürgenset al.2006, 2007; Joost 2010; Kluth
et al.2011; Joost and Schürmann 2014). In contrast, 129P2 mice are known to be protected from the development of T2D (Clee and Attie 2007). C3H mice show an intermediate phenotype, as they exhibit mild features of the metabolic
syndrome, including relatively high body fat content in com-bination with high plasma glucose, cholesterol, and triglyc-eride levels (Champyet al.2008). Notably, embryonic stem cells from 129P2 have been widely used for the generation of targeted mutations in mice, thus rendering many exist-ing lines partially congenic with this strain. Similarly, C3H-derived stem cells were used to generate multiple mutant lines carrying ENU-induced mutations (Coghillet al.2002; Sabrautzki et al.2012; van Buerck et al. 2012). We took
advantage of the metabolic diversity of the three different inbred strains, and generated two backcross populations by breeding NZO females with 129P2 and C3H males, respectively.
As expected from the genetic diversity of the used paren-tal strains, the subsequent linkage analysis revealed numer-ous QTL associated with metabolic traits. A locus on distal chromosome 4 (Nbg4d) revealed linkage with blood glucose in both backcross populations, indicating that both QTL
Figure 6 Combined approach of haplotype and gene expression analysis in the islets of parental strains for the identification of C3H-specific gene
underlie the same gene variant derived from the NZO strain, used as a breeding partner in both crosses (NZOx129P2 and NZOxC3H). Interestingly, the NZO allele forNbg4dwas as-sociated with decreased blood glucose levels, suggesting that the obese NZO strain carries a T2D-protective gene variant at this locus. On the other hand, it may also be possible that the QTL might underlie different diabetogenic gene variants from the two lean strains. Interestingly, theNbg4dlocus over-laps partially with a previously reported diabetes QTL,
Nidd1/SJL, whereZfp69(Schernecket al. 2009) and likely additional variants (Chung et al.2015) in the region were identified to contribute to the hyperglycemia phenotype. Fur-ther studies are required to identify shared candidates in the
Nbg4d region. Surprisingly, despite a higher diabetes risk, C3H allele carriers forNbg4dfrom the N2(NZOxC3H) back-cross had better survival compared to NZO allele carriers. This contradictory phenotype could be explained by addi-tional gene variants within the locus itself or elsewhere in the genome that might regulate survival through glucose-in-dependent mechanisms.
In addition to Nbg4d, we found two further major T2D modifier QTL (Nbg7p and Nbg15p) exclusively in the NZOxC3H crossbreeding where the C3H allele was associ-ated with lower blood glucose, indicating the contribution of two T2D-protective genes from the C3H genome. The ef-fects mediated by the chromosomes 4, 7, and 15 showed different time courses of linkage, indicating that the loci con-tribute distinctly at different stages in the development of T2D in the N2(NZOxC3H) population. Linkage of blood glu-cose withNbg7pwas already significant at 3 weeks of age, clearly indicating that the locus targets early steps of T2D development. In contrast, linkage ofNbg4dwas not observed before week 14, suggesting that the locus contributes at late stages to the progression of the disease. Interestingly, we could observe a combined effect of the three loci on the de-velopment of blood glucose levels, which almost seems to fully explain the incidence of T2D within the population. This observation is remarkable when considering that T2D is as-sumed to be influenced by dozens of genes scattered all across the genome, each of them contributing to a different
extent to its pathophysiology (Clee and Attie 2007; Ali 2013; Prasad and Groop 2015). The onset of T2D due to three loci clearly emphasizes the important impact of the underlying genes. The QTLNbg7prevealed the most significant linkage with blood glucose and plasma insulin levels from the N2-(NZOxC3H) population. Whereas NZO.C3H-Nbg7pNZO/C3H animals were revealed to be widely protected from T2D, NZO.C3H-Nbg7pNZO/NZO animals displayed hyperglycemia already at early age, progressing to severe pancreaticb-cell loss as indicated by the lack of plasma insulin and body weight reduction atfinal stages of age. The onset of hyper-glycemia was independent from the body weight, indicating that the locus directly targets the pancreatic islets rather than the peripheral tissues. We generated RCSs for the vali-dation of the linkage (Darvasi 1997; Brockmann and Neuschl 2012). In accordance with the phenotype from the backcross population, C3H allele carriers exhibited lower mean blood glucose values, and markedly higher plasma insulin and C-peptide levels compared to controls (NZO allele carriers on chromosome 7). However, due to the variation in the control group, the differences in glycemia between the geno-types did not reach statistical significance.
A survey of genetic polymorphisms listed in the Sanger database did not identify sequence variants likely to affect protein function and thus failed to reveal strong candidate genes in theNbg7plocus. By a combined approach of hap-lotype and gene expression analysis, we identified C3H-specific sequence and expression variants differing from NZO and 129P2, and thus were able to reduce the num-ber of candidates from 417 annotated genes to two candi-dates: Potassium-transporting ATPaseachain 1(Atp4a)and
Ribonuclease P protein subunit p29(Pop4). Differential expres-sion for both genes could further be confirmed in the pancre-atic islets from the RCSs, demonstrating that the expression differences associate with the critical fragment from C3H on the NZO background. Interestingly, two genes in the Nbg7p
locus,Ffar2andFfar3, have already been associated with di-abetes-related phenotypes in islets (Priyadarshini and Layden 2015; Priyadarshiniet al.2015) and show lower expression in islets of the diabetes-prone NZO strain. However, both lean
strains showed higher expression ofFfar2andFfar3, indi-cating that both genes are unlikely candidates for the phe-notype contributed by the C3H allele. Moreover, a mutation of Abcc8 located close to the Nbg7p locus that results in strongly reduced expression of the gene has been reported previously to impair insulin secretion in the related NZO/ Wehi strain (Andrikopouloset al.2016).Abcc8was not dif-ferentially expressed between our strains, suggesting that this gene is rather an unlikely candidate for theNbg7pQTL. Using the murineb-cell line MIN6 (Miyazakiet al.1990), the knockdown of our strongest candidates,Pop4andAtp4a, was associated with a decreased GSIS, indicating that the genes may function in the process of insulin release. For
Pop4, whose mRNA levels were higher in nondiabetic NZO islets, the observed function is contradictory to the pheno-type, as NZO allele carriers exhibited lower levels of plasma insulin. However, mRNA levels were measured in 6-week-old animals, whereas plasma insulin levels were determined at weeks 21 (N2) and 17 (RCS). It might be possible thatPop4 -related changes in insulin secretion at early stages of life might contribute to late-onset failure of the islets.Pop4(also known asRpp29) encodes one of the protein subunits of the ribonuclease P complex, a protein that was originally discov-ered as the endoribonuclease that processes the 59leader of precursor transfer RNA (tRNA) (Guerrier-Takada et al.
1983). Whereas critical defects in this processing machinery are lethal, alterations in tRNA processing have been associ-ated with impaired insulin secretion and diabetes (Weiet al.
2011; Palmer et al. 2017). In recent years, it has become increasingly clear that the different subunits of the ribonu-clease P complex are engaged in other important roles.Pop4
has recently been shown to be involved in the DNA damage response machinery (Abu-Zhayiaet al.2017), and to partic-ipate in the regulation of chromatin structure and function (Newhartet al.2016), which is known to play a fundamental role in the epigenetic modification of the genome and likely also in b-cell biology (Paul et al. 2016). In humans, copy number variants of POP4 have been associated with breast and ovarian cancer (Wrzeszczynskiet al.2011; Natrajanet al.
2012). Ourfinding that knockdown ofPop4reduces mRNA for insulin supports a role of this gene inb-cells and insulin
secretion. We speculate that elevated levels ofPop4in young, nondiabetic NZO mice may be compensatory to early-onset insulin resistance, whereas gene expression could be reduced in overt diabetes. Further studies ofPop4inb-cell function are therefore required.
Another candidate for Nbg7p is Atp4a, as its insulin-stimulating impact is in accordance with increased mRNA and plasma insulin levels in the C3H strain. The gene encodes the a subunit of the heterodimeric gastric proton pump H+/K+-ATPase, which has been reported to function in pro-ton exchange in gastric parietal cells (Spicer et al. 2000). Recently, the gastric H+/K+-ATPase has also been shown to be expressed in the human pancreas where it contributes to pancreatic exocrine secretion (Wanget al.2015), but its po-tential role in the secretion of insulin is unknown. It is well established that GSIS in pancreatic islets involves the closure of KATPchannels to allow the depolarization of the cell mem-brane followed by calcium influx through voltage-dependent Ca2+channels, which subsequently triggers the exocytosis of insulin vesicles. The observed impact of the H+/K+-ATPase on GSIS in MIN6 cells suggests that this proton pump may participate in this process, possibly by contributing to the regulation of the intracellular ion concentration. Interest-ingly, the autoimmune disease atrophic body gastritis, which is characterized by the persistent presence of ATP4A autoan-tibodies, has been associated with type 1 diabetes mellitus in humans (Chobotet al.2014), indicating that the gene may also play an important role in human diabetes.
In conclusion, our study demonstrates that the compara-tive analysis of multiple inbred populations generated with one common breeding partner allows the identification of strain-specific linkage signals, thereby substantially improv-ing the mappimprov-ing resolution of disease genes. While T2D is polygenic, the nature of the onset and progression of the disease can be almost fully reconstituted by the interaction of only three different genetic loci, suggesting that in the NZOxC3H backcross only a limited number of variants are contributing to T2D. Nevertheless, considerable evidence exists that QTL regions may include multiple genes that contribute to the phenotype (Buchner and Nadeau 2015). Moreover, a number of genetic variants, including noncoding
Figure 8 Quantitative real-time PCR of Pop4 and
SNPs, indels, copy number polymorphisms, and yet unknown
de novomutations, may exert effects on regulatory circuits in the locus, thereby affecting islet cell function and glycemic control. Consequently, future studies, including characteriza-tion of congenic and tissue-specific knockout lines, will be needed to determine the contribution of Pop4 and Atp4a, and potentially other genetic variations in the locus, to the impact ofNbg7pon blood glucose and plasma insulin levels.
Acknowledgments
We thank Angela Pelligra, Janek Masuch, Angelika Horrighs, Anette Kurowski, Annette Schober, Peter Herdt, and Andrea Scheffel-Clausewitz for technical assistance. This work was supported by grants from the German Ministry of Education and Research, the State of North-Rhine-Westphalia and the State of Brandenburg (grants 82DZD00202 to H.A.-H. and 82DZD00302 to A.S.), and the German Federal Ministry of Health (Bundesministerium für Gesundheit). D.A. was sup-ported by a Deutscher Akademischer Austauschdienst Fellow-ship and T. Stermann received a stipend from the research training group “vivid” of the Heinrich-Heine University Duesseldorf.
Literature Cited
Abu-Zhayia, E. R., H. Khoury-Haddad, N. Guttmann-Raviv, R. Serruya,
N. Jarrous et al., 2017 A role of human RNase P subunits,
Rpp29 and Rpp21, in homology directed-repair of
double-strand breaks. Sci. Rep. 7: 1002. https://doi.org/10.1038/
s41598-017-01185-6
Ali, O., 2013 Genetics of type 2 diabetes. World J. Diabetes 4:
114–123.https://doi.org/10.4239/wjd.v4.i4.114
Andrikopoulos, S., B. C. Fam, A. Holdsworth, S. Visinoni, Z. Ruan et al., 2016 Identification of ABCC8 as a contributory gene to impaired early-phase insulin secretion in NZO mice.
J. Endocrinol. 228: 61–73.
https://doi.org/10.1530/JOE-15-0290
Attie, A. D., G. A. Churchill, and J. H. Nadeau, 2017 How mice are
indispensable for understanding obesity and diabetes genetics.
Curr. Opin. Endocrinol. Diabetes Obes. 24: 83–91.https://doi.
org/10.1097/MED.0000000000000321
Bogue, M. A., S. C. Grubb, D. O. Walton, V. M. Philip, G. Kolishovski et al., 2018 Mouse phenome database: an integrative database and analysis suite for curated empirical phenotype data from
laboratory mice. Nucleic Acids Res. 46: D843–D850. https://
doi.org/10.1093/nar/gkx1082
Brockmann, G. A., and C. Neuschl, 2012 Positional cloning of
di-abetes genes. Methods Mol. Biol. 933: 275–289. https://doi.
org/10.1007/978-1-62703-068-7_18
Broman, K. W., and S. Sen, 2009 A Guide to QTL Mapping with
R/qtl. Springer, New York.
Buchner, D. A., and J. H. Nadeau, 2015 Contrasting genetic
archi-tectures in different mouse reference populations used for
studying complex traits. Genome Res. 25: 775–791. https://
doi.org/10.1101/gr.187450.114
Chadt, A., K. Leicht, A. Deshmukh, L. Q. Jiang, S. Schernecket al.,
2008 Tbc1d1 mutation in lean mouse strain confers leanness
and protects from diet-induced obesity. Nat. Genet. 40: 1354–
1359.https://doi.org/10.1038/ng.244
Champy, M. F., M. Selloum, V. Zeitler, C. Caradec, B. Junget al.,
2008 Genetic background determines metabolic phenotypes in
Figure 9 GSIS in MIN6 cells after knockdown ofPop4and
the mouse. Mamm. Genome 19: 318–331. https://doi.org/ 10.1007/s00335-008-9107-z
Cho, N. H., J. E. Shaw, S. Karuranga, Y. Huang, J. D. da Rocha
Fernandes et al., 2018 IDF diabetes atlas: global estimates
of diabetes prevalence for 2017 and projections for 2045.
Di-abetes Res. Clin. Pract. 138: 271–281.https://doi.org/10.1016/
j.diabres.2018.02.023
Chobot, A., J. Wenzlau, K. Bak-Drabik, J. Kwiecien, J. Polanska et al., 2014 ATP4A autoimmunity and Helicobacter pylori in-fection in children with type 1 diabetes. Clin. Exp. Immunol.
177: 598–602.https://doi.org/10.1111/cei.12363
Chung, B., M. Stadion, N. Schulz, D. Jain, S. Scherneck et al.,
2015 The diabetes gene Zfp69 modulates hepatic insulin
sen-sitivity in mice. Diabetologia 58: 2403–2413.https://doi.org/
10.1007/s00125-015-3703-8
Clee, S. M., and A. D. Attie, 2007 The genetic landscape of type
2 diabetes in mice. Endocr. Rev. 28: 48–83. https://doi.org/
10.1210/er.2006-0035
Coghill, E. L., A. Hugill, N. Parkinson, C. Davison, P. Glenisteret al.,
2002 A gene-driven approach to the identification of ENU
mu-tants in the mouse. Nat. Genet. 30: 255–256.https://doi.org/
10.1038/ng847
Darvasi, A., 1997 Interval-specific congenic strains (ISCS): an
ex-perimental design for mapping a QTL into a 1-centimorgan
in-terval. Mamm. Genome 8: 163–167. https://doi.org/10.1007/
s003359900382
Das, S. K., and S. C. Elbein, 2006 The genetic basis of type 2
di-abetes. Cellscience 2: 100–131.
Dash, S., H. Sano, J. J. Rochford, R. K. Semple, G. Yeo et al.,
2009 A truncation mutation in TBC1D4 in a family with
acan-thosis nigricans and postprandial hyperinsulinemia. Proc. Natl.
Acad. Sci. USA 106: 9350–9355. https://doi.org/10.1073/
pnas.0900909106
Dorajoo, R., J. Liu, and B. O. Boehm, 2015 Genetics of type 2
di-abetes and clinical utility. Genes (Basel) 6: 372–384.https://
doi.org/10.3390/genes6020372
Fuchsberger, C., J. Flannick, T. M. Teslovich, A. Mahajan, V. Agar-walaet al., 2016 The genetic architecture of type 2 diabetes.
Nature 536: 41–47.https://doi.org/10.1038/nature18642
Gailus-Durner, V., H. Fuchs, L. Becker, I. Bolle, M. Brielmeieret al.,
2005 Introducing the German Mouse Clinic: open access
plat-form for standardized phenotyping. Nat. Methods 2: 403–404.
https://doi.org/10.1038/nmeth0605-403
Guerrier-Takada, C., K. Gardiner, T. Marsh, N. Pace, and S. Altman,
1983 The RNA moiety of ribonuclease P is the catalytic
sub-unit of the enzyme. Cell 35: 849–857.https://doi.org/10.1016/
0092-8674(83)90117-4
Herberg, L., and D. L. Coleman, 1977 Laboratory animals
exhib-iting obesity and diabetes syndromes. Metabolism 26: 59–99.
https://doi.org/10.1016/0026-0495(77)90128-7
Joost, H. G., 2010 The genetic basis of obesity and type 2 diabetes:
lessons from the new zealand obese mouse, a polygenic model
of the metabolic syndrome. Results Probl. Cell Differ. 52: 1–11.
https://doi.org/10.1007/978-3-642-14426-4_1
Joost, H. G., and A. Schürmann, 2014 The genetic basis of
obe-sity-associated type 2 diabetes (diabesity) in polygenic mouse
models. Mamm. Genome 25: 401–412.https://doi.org/10.1007/
s00335-014-9514-2
Jürgens, H. S., A. Schürmann, R. Kluge, S. Ortmann, S. Klaus et al., 2006 Hyperphagia, lower body temperature, and re-duced running wheel activity precede development of morbid obesity in New Zealand obese mice. Physiol. Genomics 25: 234–241.https://doi.org/10.1152/physiolgenomics.00252. 2005
Jürgens, H. S., S. Neschen, S. Ortmann, S. Scherneck, K. Schmolz et al., 2007 Development of diabetes in obese, insulin-resistant mice: essential role of dietary carbohydrate in beta cell
destruc-tion. Diabetologia 50: 1481–1489. https://doi.org/10.1007/
s00125-007-0662-8
Keane, T. M., L. Goodstadt, P. Danecek, M. A. White, K. Wonget al.,
2011 Mouse genomic variation and its effect on phenotypes
and gene regulation. Nature 477: 289–294. https://doi.org/
10.1038/nature10413
Kleinert, M., C. Clemmensen, S. M. Hofmann, M. C. Moore, S.
Renner et al., 2018 Animal models of obesity and diabetes
mellitus. Nat. Rev. Endocrinol. 14: 140–162. https://doi.org/
10.1038/nrendo.2017.161
Kluth, O., F. Mirhashemi, S. Scherneck, D. Kaiser, R. Klugeet al.,
2011 Dissociation of lipotoxicity and glucotoxicity in a mouse
model of obesity associated diabetes: role of forkhead box O1 (FOXO1) in glucose-induced beta cell failure. Diabetologia 54: 605–616.https://doi.org/10.1007/s00125-010-1973-8
Knebel, B., S. Hartwig, J. Haas, S. Lehr, S. Goeddeke et al.,
2015 Peroxisomes compensate hepatic lipid overflow in mice
with fatty liver. Biochim. Biophys. Acta 1851: 965–976.https://
doi.org/10.1016/j.bbalip.2015.03.003
Kumar, P., S. Henikoff, and P. C. Ng, 2009 Predicting the effects of
coding non-synonymous variants on protein function using the
SIFT algorithm. Nat. Protoc. 4: 1073–1081. https://doi.org/
10.1038/nprot.2009.86
Lander, E., and L. Kruglyak, 1995 Genetic dissection of complex
traits: guidelines for interpreting and reporting linkage results.
Nat. Genet. 11: 241–247.https://doi.org/10.1038/ng1195-241
Lander, E. S., and D. Botstein, 1989 Mapping mendelian factors
underlying quantitative traits using RFLP linkage maps.
Genet-ics 121: 185–199.
Li, R., M. A. Lyons, H. Wittenburg, B. Paigen, and G. A. Churchill,
2005 Combining data from multiple inbred line crosses
im-proves the power and resolution of quantitative trait loci
map-ping. Genetics 169: 1699–1709.https://doi.org/10.1534/genetics.
104.033993
Livak, K. J., and T. D. Schmittgen, 2001 Analysis of relative gene
expression data using real-time quantitative PCR and the
2(-Delta Delta C(T)). Method. Methods 25: 402–408.https://
doi.org/10.1006/meth.2001.1262
Miyazaki, J., K. Araki, E. Yamato, H. Ikegami, T. Asano et al.,
1990 Establishment of a pancreatic beta cell line that retains
glucose-inducible insulin secretion: special reference to
expres-sion of glucose transporter isoforms. Endocrinology 127: 126–
132.https://doi.org/10.1210/endo-127-1-126
Morris, A. P., B. F. Voight, T. M. Teslovich, T. Ferreira, A. V. Segrè et al., 2012 Large-scale association analysis provides insights into the genetic architecture and pathophysiology of type 2
di-abetes. Nat. Genet. 44: 981–990. https://doi.org/10.1038/
ng.2383
Natrajan, R., A. Mackay, P. M. Wilkerson, M. B. Lambros, D. Wetterskog et al., 2012 Functional characterization of the 19q12 amplicon
in grade III breast cancers. Breast Cancer Res. 14: R53.https://
doi.org/10.1186/bcr3154
Newhart, A., S. L. Powers, P. K. Shastrula, I. Sierra, L. M. Jooet al.,
2016 RNase P protein subunit Rpp29 represses histone H3.3
nucleosome deposition. Mol. Biol. Cell 27: 1154–1169.https://
doi.org/10.1091/mbc.e15-02-0099
Palmer, C. J., R. J. Bruckner, J. A. Paulo, L. Kazak, J. Z. Longet al.,
2017 Cdkal1, a type 2 diabetes susceptibility gene, regulates
mitochondrial function in adipose tissue. Mol. Metab. 6: 1212–
1225.https://doi.org/10.1016/j.molmet.2017.07.013
Paul, P. K., M. E. Rabaglia, C. Y. Wang, D. S. Stapleton, N. Leng et al., 2016 Histone chaperone ASF1B promotes human beta-cell proliferation via recruitment of histone H3.3. Cell Cycle 15:
3191–3202.https://doi.org/10.1080/15384101.2016.1241914
Permutt, M. A., J. Wasson, and N. Cox, 2005 Genetic
epidemiol-ogy of diabetes. J. Clin. Invest. 115: 1431–1439. https://doi.
Prasad, R. B., and L. Groop, 2015 Genetics of type 2
diabetes-pitfalls and possibilities. Genes (Basel) 6: 87–123. https://doi.
org/10.3390/genes6010087
Priyadarshini, M., and B. T. Layden, 2015 FFAR3 modulates insulin
secretion and global gene expression in mouse islets. Islets 7:
e1045182.https://doi.org/10.1080/19382014.2015.1045182
Priyadarshini, M., S. R. Villa, M. Fuller, B. Wicksteed, C. R. Mackay et al., 2015 An acetate-specific GPCR, FFAR2, regulates insulin
secretion. Mol. Endocrinol. 29: 1055–1066. https://doi.org/
10.1210/me.2015-1007
Sabrautzki, S., I. Rubio-Aliaga, W. Hans, H. Fuchs, B. Rathkolb et al., 2012 New mouse models for metabolic bone diseases generated by genome-wide ENU mutagenesis. Mamm. Genome
23: 416–430 [corrigenda: Mamm. Genome 25: 648 (2014)].
https://doi.org/10.1007/s00335-012-9397-z
Scherneck, S., M. Nestler, H. Vogel, M. Bluher, M. D. Blocket al.,
2009 Positional cloning of zinc finger domain transcription
factor Zfp69, a candidate gene for obesity-associated diabetes contributed by mouse locus Nidd/SJL. PLoS Genet. 5: e1000541.
https://doi.org/10.1371/journal.pgen.1000541
Schmidt, C., N. P. Gonzaludo, S. Strunk, S. Dahm, J. Schuchhardt et al., 2008 A meta-analysis of QTL for diabetes-related traits
in rodents. Physiol. Genomics 34: 42–53.https://doi.org/10.1152/
physiolgenomics.00267.2007
Schwenk, R. W., H. Vogel, and A. Schürmann, 2013 Genetic and
epigenetic control of metabolic health. Mol. Metab. 2: 337–347.
https://doi.org/10.1016/j.molmet.2013.09.002
Spicer, Z., M. L. Miller, A. Andringa, T. M. Riddle, J. J. Duffyet al.,
2000 Stomachs of mice lacking the gastric H,K-ATPase alpha
-subunit have achlorhydria, abnormal parietal cells, and ciliated
metaplasia. J. Biol. Chem. 275: 21555–21565.https://doi.org/
10.1074/jbc.M001558200
Tsaih, S. W., K. Holl, S. Jia, M. Kaldunski, M. Tschannen et al.,
2014 Identification of a novel gene for diabetic traits in rats,
mice, and humans. Genetics 198: 17–29.https://doi.org/10.1534/
genetics.114.162982
van Buerck, L., M. Schuster, B. Rathkolb, S. Sabrautzki, M. Hrabe de
Angeliset al., 2012 Enhanced oxidative stress and endocrine
pancreas alterations are linked to a novel glucokinase missense mutation in ENU-derived Munich Gck(D217V) mutants. Mol.
Cell. Endocrinol. 362: 139–148.https://doi.org/10.1016/j.mce.
2012.06.001
Vogel, H., S. Scherneck, T. Kanzleiter, V. Benz, R. Kluge et al.,
2012 Loss of function of Ifi202b by a microdeletion on
chro-mosome 1 of C57BL/6J mice suppresses 11beta-hydroxysteroid dehydrogenase type 1 expression and development of obesity.
Hum. Mol. Genet. 21: 3845–3857. https://doi.org/10.1093/
hmg/dds213
Vogel, H., A. Kamitz, N. Hallahan, S. Lebek, T. Schallschmidtet al.,
2018 A collective diabetes cross in combination with a
com-putational framework to dissect the genetics of human obesity
and Type 2 diabetes. Hum. Mol. Genet. 27: 3099–3112.https://
doi.org/10.1093/hmg/ddy217
Wang, J., D. Barbuskaite, M. Tozzi, A. Giannuzzo, C. E. Sorensen et al., 2015 Proton pump inhibitors inhibit pancreatic secretion: role of gastric and non-gastric H+/K+-ATPases. PLoS One 10:
e0126432.https://doi.org/10.1371/journal.pone.0126432
Wei, F. Y., T. Suzuki, S. Watanabe, S. Kimura, T. Kaitsuka et al.,
2011 Deficit of tRNA(Lys) modification by Cdkal1 causes the
development of type 2 diabetes in mice. J. Clin. Invest. 121:
3598–3608.https://doi.org/10.1172/JCI58056
Wrzeszczynski, K. O., V. Varadan, J. Byrnes, E. Lum, S. Kamalakaran et al., 2011 Identification of tumor suppressors and onco-genes from genomic and epigenetic features in ovarian cancer.
PLoS One 6: e28503. https://doi.org/10.1371/journal.pone.
0028503
Yalcin, B., K. Wong, A. Agam, M. Goodson, T. M. Keane et al.,
2011 Sequence-based characterization of structural variation
in the mouse genome. Nature 477: 326–329.https://doi.org/
10.1038/nature10432
Yesil, P., M. Michel, K. Chwalek, S. Pedack, C. Janyet al., 2009 A
new collagenase blend increases the number of islets isolated
from mouse pancreas. Islets 1: 185–190.https://doi.org/10.4161/
isl.1.3.9556