Knowledge Diffusion in Social Network
Soumya Dawn 1
P.G. Student, Dep. of Computer Science & Engineering, Kalyani Government Engineering College,
West Bengal, India1
ABSTRACT: Social network analysis views social relationships in terms of network theory consisting of nodesand
ties. Nodes are the individual within the networks. Ties are the relationships between the node which may be people, organization etc. "Social network analysis is the mapping and measuring of relationships and flows between people, groups, organizations, computers or other information/knowledge processing entities" (Valdis Krebs, 2002). Social Network Analysis (SNA) is a analysis for visualizing our people, and identify how we can best interact to diffusion of knowledge. Diffusion of knowledge can happened in social networks due to spreading of items through word of mouth and exogenous factors. These items may be news, videos, and advertisements. We get counseling relationship network and intelligence relationship network basing on the relationship between students in the class and how knowledge diffuses among them. Here we analyse network density, centrality and cohesive subgroup of the network. in this work first we collect data set then we analyze the counseling relationship network and intelligence relationship network.
KEYWORDS: Knowledge diffusion; Social network analysis; Network Structure; network community.
I. INTRODUCTION
The study of social network is a new but quickly widening multidisciplinary area involving, social, mathematical, statistical and computer science (Burt, Minor,&Associates,1983). The term social network refers to the articulation of a social relationship, among individuals, families, villages, communities, and so on. Each of them can play dual roles, acting both as a unit or node of a social network as well as a social actor (cf Laumann & Pappi, 1976). In social network analysis, the knowledge diffusion among university students is becoming very important. Thus, it is an issue with important theoretical value and practical meaning to analyze and study the knowledge diffusion in universities. Processes of knowledge diffusion involve interactions between agents in the form of knowledge transfer. Social systems where knowledge diffusion takes place are complex social systems. One method for the study of this kind of systems is agent-based emulation modeling. Using complex networks analysis tools to explore the ideas mentioned above may be a powerful complement for this technique.
The diffusion of knowledge is a fundamental aspect of the economic activity. Innovation requires that knowledge is diffused in the economic system between organizations. This fact was already noticed by Alfred Marshall when he identified the facility in sharing knowledge between firms as one of the fundamental reasons for the spatial agglomeration of industries (Marshall, 1920). Processes of knowledge diffusion involve interactions between agents in the form of knowledge assets transfer. In this paper section II discuss some literature review, section III discuss about what is social network and its terminology, section IV discuss about research approach to knowledge diffusion in social network and section VI represent the social network analysis that is formed in the class of a university student.
II.LITERATUREREVIEW
after studying the relationship between the network configuration and the effect of knowledge diffusion[11]. Most of the cases knowledge diffusion involved research on man’s behaviour. Social networks analysis is used to quantify the mode and flow direction of the knowledge diffusion among the members. Krackhardt separated social network into three styles: emotional relationship network, counseling relationship network, intelligence relationship network[2].
III.NETWORKANDKNOWLEDGEDIFFUSION
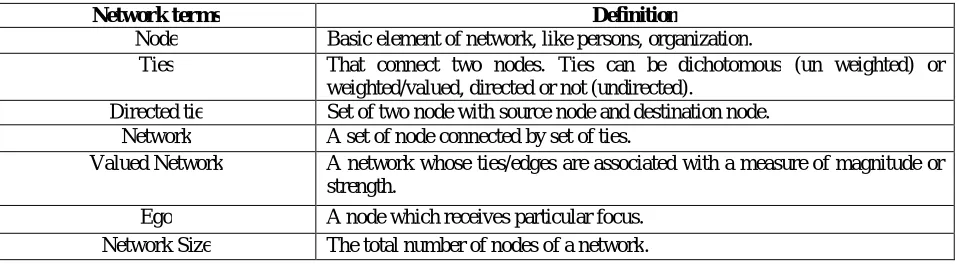
First I briefly discuss about network then discuss about social network. Network is nothing but a set of node connected by a set of ties. The node can be anything like persons, teams, organization, concept, patents etc. in the case of social network node are individuals. In this paper we choose a class to forming a network. All the student in the class are called node of the network.
There are two type of network homogeneous and heterogeneous network. The network which are made by one type of node are called homogeneous network. and which are not homogenous are called heterogeneous. In network node are connected by ties(edge) and ties can be directed or undirected can be dichotomous ( whether two people are friends or not) or weighted ( strength of friendship).
Network terms Definition
Node Basic element of network, like persons, organization.
Ties That connect two nodes. Ties can be dichotomous (un weighted) or
weighted/valued, directed or not (undirected).
Directed tie Set of two node with source node and destination node.
Network A set of node connected by set of ties.
Valued Network A network whose ties/edges are associated with a measure of magnitude or
strength.
Ego A node which receives particular focus.
Network Size The total number of nodes of a network.
Table 1:Important terms and definition.
Several mechanisms can contribute to the diffusion of knowledge between organizations. A convenient distinction may be made between those knowledge transfer processes embedded in the normal activity of firms as a mean to fulfil its objectives, and those which are facilitated by the unavoidable social interaction of their members, but do not respond to any business goal and sometimes are even in conflict with them. Social network analysis developed mainly in the second half of the 20th century putting together three different research strands in sociology: the study of interpersonal relationships and the formation of “cliques” and the study of the structure of “community” relations in tribal and village societies. College students come from different place but have similar knowledge structure, different thinking patterns and cognitive style. They gather to a learning organization. They learn from each other's strengths to offset their own weaknesses and knowledge diffusion among them is easy. The knowledge diffusion in this network is the process of the exchange of knowledge. Social networks analysis is used to quantify the mode and flow direction of the knowledge diffusion among the members. Krackhardt[2] separated social network into three styles: emotional relationship network, counseling relationship network, intelligence relationship network.
IV.RESEARCHAPPROACHTOKNOWLEDGEDIFFUSIONIN SOCIALNETWORK
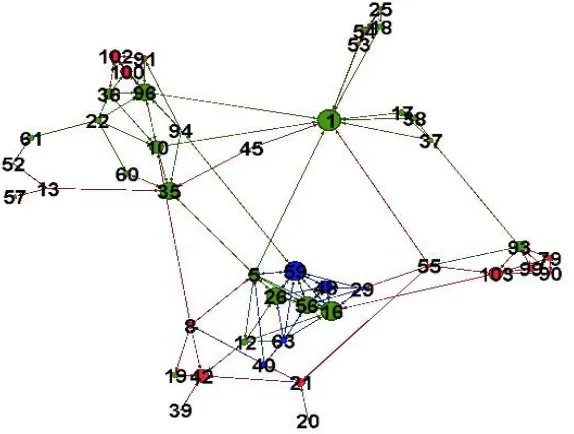
In this work we collect data set from computer science department of Kalyani Government Engineering College. This paper use empirical analysis method to analyze the social network of a undergraduate organization formed up by the characteristics of the knowledge diffusion among university students. The study was based on collected data from the student. Some questionnaires were issued about campus interview and 45 valid responsive sheets were collected. For social network analysis we have to choose a complete class, so this class was chosen for analysis. There are 45 student who gave their answer in feedback form about campus interview. In order to protect the privacy of personal information, the roll number have been used in place of all the names of students. Figure 1 show the counseling relationship network of this class.
Figure 1: Counseling Relationship network.
Also we analyze the social network in terms of network density, network centrality and cohesive subgroup.
Network Density: Network density describes the ratio of the potential connections and actual connections. A potential
connection is a connection that may be exist between two nodes. If the network have n node then there are “n*(n-1)/2” potential connection in the network. And actual connection is one that actually exists.
Density is a very important factor in social network analysis. It refers to the occlusive and close together degree of point-to-point communication link in the figure. The more edge attachment on a fixed point means ,the more dense point are. At a family the actual connections between people are may be a hundred percent of all the potential relationships in the room. The actualconnections between people on a public bus – the number of people who actually know each other – is likely to be quite low relative to all the potential relationships there.
Potential Connection:
Pc= n*(n-1)/2
Network density:
Centrality: In graph theory and network analysis centrality[9] refers to indicators which identify the most important vertices within a graph. Applications include identifying the most influential person(s) in a social network. There are three types of centrality, degree centralities, between centrality and closeness centrality. Degree centrality is the structure pointer used to calculate the most main factor of a person in a group network. Between centrality means that if an actor is on the track of many communication. networks, we think the actor occupy an important position. The actor has the ability to control the association of the other two. Closeness centrality means an actor can contact with many people directly or indirectly in the network.
Cohesive Subgroup: One of the major concerns of social network analysis is identification of cohesive subgroups of
actors within a network. Cohesive subgroups are subsets of node among whom there are relatively strong, frequent, or positive ties. By separating the subgroup from the social network, we can know the influence of the subgroup on the cluster networks. We analyze this to find out the close degree of the actors.
V.RESEARCHTOOLS
There are many social network analysis simulation software like GEPHI is the most used by the researchers for social networks analysis. For network visualization GEPHI is used in this research and get two network: Counseling Relationship network (figure 1) and intelligence relationship network (figure 3). Also use UCINET software for measuring centrality, density.
VI.RESULTANALYSIS
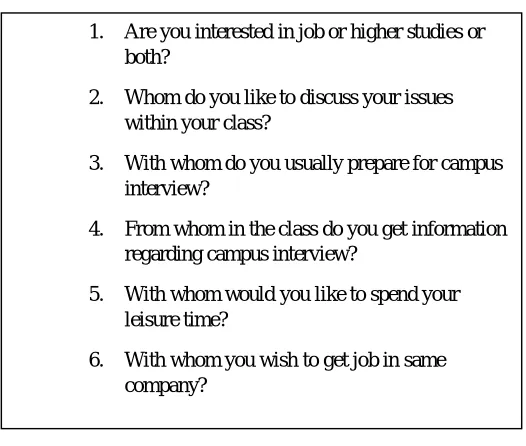
Table 2: RELATIONSHIP NETWORK QUESTIONNAIRE
In this work 6 question (table 2) were issued and 45 valid responsive sheets were collected in the class. And two network: counseling relationship network ( figure 1) and intelligence relationship network ( figure 3) are formed by simulation based on the responsive sheets.
In the figure 1 we see that there are three type of node, red which are interested in job, blue which are interested in higher studies and green which are interested in both. Now we have to find network density, network centrality and cohesive subgroup.
1. Are you interested in job or higher studies or both?
2. Whom do you like to discuss your issues
within your class?
3. With whom do you usually prepare for campus
interview?
4. From whom in the class do you get information
regarding campus interview?
5. With whom would you like to spend your
leisure time?
6. With whom you wish to get job in same
Network Density: Network density has very important role to study the knowledge diffusion in social network analysis. If the network density is very low in one organization, the relationship of the people is distant and indifferent. There are not many contacts among the people. This kind of human network will go against knowledge diffusion. If the network density is too high, the knowledge diffusion may be slow in the organization too. For this relationship network, six questions are involved in this research thus forming a counseling relationship network (Figure 1). We can acquire the average density of the network 0.072 by simulation ( figure 2). From the simulation we can see that network density of the network is very low, that means the relation between the student in the class is distant.
Figure 2: network density
Network Centrality: Centrality is one of the main factor in social network analysis. We use this parameter to measure
whether an individual is important and measure the superiority of an individual in the network. We measure three type of centrality degree centrality, between centrality and closeness centrality.
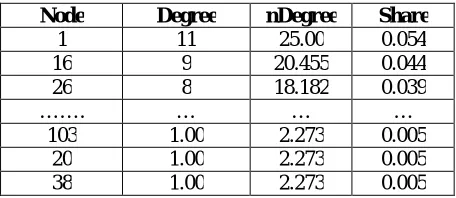
Degree Centrality: A node's degree centrality is defined as the number of nodes that are connected to that node.
The definition dictates that “central actors must be the most active in the sense that they have the most ties to other actors in the network or graph”. By simulation we can see that node 1, 16, 26 occupy the central position in the class (figure 1).
t
he degree centrality of the node 1 is 25.00 (table3). Next come the node 16 which have degree centrality 20.455. The degree centrality is the reflection of the number of the other nodes that one node is in direct contact with. For example node 1, 16, 26 has the largest number of direct contacts with the other members. Node 38 & 20 has the smallest degree. The degree centrality of the whole network is 25.38%. The result show that relation of the student in the class are close enough. Then network centralization is 15.38%.Node Degree nDegree Share
1 11 25.00 0.054
16 9 20.455 0.044
26 8 18.182 0.039
……. … … …
103 1.00 2.273 0.005
20 1.00 2.273 0.005
Between Centrality: Between centrality is an indicator of a node's centrality in a network. Between Centrality is the number of shortest paths from all vertices to all others that pass through that node. A node with high between centrality has a large influence on the transfer of items through the network, under the assumption that item transfer follows the shortest paths. The between centrality of 5 is the highest, reached 23.085% (table 4). Next comes 1 at 17.862%. The between centrality of 5 and 1 are high too. Most of the node have between centrality too low. The between centrality of the whole network is 20.28%. This implies that this network is good for knowledge diffusion in quick. Knowledge can be Diffused quickly in the organization, while it is not easy to learn new knowledge from the outside world. Between centrality can be calculated by equation number 1.
k j jk jkB
i
g
i
g
C
(
)
(
)
/
...(1)Where gjk = the number of shortest paths connecting jk
gjk(i) = the number that actor i is on.
Node Betweenness nBetweenness
5 436.764 23.085
1 337.940 17.862
10 324.500 17.151
….. ….. …..
42 0.00 0.00
79 0.00 0.00
52 0.00 0.00
Table 4:Between centrality
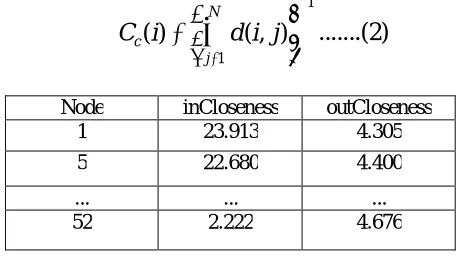
Closeness Centrality: Average distance from a given node to all others node in the network is closeness centrality of
that node. Closeness is based on the length of the average shortest path between a vertex(node) and all vertices in the graph. Closeness centrality can be calculated by equation number 2.
1 1
)
,
(
)
(
N jc
i
d
i
j
C
...(2)
Node inCloseness outCloseness
1 23.913 4.305
5 22.680 4.400
... ... ...
52 2.222 4.676
Table 5: Closeness Centrality
Cohesive Subgroup: One of the major concern of social network analysis is identification of cohesive subgroup of
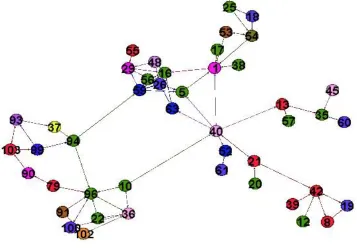
Figure 3: Intelligence relationship network
THE QUESTIONS RELATED WITH INTELLIGENCE RELATIONSHIP NETWORK
96,10,91,100,22,102,36 form a small group and we shall designate it by small group A (figure 3) .94,37,99,93,103 form a small group and we shall designate it by small group B. 26,16,48,55,29,56 form a small group and we shall designate it by small group C. 42,39,12,8,19 form a small group and we shall designate it by small group D. 13, 57, 35, 45, 60 form a small group and we shall designate it by small group E. 52 and 61 are close together but isolated from the network. The remainder forms a small group and we shall designate it by small group F. The connection between the two groups is known as the Bridge. The bridge between group A and group B is node 79, the bridge between group B and group C is 59, the bridge between group C and group E is 40.It is hard to diffuse knowledge quickly and efficiently in the class when new knowledge come .we did interviews with the supervisor in this class and found several groups did exist in the class. There is very little communication between them and it is very difficult for them to discuss together during class discussion .we see from the figure that 79,40,59 works As the bridge of the group and transmitter of various kinds of information. They are also the greatest benefits of knowledge diffusion. Comparing with the facts, we found that 79, 40, 59 are not only outstanding but also quite active in the class.
2. Whom do you like to discuss your issues within your class?
3. With whom do you usually prepare for campus interview?
4. From whom in the class do you get information regarding campus
VII.CONCLUSION
This study analyzed the knowledge diffusion in social network of university student. In this study we examined what exactly social network are, how they formed. Also we examined three particular network parameter: network density, network centrality, and cohesive subgroup in the network. Also we find that who are in the central position in the network, who are the most influential student in the network. From this work it can be conclude that knowledge diffusion in organization can be describe clearly by social network analysis. There are still some shortcomings in this research to be improved. It is hard to get good questionnaire to carry out social networks analysis. It is hard to take the characteristics of college students. We did not analyze any correlation between the two network: counseling relationship network and intelligence relationship network.
REFERENCES
[1] Huosong Xia, Ruixin Wang, Shaolong Hu, ”Social Networks Analysis of the Knowledge Diffusion among University Students”, Second International Symposium on Knowledge Acquisition and Modeling. pp. 343-346, 2009.
[2] Krackhardt, David, “The Strength of Strong Ties: the Importance of philos in Organizations”. Harvard Business School Press, 1992. [3] Ulrik Brandes,” A Faster Algorithm for Betweenness Centrality” , Mathematical Sociology 25(2): pp.163-177, 2001.
[4] Chao-Chih Hsueh, Chun-Chieh Wang, “The Use of Social Network Analysis in Knowledge Diffusion Research from Patent Data “, Advances in Social Network Analysis and Mining, pp. 393-398, 2009.
[5] Burt,R.S., Minor,M.J.,&Associates.(1983).Appliednetworkanalysis.BeverlyHills,CA:Sage.
[6] Laumann,E.O.,&Pappi,F.U.(1976).Networksofcollectiveaction:Aperspectiveoncommunityinfluencesystem.NewYork:AcademicPress. [7] Marshall, Alfred (1920): Principles of Economics, 8th edn. London, U.K.: Macmillan, 1920.
[8] Io Taxidou, “Realtime Analysis of Information Diffusion in Social Media”, Proceedings of the VLDB Endowment, Vol. 6, No. 12, pp.1416-1421.
[9] Linton C. Freeman, “Centrality in Social Networks Conceptual Clarification”, Social Networks, 1 (1978/79) pp. 215-239. [10] Stacey R. Complex Responsive Processes in Organizations [M]. London: Routledge, 2001.