Reliability Analysis of Multi-Storey Building
with Floating Column for Long Span
Kuldeep Dubey 1, Dr. Rakesh Patel 2
M.Tech Scholar, Department of Structural Engineering, Sagar Institute of Research, Technology & Science,
Bhopal, India1
Asst. Professor, Department of Civil Engineering, Sagar Institute of Research, Technology & Science, Bhopal, India2
ABSTRACT: In today life it is very difficult to make a building with floating column in urban India. This technology is highly undesirable in building built in earthquake active areas. This study provide knowledge about the importance of presence of the floating column in the analysis of building. This study is about stiffness balance of the first storey and the storey above, and are proposed to reduce the irregularity introduced by the floating columns. This study is related to floating column placed on long span transfer beam.
For the study of buildings with floating column we used FEM codes for 2D multistory frames to study the responses of the structure under different earthquake excitation having different frequency content keeping the time duration factor constant. The time history of floor displacement, inter storey drift, base shear, overturning moment are computed for the frames with floating column.
KEYWORDS: Floating column, Earthquake active area, Irregularities remove, Stability for long span, Transfer beam.
I. INTRODUCTION
A vertical member which is start from the foundation level is known as column. Floating Column is also a vertical member which is started from the horizontal member called beam. i.e. floating column is not started from the ground. it is footing less vertical member. The beam which is act as foundation is called as transfer beam this is widely used in above open storey in building.
Why Floating Column
1. This helps to alter the plan of top floors to our convenience, the transfer beam that support floating columns will be designed with more reinforcement.
2. And transfer the load of above storey of building at specific column safely.
Objective Of Work
1. The objective of present work is to study the behaviour of multi-storey building with floating column under earthquake excitation.
2. Remove ir-regularity in multi-storey building.
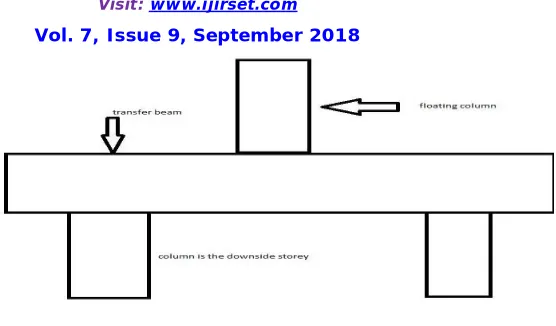
fig. no.1:- line diagram
In fig. 1, two vertical column which is start from ground is known as column and the column which start from transfer beam is known as floating column.
II. RELATEDWORK
There are some research which is related to our work. Research are as follows-
1. Tamner and Talikoti [2016]- It gives the strength to the building when the horizontal beam designed safely, it gives 46.17% more strength.
2. Ashfi rahman(2015) – In this paper static and dynamic analysis is done with response spectrum method for a multi-storey with and without floating column. This analysis is done by using STAAD pro v8i software in this research floating column position is changed in a floor and the floating column is changed in a storey results are based on the fundamental time period, spectral acceleration, base shear, storey drift and storey displacement. 3. Sekhar and Prasad(2014) – in this paper the behavior of building structure with floating column and without
floating column is studied under static load, forced and free vibration condition and the results are plotted for both the frames by comparing time history of floor displacement and base shear the static analysis of building frame is done by software STADD pro v8i and comparison of these models are presented. So that this study help us to find the analytical properties of the structure and we can constructed the building structure with systematic and economical type.
4. Ozyigit (2009) performed free and forced in-plane and out-of-plane vibrations of frames are investigated. The beam has a straight and a curved part and is of circular cross section. A concentrated mass is also located at different points of the frame with different mass ratios. FEM is used to analyze the problem.
III. METHODOLOGYANDDISCUSSION
Analysis By STAAD ProV8i SOFTWARE. 1.Static Analysis
Plane Frame Element 2.Dynamic Analysis Time History Analysis New mark's Method
STATIC ANALYSIS:- This analysis is done by plane frame element.
PLANE FRAME
ELEMENT:-1. Plane frame element is a finite element method in this method stiffness matrix is used to solve the problem. 2. This is 2-D finite element method with two co-ordinate namely local and global.
3. Plane frame element having area(A), length(L), elasticity(E) and moment of inertia(I). 4. In this method each element has two nodes.
5. In this method each node have 2 displacement and 1 rotation are available. So plane frame element has degree of freedom. i.e. 6 no
6. So stiffness matrix generally 6X6 matrix.
DYNAMIC ANALYSIS:-
1. Dynamic analysis of any building structure is a branch of structural engineering in which we study the behaviour of flexible building due to dynamic loading. This dynamic load changes according to time. 2. Dynamic load include earthquake, wind and live load etc.
3. In comparison with static analysis, displacement and stresses are much higher. This is find by following method-
TIME HISTORY
ANALYSIS:-1. Time history analysis is a finite element method. This method use to calculate the response at discrete time, but this method required more calculation effort.
2. This method is used to calculate the mode shape of the building structure according to load condition by using some numerical calculation.
3. This method is used for break the coupled equation into uncoupled equation. This make solution easy. [M]{X”}+[C]{X’}+[K]{X} = X”g(t)[M]{I}---(coupled equation)
[M]{q”}+[C]{q’}+[K]{q} = {Peff.(t)}--- ---(uncoupled equation)
4. After all the calculation we can get the participation factor of building according to mode shape. {Peff.(t)} = (-X”g(t)[Ø]^T[M]{I})
5. This participation factor further solve by numerical method. That is new mark's method.
NEWMARK’S
METHOD:-Using boundary condition on displacement and initial velocity condition, we get the solution of new mark's equation. By the help of this equation we can easily solve the time history analysis equation and get the participation factor, by the help of this factor mode shape of the building is determine.
Data of building structure are as follows-
varies according to span condition, Size of beam and column is depend on the condition of load. This is ordinary moment resisting frame, Depth of foundation is 2M in Medium soil condition.
INPUT DATA OF LOADING:-
Type of load (dead) Intensity(KN/M) 1. Member load(outer wall of ground floor) = 14.4
2. Member load(inner wall of ground floor) = 7.21 3. Member load(inner wall 1st and 2nd floor)= 11.88 4. Member load(outer wall 1st and 2nd floor) =5.94 5. Member load(top parapet wall) =1.8 6. Floor weight (KN/M2) =3
In terms of floor load live load is acting this is 3 KN/M^2
.
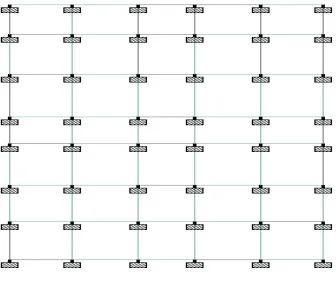
fig. no. 2:- plan of building with fc
fig.2 shows structure dimension with fc and without fc. Red in colour is fc; start from 1st storey.
fig.no. 3:-plan of building without fc
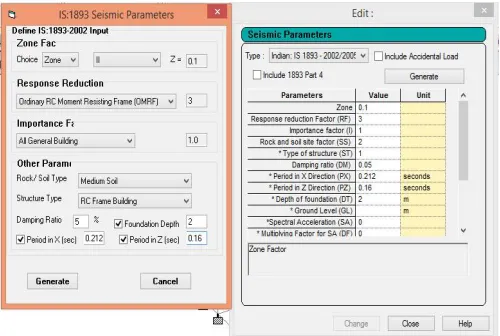
table no. 1:- input values in staad
Table 1 shows input values of building with zone, type of frame etc. In staad pro.
IV. EXPERIMENTALRESULTS
STATIC RESULTS:-
1. Maximum results of g+2 storey building on column:-
table no. 2:-values on columns
No. Content TYPE OF
BUILDIN G
GROUN D FLOOR
FIRST FLOO R
SECON D FLOOR
1. DISPLACEMEN T (mm)
WITH FC 4.779 13.481 13.845
WITHOUT FC
3.860 6.7000 8.555
2. BENDING MOMENT (kN-m)
WITH FC 59.656 80.529 59.608
WITHOUT FC
19.116 17.440 15.156
3. SHEAR FORCE (kN)
WITH FC 37.823 22.497 22.312
WITHOUT FC
10.442 12.324 9.314
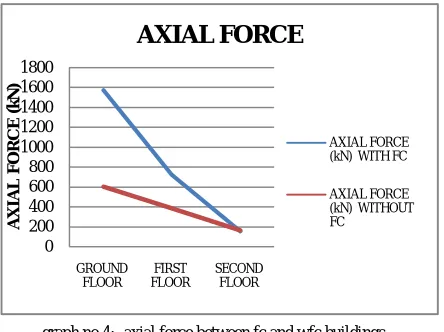
4. AXIAL FORCE (kN)
WITH FC 1570 720.616 152.748
WITHOUT FC
601.692 384.402 162.344
graph no.1:- displacement between fc and wfc buildings
in graph 1 displacement between fc and without fc building in columns due to horizontal as well as vertical load. By this load building gives the above value in displacement in staad software for maximum load combination.
graph no.2:- bending moment between fc and wfc buildings
in graph 2 BM between fc and without fc building in columns due to horizontal as well as vertical load. By this load building gives the above value in BM in staad software for maximum load combination.
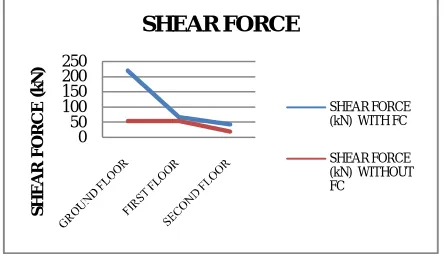
graph no.3:- shear force between fc and wfc buildings 0 5 10 15 GROUND FLOOR FIRST FLOOR SECOND FLOOR D IS P LA C EM EN T
DISPLACEMENT
DISPLACEMENT (mm) WITH FCDISPLACEMENT (mm) WITHOUT FC 0 20 40 60 80 100 BEN D IN G M O M EN T (k N -m ) BENDING MOMENT BENDING MOMENT (kN-m) WITH FC BENDING MOMENT (kN-m) WITHOUT FC 0 5 10 15 20 25 30 35 40 GROUND FLOOR FIRST FLOOR SECOND FLOOR S H EA R F O R C E (k N )
SHEAR FORCE
SHEAR FORCE (kN) WITH FCin graph 3 shear force between fc and without fc building in columns due to horizontal as well as vertical load. By this load building gives the above value in shear force in staad software for maximum load combination.
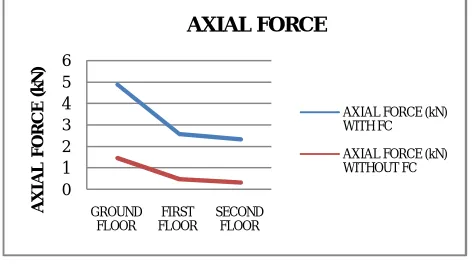
graph no.4:- axial force between fc and wfc buildings
in graph 4 axial force between fc and without fc building in columns due to horizontal as well as vertical load. By this load building gives the above value in axial force in staad software for maximum load combination.
2. Maximum results of g+2 storey building on beam
:-table no. 3:- maximum values on beam
No. Content TYPE OF BUILDING GROUND FLOOR FIRST FLOOR SECOND FLOOR
1. DISPLACEMENT (mm) WITH FC 13.788 15.133 15.300
WITHOUT FC 6.127 8.353 8.649
2. BENDING MOMENT (kN-m) WITH FC 344.718 77.007 57.881
WITHOUT FC 54.544 47.340 6.440 3. SHEAR FORCE (kN) WITH FC 219.388 66.856 42.435
WITHOUT FC 53.584 53.118 19.505 4. AXIAL FORCE (kN) WITH FC 4.884 2.589 2.334
WITHOUT FC 1.449 0.482 0.322 0
200 400 600 800 1000 1200 1400 1600 1800
GROUND FLOOR
FIRST FLOOR
SECOND FLOOR
A
X
IA
L
F
O
R
C
E
(k
N
)
AXIAL FORCE
AXIAL FORCE (kN) WITH FC
Table 3 shows different values of displacement, BM, SF, AF in beam of FC and WFC building.
graph no.5:- displacement between fc and wfc buildings
in graph 5 displacement between fc and without fc building in beams due to horizontal as well as vertical load. By this load building gives the above value in displacement in staad software for maximum load combination.
graph no.6:- bending moment between fc and wfc buildings
in graph 6 BM between fc and without fc building in beams due to horizontal as well as vertical load. By this load building gives the above value in BM in staad software for maximum load combination.
graph no.7:- shear force between fc and wfc buildings 0 50 100 150 200 250 300 350 400 GROUND FLOOR FIRST FLOOR SECOND FLOOR BEN D IN G M O M EN T (k N -m )
BENDING MOMENT
BENDING MOMENT (kN-m) WITH FC BENDING MOMENT (kN-m) WITHOUT FC 0 5 10 15 20 D IS P LA C EM EN T (m m ) DISPLACEMENT DISPLACEMENT (mm) WITH FCDISPLACEMENT (mm) WITHOUT FC 0 50 100 150 200 250 S H EA R F O R C E (k N ) SHEAR FORCE SHEAR FORCE (kN) WITH FC
in graph 7 shear force between fc and without fc building in beams due to horizontal as well as vertical load. By this load building gives the above value in shear force in staad software for maximum load combination
graph no.8:- axial force between fc and wfc buildings
in graph 8 axial force between fc and without fc building in beams due to horizontal as well as vertical load. By this load building gives the above value in axial force in staad software for maximum load combination
DYNAMIC ANALYSIS:-
1.Mode shape of framework:-
table no. 4:- mode shape of building
MODE TYPE OF BUILDING FREQUENCY(CYCLE/SEC) PEROID(SEC)
1 WITH FC 1.211 0.82579
WITHOUT FC 0.968 1.03272
2 WITH FC 1.227 0.81526
WITHOUT FC 0.982 1.01796
3 WITH FC 1.388 0.72068
WITHOUT FC 1.064 0.93989
4 WITH FC 3.362 0.29744
WITHOUT FC 3.051 0.32774
5 WITH FC 3.398 0.29428
WITHOUT FC 3.083 0.32435
6 WITH FC 3.787 0.26408
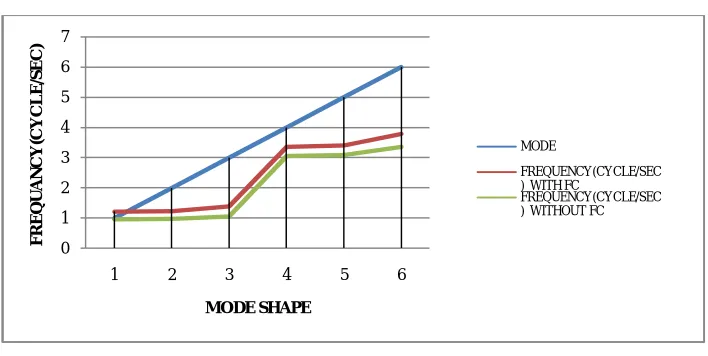
WITHOUT FC 3.358 0.29778 Table 4 shows the different mode shapes at different load combinations in building with FC and WFC building.
0 1 2 3 4 5 6
GROUND FLOOR
FIRST FLOOR
SECOND FLOOR
A
X
IA
L
F
O
R
C
E
(k
N
)
AXIAL FORCE
graph no.9:-mode shape of building
in graph 9 mode shapes between fc and without fc building due to horizontal as well as vertical load. By this load building gives the above value in mode shape in staad software for maximum load combination.
2. Is code time history:-
table no. 5:- time history
MODE TYPE OF BUILDING SPECTRAL ACCELERATION DESIGN SEISMIC COEFFICIENT
X Y Z 1 WITH FC 1.64692 0.0593 0.0000 0.0593
WITHOUT FC 1.31691 0.0474 0.0000 0.0474 2 WITH FC 1.66818 0.0601 0.0000 0.0601 WITHOUT FC 1.33600 0.0481 0.0000 0.0481 3 WITH FC 1.88710 0.0679 0.0000 0.0679 WITHOUT FC 1.44698 0.0521 0.0000 0.0521 4 WITH FC 2.50000 0.0900 0.0000 0.0900 WITHOUT FC 2.50000 0.0900 0.0000 0.0900 5 WITH FC 2.50000 0.0900 0.0000 0.0900 WITHOUT FC 2.50000 0.0900 0.0000 0.0900 6 WITH FC 2.50000 0.0900 0.0000 0.0900 WITHOUT FC 2.50000 0.0900 0.0000 0.0900 Table 5 shows dynamic analysis of building with respect to time history analysis.
0 1 2 3 4 5 6 7
1 2 3 4 5 6
F
R
EQ
U
A
N
C
Y
(C
Y
C
LE/
S
EC
)
MODE SHAPE
MODE
FREQUENCY(CYCLE/SEC ) WITH FC
3. Storey drift v/s time response :-
table no. 6:- story drift in building
STOREY HEIGHT LOAD TYPE OF BUILDING AVG. DISPLACEMENT(CM) DRIFT(CM)
X Z X Z
BASE 0.00 ---- WITH FC ---- ---- ---- ---- WITHOUT FC --- --- --- ---
1 0.00 1 WITH FC 0.0000 0.0000 0.0000 0.0000 WITHOUT FC 0.0000 0.0000 0.0000 0.0000 2 3.66 1 WITH FC -0.0043 -0.0042 0.0043 0.0042 WITHOUT FC 0.0000 -0.0030 0.0000 0.0030 3 6.71 1 WITH FC -0.0050 -0.0002 -0.0007 0.0040 WITHOUT FC 0.0000 -0.0063 0.0000 0.0033 4 9.76 1 WITH FC 0.0017 0.0121 0.0067 0.01223
WITHOUT FC 0.0000 -0.0106 0.0000 0.0042 Table 6 shows the value of displacement and drift value of building with FC and WFC.
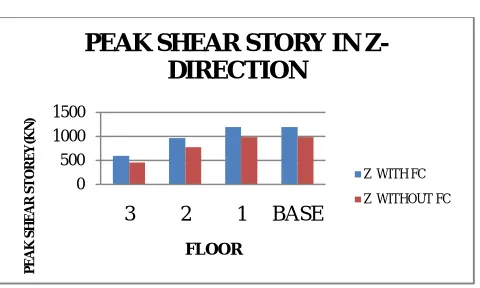
4. Peak storey shear:-
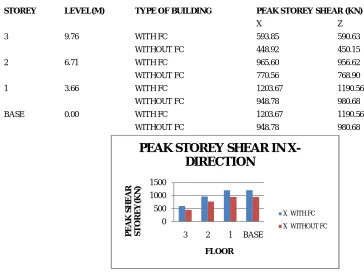
table no. 7:- storey shear in building
STOREY LEVEL(M) TYPE OF BUILDING PEAK STOREY SHEAR (KN)
X Z
3 9.76 WITH FC 593.85 590.63 WITHOUT FC 448.92 450.15 2 6.71 WITH FC 965.60 956.62 WITHOUT FC 770.56 768.90 1 3.66 WITH FC 1203.67 1190.56
WITHOUT FC 948.78 980.68 BASE 0.00 WITH FC 1203.67 1190.56
WITHOUT FC 948.78 980.68
graph no.10:- peak shear in x and z-direction between fc and wfc buildings
in graph 10 shear storey in X- direction between fc and without fc building due to horizontal as well as vertical load. By this load building gives the above value in storey shear in staad software for maximum load combination.
0 500 1000 1500
3 2 1 BASE
P
EA
K
S
H
EA
R
S
TO
R
EY
(K
N
)
FLOOR
PEAK STOREY SHEAR IN
X-DIRECTION
graph no.11:- peak shear in x and z-direction between fc and wfc buildings
in graph 11 mode shapes between fc and without fc building due to horizontal as well as vertical load. By this load building gives the above value in shear storey in Z- direction in staad software for maximum load combination
5. Cost /material quantity analysis:-
Table no. 8:- cost-material table
TYPES OF BUILDING
MATERIAL RATE TOTAL
COST
COCRETE(M3) REINFORCEMENT(TONNE)
COCRETE/M3 R/F/TONNE
WITH FC 175.90 174.152 3380 40000 7560622
WITHOUT FC 127.70 147.936 3380 40000 6349066
Table 8 shows cost analysis between reinforcement and concrete for FC and WFC building.
V. CONCLUSION
In this analysis we get the following conclusion-
1. When we applied static load on both buildings; then both buildings are found safe.
2. In dynamic load; with floating column structure is found unsafe. i.e. In earthquake this building found unsafe. So to make the structure safe beams and columns size are to be increased.
3. With the increase in size the quantity of concrete material is increased by 27.40%.
4. With the increase in displacement, bending moment, shear force and axial force in beams and columns in the structure reinforcement increased by 15.05%.
5. Increase in quantity of concrete and reinforcement building cost is increased by 16.02%.
6. After increasing size and providing reinforcement; building found safe in dynamic load in stadd pro analysis. Thickness of supporting beam is reduce upto 500mm.
7. In column at which supporting beam is rest, no. of reinforcement is find more. so reinforcement is increases and cross sectional area is increases.
8. By introducing floating column, irregularities are removed from the structure.
9. By applying floating column in structure building make serviceable for utilization purpose. 0
500 1000 1500
3 2 1 BASE
P
E
A
K
S
H
E
A
R
S
T
O
R
E
Y
(K
N
)
FLOOR
PEAK SHEAR STORY IN
Z-DIRECTION
REFERENCES
1. Agarwal Pankaj, Shrikhande Manish (2009), “Earthquake resistant design of structures”, PHI learning private limited, New Delhi edition
1st-2009.
2. Arlekar Jaswant N, Jain Sudhir K. and Murty C.V.R, (1997), “Seismic Response of RC Frame Buildings with Soft First Storey”.
Proceedings of the CBRI Golden Jubilee Conference on Natural Hazards in Urban Habitat, 1997, New Delhi.
3. James L. Stratta, Manual of seismic design, published by pearson education, first edition, ISBN 81-297-0180-4, 2003.
4. B.c. Punmia, Ashok ku. Jain, at.el. Theory of structure, Laxmi publication (p) LDT.2013.
5. Awkar J. C. and Lui E.M, “Seismic analysis and response of multistory semi-rigid frames”, Journal of Engineering Structures, Volume 21,
Issue 5, Page no: 425-442, 1997.
6. Prasannan and matew(2017)- seismic performance of rc floating column considering different configuration. IJERT, vol.6, issue 9, may
2017, pp. 100-107.
7. Sukumar behera, NIT, ROURKELA(2012)- report about floating column in seismic zone, dept. Of civil engineering, NIT,
Rourkela,769008, may 2012.
8. Waykule and pise (2016)- study of behaviour of floating column for seismic analysis of multi-storey building.IJCIET, vol.7 issue 6,
nov.-dec. 2016, pp. 676-685.
9. Nanabala and ramancharla(2004)- seismic analysis of a normal building and floating column building. IJERT, vol. 3, issue 9, sep. 2014, pp.
981-987.
10. SOR PWD for taking values of concrete and reinforcement rate. Addendum no. 05, chapter 13, w.e.f. 01-08-2014.
11. IS456- 2000, plain and reinforced concrete - code of practice, fourth revision, july 2000.