This information is presented under authority granted the North Carolina Agricultural Research Service to conduct performance tests, including interpretation, of data to the public, and does not imply endorsement or recommendation by North Carolina State University. Any use of data or information presented in thi~
Research Report No. 92 JUly, 1983
Measured Crop Performance
SMALL GRAIN
1983
D. T. BOWMAN, Assistant Professor In Charge of Variety Testing
Department of Crop Science
NORTH CAROLINA STATE UNIVERSITY
TABLE OF CONTENTS
I NTRODUCTI ON .
COMPARING VARIETIES .
EXPERIMENTAL PROCEDURE 5
Entries 5
Field Plot Design 5
Crop Management 5
Agencies Sponsoring Entries ,... 9
Cooperators 9
SEASONAL CONDITIONS 10
RESULTS AND DISCUSSION 11
Bar1 ey 11
Oats 11
Wheat 12
Wheat and Flour Analyses 13
TABLES
1. Characteristics of barley varieties 3
2. Characteristics of oat varieties 3
3. Characteristics of wheat varieties 4
1983
PERFORMANCE OF SMALL GRAIN VARIETIES IN NORTH CAROLINA!! INTRODUCTION
Across the State of North Carolina during the spring of 1982, growers harvested 63,000 acres of barley, 85,000 acres of oats, and 600,000 acres of wheat. Average yields across the state were 52, 57, and 36 bushels per acre for barley, oats, and wheat, respectively.
With the large number of commercially available and prospective varieties of barley, oats, and wheat, it becomes difficult for growers to select a superior variety suited for their particular area of the state. To make this decision the grower needs up-to-date, unbiased, reliable information. The Official Variety Testing Program, through this report, seeks to provide that type of information.
Information on varietal performance is presented from five test locations in the state--two in the Piedmont, and three in the Coastal Plain. Also included are multiple-year performance data on a selected number of varieties.
COMPARING VARIETIES
Performance of a variety cannot be determined with absolute precision Even though the tests are conducted in a uniform manner, as much as possible, uncontrollable variability exists among experimental plots due to soil, fertility, moisture, insects, diseases, and other sources of variation. Because this variability exists, statistics are used as a tool
2
to determine differences among varieties. The size of difference among varieties which may have been due to chance variation is listed in each table as the B.L.S.D. {least significant difference}. Those varieties which do not differ by more than the B.L.S.D. are not statistically different.
Varietal performance may appear inconsistent among locations within an area or among years at a particular location, thus it is important for the reader to examine results from more than one location within an area or more than one year at a particular location to obtain a more accurate picture of relative varietal performance. An effort has been made to facilitate comparisons among locations and years in this report.
The varieties which do not yield significantly less than the highest yielding variety are denoted by an asterisk
{*}
next to their yields. Therelative performance of a variety across locations within an area can be easily evaluated by going across the table; those varieties which are most frequently marked by an asterisk would be highly desirable. Other agronomic characteristics may be as equally important as yield. All available data regarding pathologic and agronomic characteristics of the varieties are found in Table 1, 2, and 3 for barley, oats, and wheat,
respectively.~
It is suggested that the grower plant a small n~mber of acres in a new variety when first determining if it is adapted to his farm.Table 1. Characteristics of barley varieties*
Mildew Rust Scald Lodging Winter Test Length
resist- resist- resist- resist- hardi- Maturity Weight of
Variety ance ance ance ance ness 1b/bu awns
Anson Fair Good Fair Good Good Medium Medium Awnless
Boone Fair Good Fair Good Good Medium High Short
C1 ayton Good Excellent Fair Good Good Medium Medium Awnless
Keowee Good Poor Fair Good Good Medium High Short
Milton Fair Good Poor Excellent Good Early Medium Short
Redhi11 Good Good Fair Good Good Early Medium Awnless
Sussex Excellent Poor Excellent Good Fair Early Low Short
Table 2. Characteristics of oat varieties* w
Rust Smut Mosaic Winter Lodging Test
resist- resist- resist- Maturity hardi - resist- Weight
Variety ance ance ance ness ance 1b/bu
-Brooks Fair Good Good Early Good Good Med. High
Coker 716 Fair Good Good Medium Good Good Med. High
Madison Fair Good Good Med. Early Fair Excellent Medium
Coker 80-20 Good Good Good Very Early Fair Excellent Med. High
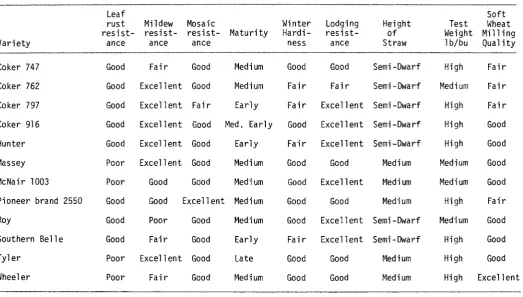
Table 3. Characteristics of wheat varieties*
Leaf Soft
rust Mildew Mosaic Winter Lodging Height Test Wheat
resist- resist- resist- Maturity Hardi- resist- of Weight Milling
Variety ance ance ance ness ance Straw 1b/bu Quality
Coker 747 Good Fair Good Medium Good Good Semi-Dwarf High Fair
Coker 762 Good Excellent Good Medium Fair Fair Semi -Dwarf Medium Fair Coker 797 Good Excellent Fair Early Fair Excellent Semi-Dwarf High Fair Coker 916 Good Excellent Good Med. Early Good Excellent Semi-Dwarf High Good
Hunter Good Excellent Good Early Fair Excellent Semi-Dwarf High Good
Massey Poor Excellent Good Medium Good Good Medium Medium Good
McNair 1003 Poor Good Good Medium Good Excellent Medium Medium Good
~
Pioneer brand 2550 Good Good Excellent Medium Good Good Medium High Fair
Roy Good Poor Good Medium Good Excellent Semi-Dwarf Medium Good
Southern Belle Good Fair Good Early Fair Excellent Semi-Dwarf High Good
Tyler Poor Excellent Good Late Good Good Medium High Good
Wheeler Poor Fair Good r~edium Good Good ~1edium High Excellent
5
EXPERIMENTAL PROCEDURE
The state is divided into physiographic regions and tests were located in the Piedmont and Coastal Plain (Figure 1). Two tests were located on private farms}! and three were on research stations.
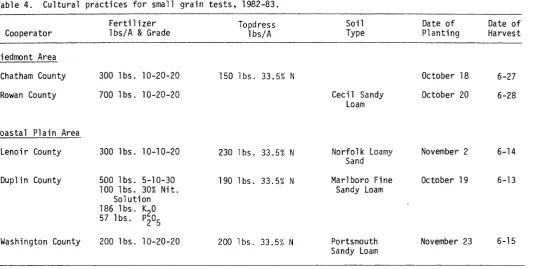
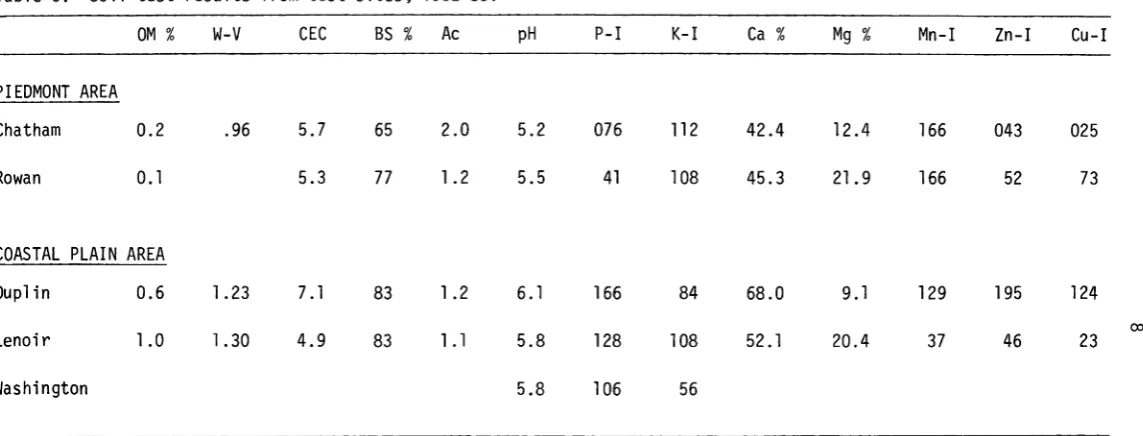
Entries: Commercial varieties and experimental lines developed by public and private agencies are included in these tests. Any individual or firm may make application for having entries included by writing the Department of Crop Science, North Carolina State University at Raleigh. A fee is charged on an entry basis for all private entries. Entries about which further information was desired may have been included on a no-fee basis. A total of 10,7, and 23 commercial varieties and experimental lines of barley, oats, and wheat, respectively, were evaluated in the 1982-83 season. Field Plot Design: A randomized, complete block design with four or six replications was used at each 10cation.~ Each plot consisted of seven rows, seven inches apart, sixteen feet long with two feet between each plot. Crop Management: Cultural practices, such as seed bed preparation, date of planting, fertilization and topdressing were in accord with good farming practices and were uniform for all entries at a given location (Table 4). Several months prior to planting each test, soil samples were obtained from the test field and fertilizer and lime applications were made accordingly (Table 5).
~The cooperative spirit and civic-minded service rendered by the farmers who provided the land and the necessary cultural practices for these trials and the cooperation of the county agents are gratefully acknowledged. lIStatistical analyses were made in the statistical laboratory under the
• Signifies Official Variety Test Locations
FIGURE 1-LOCATION OF SMALL GRAIN PERFORMANCE TRIALS
1983
Table 4. Cultural practices for small grain tests, 1982-83.
Fertilizer Topdress Soi1 Date of Date of
Cooperator 1bs/A
&
Grade 1bs/A Type Planting HarvestPiedmont Area
Chatham County 300 1bs. 10-20-20 150 lbs. 33.5% N October 18 6-27
Rowan County 700 lbs. 10-20-20 Cecil Sandy October 20 6-28
Loam Coastal Plain Area
Lenoir County 300 lbs. 10-10-20 230 lbs. 33.5% N Norfolk Loamy November 2 6-14 Sand
"""J Duplin County 500 lbs. 5-10-30 190 1bs. 33. 5% N Marlboro Fine October 19 6-13
100 1bs. 30% Nit. Sandy Loam
Solution 186 1bs. K 20 57 1bs. P205
Table 5. Soil test results from test sites, 1982-83.
OM % W-V CEC BS % Ac pH P-I K-I Ca % Mg % Mn-I Zn-I Cu-I
PIEDMONT AREA
Chatham 0.2
Rowan 0.1
COASTAL PLAIN AREA
9
Agencies Sponsoring Entries Coker's Pedigreed Seed Company
Illionis Agricultural Experiment Station Maryland Agricultural Experiment Station Missouri Agricultural Experiment Station Northrup King Company
North American Plant Breeders
North Carolina Agric. Experiment Station Pioneer Hi-Bred International, Inc. Rohm and Haas Company
South Carolina Agric. Experiment Station Virginia Agricultural Experiment Station
Cooperators Piedmont
Entries Coker Scotty
Potomac, Severn, MD Pike
McNair 1003
Hunter, Southern Belle
Anson, Boone, Clayton, Milton Brooks, Madison, Roy, NC Pioneer brand 2550 HW
Keowee, Redhill
Sussex, Massey, Tyler, VA Wheeler
Chatham County: Edd Johnson, Route 3, Pittsboro, North Carolina County Extension Chairman, Carl Outz.
Rowan County: Billy Ayscue, Superintendent, Piedmont Research Station, Salisbury, North Carolina
Agricultural Extension Agent, Steven Gatton. Coastal Plain
Lenoir County: Sandy Barnes, Superintendent, Lower Coastal Plain Tobacco Research Station, Kinston, North Carolina
Agricultural Extension Agent, Johnnie Jones.
Duplin County: Jack Williams, Route 2, Faison, North Carolina Agricultural Extension Agent, J. Michael Moore.
Washington County: John Smith, Superintendent, Tidewater Research Station, Plymouth, North Carolina
10
SEASONAL CONDITIONS
The 1982-83 small grain growing season was characterized by above normal rainfall and above normal temperatures in the winter and below normal temperatures during the spring. Rainfall at three locations is shown below:
Monthly Rainfall Totals (Inches) No- De- Jan-
Feb-Location October vember cember- - - - uary ruary March April ~ Lenoir County 3.30 3.56 3.50 3.93 6.05 7.26 4.40 2.22 Rowan County 4.41 2.54 4.75 2.31 2.74 4.61 6.32 3.16 Washington County 2.90 4.66 4.36 3.27 7.63 9.31 4.81 2.98 The above normal rainfall during the fall of 1982 delayed planting of small grains at several locations and prevented planting of small grains at certain locations althogether. Late spring freezes severely damaged the early maturing barley varieties and the early maturing wheat varieties. Cool, wet weather in the spring set the stage for powdery mildew which was evident at all locations. Scald, barley yellow dwarf virus, and leaf rust appeared later in the season at numerous locations, particularly in the Coastal Plain. Leaf rust and powdery mildew ratings were taken in the Coastal Plain. Cereal leaf beetle was evident at the Rowan location although extent of damage was not assessed.
11
RESULTS AND DISCUSSION Barley
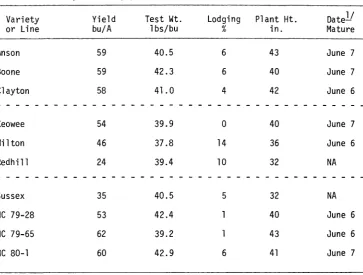
Barley performance is summarized across the state in Table 6. Two experimentals, NC 79-65 and NC 80-1, were the top yielders. Test weights appeared somewhat low which may have been a consequence of the cool, wet spring experienced across the state. Redhill and Sussex suffered from the late spring freezes as evidenced by their yields; insufficient grain in the heads prevented observations of reliable maturity data.
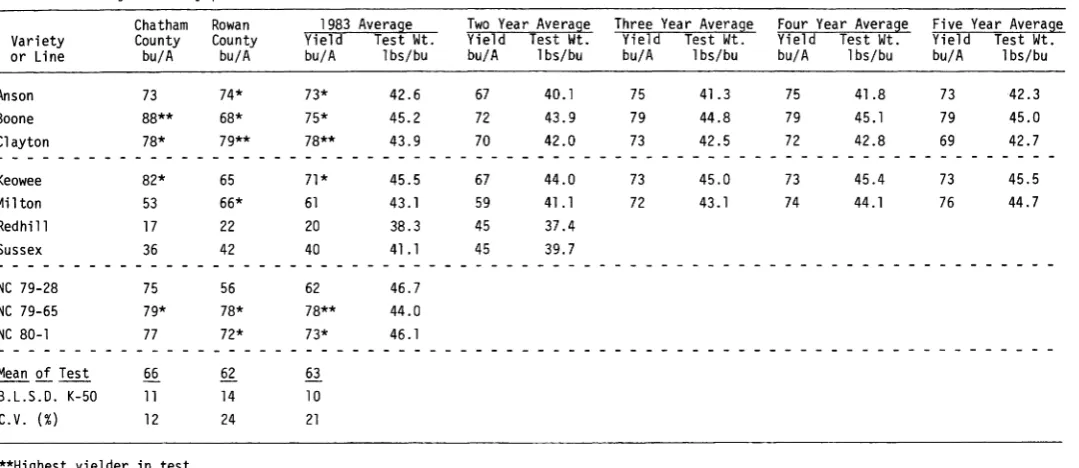
Clayton and NC 79-65 were the high yielders in the Piedmont; both averaging 78 bushels per acre (Table 7). Test weights were fair for most entries and poor for those that suffered from the cool spring weather. Yields in the Coastal Plain were good at Duplin County, fair at Lenoir
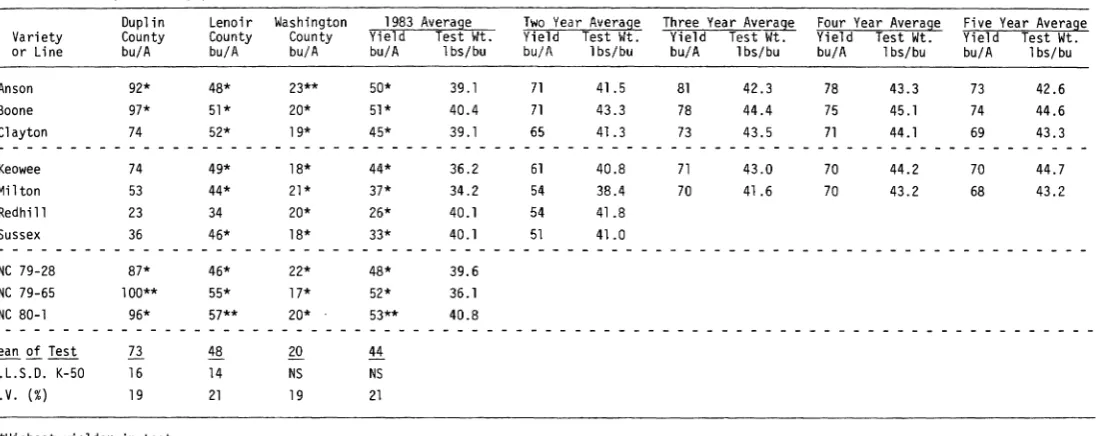
County, and poor at Washington County (Table 8). Heavy rains leached nitrogen from the test at Washington County. Boone and Anson appear to be the
multi-year yield leaders in the Coastal Plain while a highly significant location x variety interaction prevented anyone variety from significantly outyielding all others across locations in 1983.
Oats
12
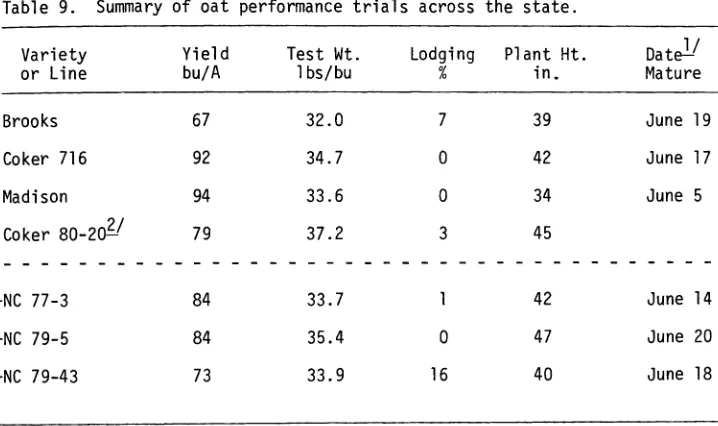
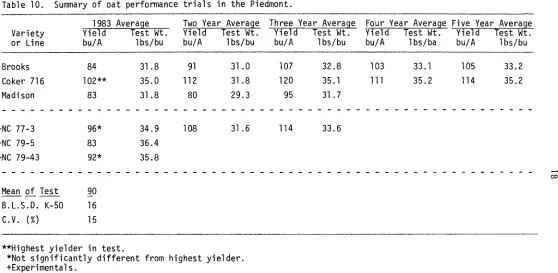
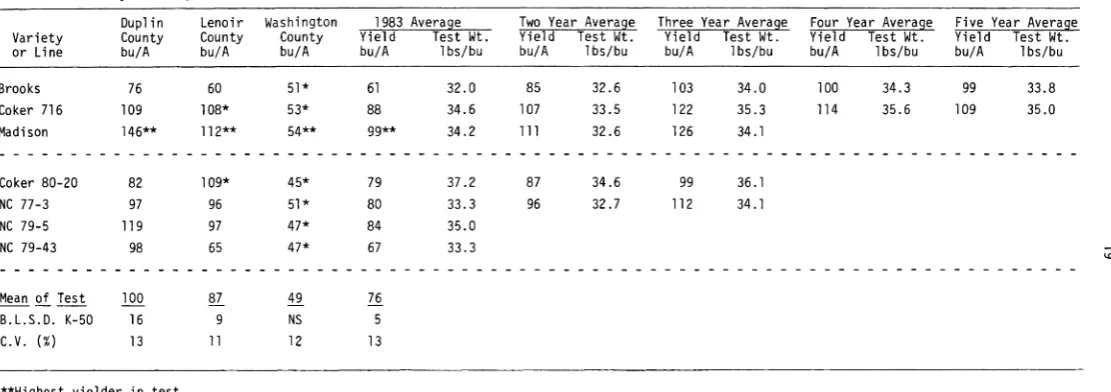
leader in yield for the past five years consecutively. In the Coastal Plain, Madison significantly outyielded all other varieties when averaged across locations and was the highest yielder at each location (Table 11). This particular variety is also the two and three year yield leader in the Coastal Plain.
Wheat
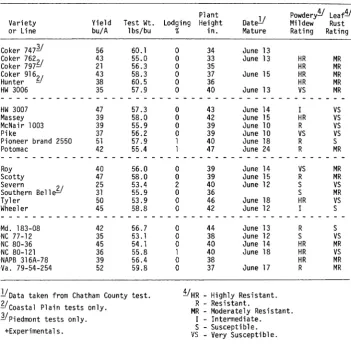
Wheat yields averaged across the state ranged from 52 bushels per acre for the experimental Va. 79-54-254 to a low of 25 bushels per acre for Severn which was severely damaged by the late spring freezes (Table 12) Test weights were fair to good and lodging was minimal. Potomac appeared to mature one to two weeks later than all other entries. No entry was immune or highly resistant to the race(s) of leaf rust which appeared in the Coastal Plain tests, although many were moderately resistant.
13
Wheat and Flour Analyses
14
Table 6. Summary of barley performance across the state.
Variety Yield Test Wt. Lodging Plant Ht. Date
ll
or Line bulA 1bs/bu % in. Mature
Anson 59 40.5 6 43 June 7
Boone 59 42.3 6 40 June 7
Clayton 58 41.0 4 42 June 6
-
--
- -
--
-
-
--
-
-
-
-
-
-
-
-
-
--
- -
- -
-Keowee 54 39.9 0 40 June 7
Milton 46 37.8 14 36 June 6
Redhill 24 39.4 10 32 NA
- -
-
-
-- -
-- -
- --
--
-
-
-
- -
-Sussex 35 40.5 5 32 NA
+NC 79-28 53 42.4 40 June 6
+NC 79-65 62 39.2 43 June 6
+NC 80-1 60 42.9 6 41 June 7
lI
Dat a taken from Chatham County test. +Experimenta1.Table 7. Summary of barley performance trials in the Piedmont.
Chatham Rowan 1983 Average Two Year Average Three Year Average Four Year Average Five Year Average Variety County County Yield Test Wt. Yield Test \~t. Yield Test Wt. Yield Test Wt. Yield Test Wt. or Line bu/A bu/A bu/A 1bs/bu bu/A 1bs/bu bu/A 1bs/bu bu/A 1bs/bu bu/A 1bs/bu
Anson 73 74* 73* 42.6 67 40.1 75 41.3 75 41.8 73 42.3
Boone 88** 68* 75* 45.2 72 43.9 79 44.8 79 45.1 79 45.0
Clayton 78* 79** 78** 43.9 70 42.0 73 42.5 72 42.8 69 42.7
- - -
-Keowee 82* 65 71* 45.5 67 44.0 73 45.0 73 45.4 73 45.5
Milton 53 66* 61 43.1 59 41.1 72 43.1 74 44.1 76 44.7
Redhi 11 17 22 20 38.3 45 37.4
Sussex 36 42 40 41.1 45 39.7
- - -
-
- - - ~*NC 79-28 75 56 62 46.7
*NC 79-65 79* 78* 78** 44.0
*NC 80-1 77 72* 73* 46.1
- - -
-Mean of Test 66 62 63
B.L.S.D. K-50 11 14 10
C.V. (%) 12 24 21
**Highest yielder in test.
Table 8. Summary of barley performance trials in the Coastal Plain. Variety or Line Dupl in County bu/A Lenoir County bu/A Washington County bu/A 1983 Average YieTa Test Wt. bu/A 1bs/bu
Two Year Average Yield Test Wt. bu/ A 1bs/bu
Three Year Average Yield Test Wt. bu/A 1bs/bu
Four Year Average Yield Test Wt. bu/A 1bs/bu
Five Year Average Yield Test Wt.
bu/ A 1bs/bu
Anson 92* 48* 23** 50* 39.1
Boone 97* 51* 20* 51* 40.4
Clayton 74 52* 19* 45* 39.1
-Keowee 74 49* 18* 44* 36.2
Mil ton 53 44* 21* 37* 34.2
Redhil1 23 34 20* 26* 40.1
Sussex 36 46* 18* 33* 40.1
- - -
-*NC 79-28 87* 46* 22* 48* 39.6
*NC 79-65 100** 55* 17* 52* 36.1
*NC 80-1 96* 57** 20* 53** 40.8
- - -
-Mean of Test 73 48 20 44
B.L.S.D. K-50 16 14 NS NS
C.V. (%) 19 21 19 21
**Highest yielder in test.
*Not significantly different from highest yielder. +Experimentals.
71 41.5 81 42.3 78 43.3 73 42.6
71 43.3 78 44.4 75 45.1 74 44.6
65 41.3 73 43.5 71 44.1 69 43.3
-61 40.8 71 43.0 70 44.2 70 44.7
54 38.4 70 41 .6 70 43.2 68 43.2
54 41 .8
51 41 .0 ...
17
Table 9. Summary of oat performance trials across the state.
Variety Yield Test Wt. Lodging Plant Ht. Datell
or Line bu/A 1bs/bu % in. Mature
Brooks 67 32.0 7 39 June 19
Coker 716 92 34.7 0 42 June 17
Madison 94 33.6 0 34 June 5
Coker 80-2oY 79 37.2 3 45
- - -
-
-
--
-
- - --
-+NC 77-3 84 33.7 42 June 14
+NC 79-5 84 35.4 0 47 June 20
+NC 79-43 73 33.9 16 40 June 18
lI
Dat a taken from Chatham County test.Table 10. Summary of oat performance trials in the Piedmont. Variety
or line
1983 Average Yie1a Test Wt. bu/A 1bs/bu
Two Year Average Three Year Average Yield Test Wt. Yield Test Wt. bu/A 1bs/bu bu/A 1bs/bu
Four Year Average Five Year Average Yield Test Wt. Yield Test Wt. bu/A 1bs/ba bu/A 1bs/bu
+NC 77-3 96*
+NC 79-5 83
+NC 79-43 92*
- -
- --Mean of Test 90
-B.l.S.D. K-50 16
C.V. (%) 15
34.9 108 36.4 35.8 Brooks Coker 716 Madison 84 102** 83 31 .8 35.0 31.8 91 112 80
31 .0 107 32.8 103 33.1 105 33.2
31 .8 120 35.1 111 35.2 114 35.2
29.3 95 31.7
-
- - -
--
--
- -
- - - --
--
- - -
- --
-
-- -
--
- -
--31 .6 114 33.6
co
**Highest yielder in test.
Table 11. Summary of oat performance trials in the Coastal Plain. Variety or Line Dup1 in County bu/A Lenoir County bu/A Washington County bu/A 1983 Average Yield Test Wt. bu/A 1bs/bu
Two Year Average Yield Test Wt. bu/A 1bs/bu
Three Year Average Yield Test Wt. bu/A 1bs/bu
Four Year Average Yie1 d Test Wt. bu/A 1bs/bu
Five Year Average Yield Test Wt. bu/A 1bs/bu
Brooks 76 60 51* 61
Coker 716 109 108* 53* 88 Madi son 146** 112** 54** 99**
- - - -
-Coker 80-20 82 109* 45* 79
+NC 77-3 97 96 51* 80
+NC 79-5 119 97 47* 84
+NC 79-43 98 65 47* 67
--
-Mean of Test lQQ 87 49 76
B.L.S.D. K-50 16 9 NS 5
C.V. (%) 13 11 12 13
-**Highest yielder in test
*Not significantly different from highest yielder. +Experimental s.
32.0 85 32.6 103 34.0 100 34.3 99 33.8
34.6 107 33.5 122 35.3 114 35.6 109 35.0 34.2 111 32.6 126 34.1
- - - -- - -
-37.2 87 34.6 99 36.1
33.3 96 32.7 112 34.1 35.0
20
Table 12. Summary of wheat performance trials across the state.
Plant
Date!! Powdery~ Leaf~
Variety Yield Test Wt. Lodging Height Mildew Rust
or Line bu/A 1bs/bu % in. Mature Rating Rating
Coker 747
11
56 60.1 0 34 June 13Coker 7622/ 43 55.0 0 33 June 13 HR MR
Coker 797- 21 56.3 0 35 HR MR
Coker 9162/ 43 58.3 0 37 June 15 HR MR
Hunter - 38 60.5 0 36 HR MR
HW 3006 35 57.9 0 40 June 13 VS MR
- - - - - - - -
- -
- - --
--
--
--HW 3007 47 57.3 0 43 June 14 I VS
Massey 39 58.0 0 42 June 15 HR VS
McNair 1003 39 55.9 0 39 June 10 R VS
Pike 37 56.2 0 39 June 10 VS VS
Pioneer brand 2550 51 57.9 1 40 June 18 R S
Potomac 42 55.4 1 47 June 24 R MR
- - - - - - -
-
- - - - --
-- -
- - - - --
--
--Roy 40 56.0 0 39 June 14 VS MR
Scotty 47 58.0 0 39 June 15 R MR
Severn
BelleY 25 53.4 2 40 June 12 S VS
Southern 31 55.9 0 36 S MR
Tyler 50 53.9 0 46 June 18 HR VS
Wheeler 45 58.8 0 42 June 12 I S
- -
--
-- - - -
- --
- - --+Md. 183-08 42 56.7 0 44 June 13 R S
+NC 77-12 35 53.1 0 38 June 12 S VS
+NC 80-36 45 54.1 0 40 June 14 HR MR
+NC 80-121 36 55.8 1 40 June 18 HR VS
+NAPB 316A-78 39 56.4 0 38 HR MR
+Va. 79-54-254 52 59.8 0 37 June 17 R MR
lIDat a taken from Chatham County test. 1/HR - Highly Resistant.
~Coastal Plain tests only. MR - Moderately Resistant.R - Resistant. }IPiedmont tests only. I - Intermediate.
Table 13. Summary of wheat performance trials in the Piedmont.
Chatham Rowan 1983 Average Two YearAver~ Three Year Average Four Year Average Five Year Average Variety County County Yield Test Wt. Yield Test Wt. Yield Test Wt. Yield Test Wt. Yield Test Wt.
or Line bu/A bu/A bu/A 1bs/bu bu/A 1bs/bu bu/A 1bs/bu bu/A 1bs/bu bu/A 1bs/bu
Coker 747 54 57 56 60.1 48 55.0 54 56.7 52 57.8 54 57.7
Coker 762 36 60* 52 55.0 42 52.5 51 55.0 50 56.5 51 56.7
Coker 916 37 43 41 57.7 44 53.3 53 55.5
HW 3006 40 47 45 57.4 37 52.1
~W_3QOZ _______6~ ____ 61*____ §2_____ 5Z.Q _
Massey 31 43 39 59.0 44 53.6
McNair 1003 44 44 44 56.1 48 52.0 58 54.3 55 55.3 57 55.5
Pike 47 53 51 57.5
Pioneer brand 2550 62 62* 62 57.9 54 54.7
~oEo~a~ ______ _
4Z ____
5~ ____ ?1 _____5~.? ________________________________Roy 59 56 57 57.1 47 50.8 55 53.5 54 54.6 54 54.8
Scotty 60 58 58 57.7
Severn 27 35 32 49.4 ~
Tyler 74** 64** 67** 51 .5 57 51 .0 64 53.9 61 55.2 61 54.6
~h~eler _______ 5§ ___ _
5Z ____
§6____ _5Z.~___
~5____5~.g ___ ~8____5§.~ ___ ~5___ _5Z.~___________
+t4d. 183-08 56 55 56 57.7
+NC 77-12 35 48 44 53.6 45 48.8
+NC 80-36 52 54 54 54.3
+NC 80-121 47 54 52 56.7
ya:
Z9:51-g51 ____
5~ ____5~ ____ §8_____ 6Q.Q _________________________________________Mean of Test 49 53 52
B.L.S-:O. K-50
a-
S 4C.V. (%) 13 11 12
**Highest yielder in test.
Table 14. Summary of wheat performance trials in the Coastal Plain.
Duplin Lenoir Washington 1983 Average Two Year Average Three Year Average Four Year Average Five Year Average Variety County County County Yield Test Wt. Yield Test Wt. Yield Test Wt. Yield Test Wt. Yield Test Wt. or Line bu/A bu/A bu/A bu/A 1bs/bu bu/A 1bs/bu bu/A 1bs/bu bu/A 1bs/bu bu/A 1bs/bu
Coker 762 47 50 22** 39 55.0 42 54.3 50 55.7 51 56.0 50 55.4
Coker 797 17 26 18* 21 56.3 32 54.9 43 57.0
Coker 916 57 59** 21* 44 58.6 53 57.3 59 58.5
Hunter 46 52 20* 38 60.5 43 58.2
HW 3006 35 33 21* 29 58.3 29 55.2
~W_3QOZ _____ ~5_____4~ ____ ~O~ ____3~ ____ ~6:8___________
Massey 45 52 21* 39 57.4 47 55.9
McNair 1003 40 50 20* 36 55.7 45 55.1 56 57.0 54 57.4 54 56.9
Pike 35 42 19* 29 55.4
Pioneer brand 2550 69* 56* 19* 46* 57.8 49 56.9
~o!o~a~ _____ §3_____ 4§ ____ 17_____ 3Z ____ §6~6________________________________________
Roy 42 35 17 30 55.2 35 52.0 48 54.8 47 55.2 47 54.8 NN
Scotty 53 52 19* 40 58.2
Severn 20 29 13 21 56.0
Southern Belle 35 42 16 31 55.9 34 53.6 44 56.3 45 57.7
Tyler 55 51 19* 40 55.4 46 56.6 53 58.3 52 58.5 52 58.1
~h~e1e~ _____ ~8_____ 41 ____ 19~ ____3~ ____ ~9~4____4§ ___ §6~1____ 51 _ _5Z.§ _____5~ 58.3
+Md. 183-08 37 48 17 34 56.0
+NC 77-12 27 45 17 30 52.8 41 51.9
+NC 80-36 59 50 20* 41 54.0
+NC 80-21 28 37 14 26 55.2
+NAPB 316A-78 66 47 13 39 56.4
+V~._7~-~4:2~4___7~*~ ___ §9~*____2g*~ ___ 18~*___ _5~.Z _________________________________________
Hean of Test 46 45 18 35
B.L.S"J). K-50 6" i f 5 3
c.v. (%) 13 10 23 14
**Highest yielder in test.
Table 15. Comparison of wheat entries for wheat and flour qualities (1983 data).
Wheat Analysis Flour Analysis
Variety % % Test 1000 Hheat-1/ %
or Line Moisture Protein Weight Kernel Wt. Appearance Extraction Ash Protein
Coker 762 12.7 12.4 57.8 34.8 G .666 .410 9.6
Coker 797 12. 1 12.6 NA 29.2 VP
Coker 916 13.0 9.3 58.2 36.4 G .606 .404 8.1
HW 3006 12.7 10. 1 58.9 33.6 F
HW 3007 13. 1 12.5 59.2 36.8 VG .650 .422 8.6
Hunter
-
- - - - --
- - - - - -12.8- - -
-11 . 7- - - -
- -60. 1- -- - -
35.6- - - --
- -VG-
- - - --
- - - - - --
- --Massey 12.8 10.5 59.3 36.4 G .656 .428 8.9
McNair 1003 12.6 9.8 55.0 34.8 P .546 .384 8.0
Pike 12.7 9.0 56.4 30.0 F
Pioneer brand 2550 12.7 9.3 60.1 36.4 VG .642 .414 8.1
Potomac 13.0 9.7 60.7 36.4 VG .610 .390 8.4
~ot
________
!2:5 _____ 9:1 ____ ~5:9____ ~1:2_____ F_____ :6!6 ____ :324____Z.2 _
N
Scotty 13. 1 10.0 60.0 34.0 VG .732 .422 8.6 w
Severn 12.7 10.3 NA 32.8 F
Southern Belle 12.5 12. 1 NA 34.8 VG
Tyler 13.5 9.3 58.9 32.8 F .556 .358 8.1
~h~e!e~ ______ !2:8 _____ 9:3 ____ ~9:6____ ~8:0_____ V§ ____ :6~0____ :3~0____ ~.Q
_
+t4D 183-08 13.0 10.7 NA 34.4 F .598 .412 9.1
+NAPB 316A-78 12.4 10.0 60.0 32.0 G
+NC 77-12 12.3 11 .0 NA 30.0 F
+NC 80-36 12.6 9.6 54.3 30.8 P .736 .404 8.2
+NC 80-121 12.5 9.8 NA 28.0 VP
+VA 79-54-254 13.3 8.6 60.1 34.4 G
!/Wheat Appearance: G