UNC - WRRI-2003-347
LUMPED PARAMETER MODELS FOR PREDICTING NITROGEN LOADING FROM LOWER COASTAL PLAIN WATERSHEDS
D.M. ~ m a t y a ' , G.M. chescheir2, G.P. ~ e r n a n d e z ~ , R.W. skaggs2, F. 13irgand2, and J.W. ~ i l l i a m ~
'USDA Forest Service
Center for Forested Wetlands Research 2730 Savannah Highway
Charleston, SC 294 14
(Formerly with North Carolina State University)
' ~ e ~ a r t m e n t of Biological and Agricultural Engineering
North Carolina State University Raleigh, NC 27695
and
' ~ e ~ a r t m e n t of Soil Science
North Carolina State University Raleigh, NC 27695
The research on which the report is based was supported by funds from The N.C. Water Resources Research Institute, the United States Department of Agriculture NCREESNRICGP Grant No. 98-3 5 102-6493 and the United States Environmental Protection Agency 3 19 Grant No. EW-7029.
Contents of the publication do not necessarily reflect the views and policies of the North Carolina Water Resources Research Institute, the USDA NCREES, nor the USEPA, nor
does mention of trade names or commercial products constitute their endorsement by the
Institute, State of North Carolina, or the United States Government.
WRRI Project No. 70162
Agreement No. USGS Project No.
This research was conducted in the Department of Biological and Agricultural
Engineering at North Carolina State University. The research was supported by funds from the Water Resources Research Institute of The Univcrsity of North Carolina Project
No. 701 62), the USDA NCREES/NRICGP (Project No. 98-35 102-6493), and the US
EPA 3 19 program (Project No. EW7029).
In
recent years physically based comprehensive distributed watershed scalehydrologichater quality models have been developed and applied to evaluate cumulative effects of land and water management practices on receiving waters. Although these complex physically based models are capable of simulating the impacts of these changes in large watersheds, they are oAen prohibitive for regular applications because of excessive input data requirements and because of uncertainties in both the model processes and input data. This task is beyond practical reality for policy makers and managers who need to make decisions about multiple watersheds with limited time and resources. Nevertheless, important decisions need to be made with regard to nutrient and water management practices at the field and watershed scales. Models are needed to make decisions that reflect our current understanding of the system yet require input parameters that can be readily determined with a minimum of uncertainty.
In
this project, lumped parameter watershed scale water quality models of various levels of complexities for predicting nitrogen loading from lower coastal plain watersheds have been developed and tested. These watershed scale lumped parameter models, developed and tested herein, are based upon DRAINMOD, a field scale hydrologic watermanagement model for poorly drained high water table conditions that has been
successfully tested for varylng geographical and climatological conditions. The watershed scale models have in-stream hydraulic and quality transport submodels linked to
DRAINMOD. Models were simplified and a lumped parameter approach used to describe in-stream water quality processes. The models were tested with both water quantity and quality (concentrations and loadings) of nitrogen collected over a three-year (1 996- 1999) period on several subwatersheds across an intensively monitored 10,000 ha lower coastal plain watershed near Plymouth, North Carolina. Model testing involved only minimal calibration that used data available in the literature as input to the model. Given the complexity of the model and limited data, predictions of daily and annual outflows at the outlets of all the subwatersheds ranged from acceptable to excellent. The model
performed better for a uniform managed forest than for an agricultural watershed, which was more heterogeneous with respect to soils, crops, and water management practices. The degree of accuracy of predictions of seasonal and annual loads of nitrogen varied widely depending upon the season and the level of complexity chosen in lumping the transport processes.
A spreadsheet-based export coefficient model, which used average annual velocity for estimating travel time in the delivery ratio, was as good as using a day-by-day velocity simulated by the complex watershed scale hydraulics model. A GIs-based lumped parameter model was developed based on an export coefficient-delivery ratio (DR) concept, with the DR dependent on time of travel from field to the watershed outlet. The
G I s model can be used to quantify the seasonal and annual nitrogen loads at the
TABLE OF CONTE3TS
Page
. . .
ACKNOWLEDGMENTS iii
. . .
ABSTRACT v
. . .
TABLE OF CONTENTS vii
. . .
LIST OFFIGURES xi
. . .
LIST OF TABLES xvii
. . .
SUMMARY AND CONCLUSIONS xix
. . .
RECOMMENDATIONS xxiii
LUMPED PARAMETER WATER QUALITY MODELING OF COASTAL
. . .
WATERSHEDS 1
. . .
BACKGROUND 1
. . .
HYPOTHESIS . . . 3
. . .
OBJECTIVES 4
DATA COLLECTION AND ANALYSIS . . . . . 5
METHODS . . .
. . . Site description . . . Meteorology . . . Rainfall . . .
Other weather parameters
Hydrology . . .
. . .
Field scale monitoring
. . .
Canal and stream monitoring
. . .
Water quality
. . .
Nutrient and sediment concentrations
. . .
Nutrient and sediment loadings 9
. . .
Physical characteristics 9
. . .
Ln-stream process measurements 9
. . .
DATA ANALYSIS 17
. . .
Meteorology 17
. . .
Rainfall 17
. . .
Other weather parameters 17
Hydrology . . . 27
Flow rates at in-stream stations (subwatershed outlets) . . . 27
Water Quality . . . 33
. . . Nitrogen concentrations at soil-water interface 33 . . . Nitrogen coilcentrations at subwatershed outlets 33 SUMMARY . . . 37
. . . HYDROLOGIC AND HYDRAULIC MODELING 39 . . . INTRODUCTION . . 39
. . . MODEL DESCRIPTION 39 . . . FLD&STRM/DRAINWAT model 39 DRAINMOD-DUFLOW model . . . 41
MODEL EVALUATION CRITERIA . . . 41
. . . TESTING OF THE MODELS 44 . . . Subwatershed S4 44 Subwatershed T4 . . . 48
Subwatershed C5 . . . 52
. . . Subwatershed C2 54 WatershedC7 . . . 58
SUMMARY AND CONCLUSIONS . . . 61
WATER QUALITY MODELING . . . 63
INTRODUCTION . . . 63
LEVELS O F COMPLEXITIES IN WATER QUALITY MODELING . . 63
Field scale water quality model . . . 64
. . . In-stream process transformation model 65 . . . LUMPEDPARAMETERMODELINGAPPROACHES 66 Exponential decay equation for nutrient transportltransformation . . , 67
. . . DRAINMOD-DUFLOW with first order kinetics 71 . . . DRAINMOD-DUFLOW based alternative method 74 . . . DRAINMOD-GIs based model 75 DRAINWAT based methods . . . 78
. . . DRAINMOD based and other methods 83 Spreadsheet based methods . . . 88
. . . APPLICATION OF THE MODELS 92 . . . SUMMARY AND CONCLUSIONS 95 . . . STATISTICAL AND UNCERTAINTY ANALYSES 97 . . . INTRODUCTION 97 STATISTICAL ANALYSES . . . 98
Derivation of distribution . . . 98
Daily flow rates . . . 98
. . .
Travel times . . . 98
. . .
Concentrations of nitrogen components 98
. . .
Sensitivity tests 100
. . .
Hydrologicihydraulic parameters 100
. . .
Water quality parameters 101
. . .
Uncertainty analysis using Monte Carlo simulations 102
. . .
SUMMARY 103
. . .
LIST OF REFERENCES 105
. . .
LIST OF FIGURES
Page
Figure 1. Location of watershed study site near Plymouth in lower . . . ‘L 3
coastal plain of North Carolina.
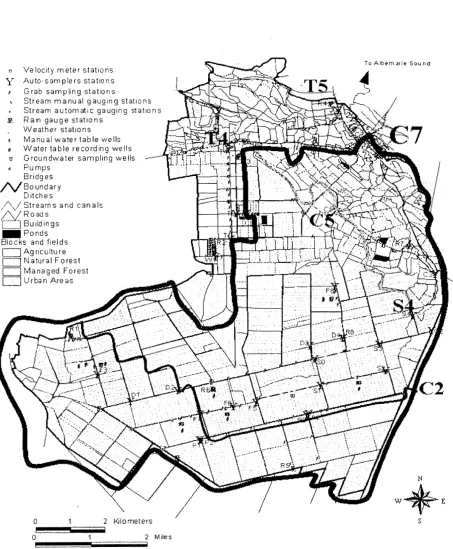
Figure 2. Diagram of 10,000 ha study watershed near Plymouth, NC. . . 6 General distribution of land uses, canals and streams is shown
with sampling stations and rain gauges. The areas of subwatersheds S4, T4, C2, C 5 , and C7 are highlighted.
Figure 3. Experimental layout of an agricultural canal and field ditches for . . 10 monitoring in-stream processes.
Figure 4. Measured water elevations and nitrogen concentrations for A l . . . . 11 station in June 1998.
Figure 5 . Measured water elevations and nitrogen concentrations at PI . . . . . 12 station in June 1998.
Figure 6. Measured cumulative nitrate (NO3) load at inlet A1 and outlet .
.
. . .13 P1 of the agricultural canal in June 1998.Figure 7. Measured temperatures at different depths of water and sediment- . . .14 water surface at P 1 station in June 1998. . . .
Figure 8. Measured concentrations of NH4-N and NO3-N in the sediment- . . . . 1 5
pore water of the agricultural canal in November 1998.
Figure 9. Measured concentrations of NH4-N and N 0 3 - N in the sediment- . . . .16 pore water of the agricultural canal in January 1999.
Figure 10. Measured daily cumulative rainfall from four gauges for 1996 . . . . 18 (top) and 1997 (bottom).
Figure 1 1. Measured daily cumulative rainfall f ~ o m four gauges for 1998 . . . .19 (top) and 1999 (bottom).
Figure 12. Measured annual rainfall from all seven gauges for four years. . . . . 20 Incomplete or unavailable data in 1996, 1997 and 1998 not
Figure 13. Daily potential evapotranspiration (PET) rates estimated by . . . . 2 1
Penman-Monteit11 method for 4 years for pine forest at Parker Tract, NC.
Figure 14. Daily potential evapotranspiration (PET) rates estimated by . . . . 22 Penman-Monteith method for 4 years for standard grass at TRS
site, NC.
Figure 15. Measured monthly outflows for a 4-year period from 2950 ha . . .
forested subwatershed S4 (top), 7 10 ha agricultural subwatershed T4 (middle), and 8 140 ha mixed land use watershed C7 (bottom)
near Plymouth, NC. Some data not shown in 1996 are not available.
Figure 16. Measured annual outflows for a three-year period (1997-99) fiom three subwatersheds (S4 - managed pine forest, T4 - primarily agricultural and C7 - forest mixed with agncultural lands) in the study watershed near Plymouth, NC.
Figure 17. Schematic diagram of DRAINMOD-DUFLOW based watershed . .
scale model.
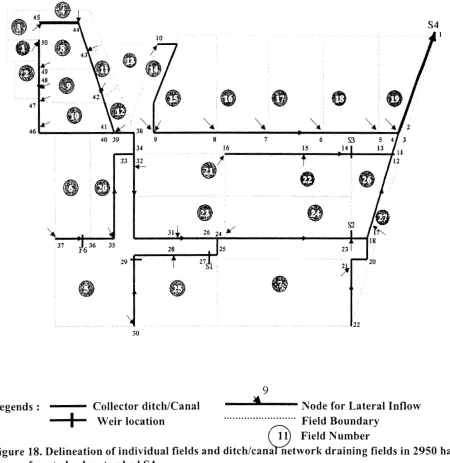
Figure 18. Delineation of individual fields and ditchlcanal network draining .
fields in 2950 ha forested subwatershed S4.
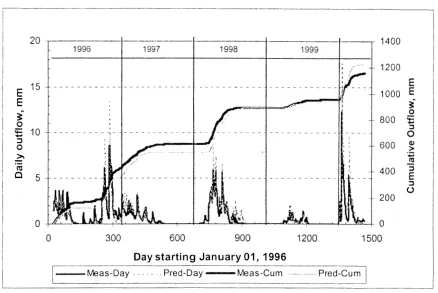
Figure 19. Measured and predicted daily and cumulative outflows fiom forested. .48 subwatershed S4 for the period March 1996 to December 1999.
Figure 20. Delineation of individual fields and ditchlcanal network draining
.
. . 50 fields in 7 10 ha agricultural subwatershed T4.Figure 21. Measured and predicted daily and cumulative outflows from . . . . 5 1 subwatershed T4 for the period of July 1996 to December 1999.
Figure 22. Measured and predicted monthly outflows from subwatershed . . . . 5 1
T4 for the period of July 1996 to December 1999.
Figure 23. Delineation of individual fields and ditchkana1 network draining . . .53 the fields in 1325 ha subwatershed C5 with mixed land use.
Figure 24. Measured and predicted daily stage heights at the outlet of . . . 5 5 subwatershed C5 for the period of July 1996 to December 1997.
Figure 25. Delineation of individual fields and ditchlcanal network draining . . . 57 fields in 2640 ha subwatershed C2 with mixed land use.
Figure 26. Measured and predicted daily outflows at in-stream location P1 . . . 5 8 within subwatershed C 2 for the year 19%.
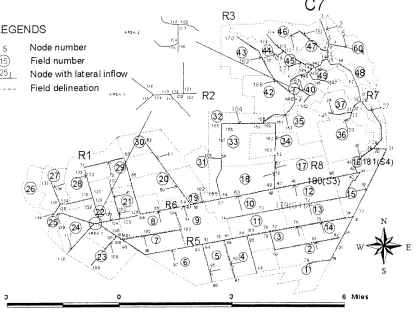
Figure 27. Delinehtion of individual fields and ditchkana1 network draining the . 59 fields in 8 140 ha watershed C7 with mixed land use. Thick solid lines
represent the main ditchkana1 and streams.
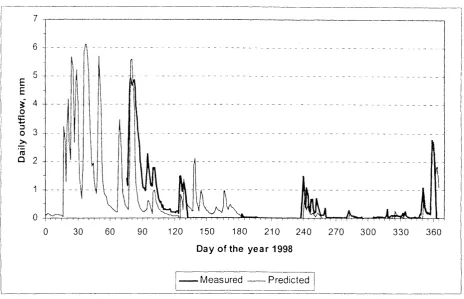
Figure 28. Measured and predicted daily and cumulative outflows from . . . .60 watershed
~7
for the period of January 1998 to November 1999.Figure 29. Schematic of range of alternatives for watershed scale water . . . .64 quality modeling. Highlighted lines indicate the approaches used
for lumped parameter water quality modeling in this study.
Figure 30. Measured and DRAINMOD-DUFLOW predicted daily and . . . .72 cumulative outflows from subwatershed S4 for the period of
February 1996 to December 1997.
Figure 3 1. Predicted cumulative nitrate loads for a three-year (1 996-98) period . . 72 at the outlet of subwatershed S4 for varying decay rate parameter (k).
Figure 32. Effect of mineralization rate constant (Kmin) on predicted . . . . . 73 loading of organic nitrogen (N-org) and nitrate nitrogen (NO3)
for S4 subwatershed during February-April 1996.
Figure 33. Effect of decay rate constant (k) and dispersion coefficient (d) . . .
74
on predicted loading of nitrate-nitrogen for S4 subwatershedduring February-April 1996.
Figure 34. Time of travel of waterlnutnent calculated using cumulative . . . . 75
nitrogen load for an event of 1996 at subwatershed S4.
Figure 35. GIs-based watershed scale lumped parameter water quality . . . . .77 model interface. Graphical display of spatial outputs of average
travel time, total N and delivery ratios for a sample month of model simulation for 2950 ha forested subwatershed S4.
Figure 36. Measured (MSR) and predicted (PRED) cumulative nitrate . . . . .78 (NO3-N) and nitrogen (N) loads at the outlet of subwatershed S4
for a two-year period (1 996-97).
Figure 37. Schematic diagram for lumped parameter water quality . . . . .79 modeling using DRAINWAT and water quality submodel
(EXPMODEL).
Figure 38. Diagram of the travel path of waterinutrient from a field to . . . . .8 1 watershed outlet along the ditcl~kanal network.
Figure 39. Measured (solid dark) and predicted (solid white) annual nitrate . . 82
(top) and total nitrogen (bottom) loadings h-om forested subwatershed S4 for a three-year period (1 996-98).
Figure 40. Average seasonal drainage outflows simulated by DRAINWAT ,
using 8-years of weather data from Plymouth, NC for subwatershed S4.
Figure 41. Relationships of average daily velocities with upstream . . . contributing drainage area for wet (November-April) and dry (May- October) seasons for subwatershed S3.
Figure 42. Relationships of average daily velocities with upstream . . . .
contributing drainage area for the whole year for subwatershed S4. Upper and lower lines are for 95 % confidence bands.
Figure 43. Drainage area versus predicted daily velocity for the average, ,
991h percentile and 5th percentile scenarios for wet season for subwatershed S4.
Figure 44. Drainage area versus predicted daily velocity for the average, . 9gth percentile and 5th percentile scenarios for dry season for subwatershed S4.
Figure 45. Frequency duration of wet season daily average velocity at three . . 87 locations (Downstream, Middle and Upstream) in the main canal
of subwatershed S4.
Figure 46. Frequency duration of dry season daily average velocity at three . locations (Downstream, Middle and Upstream) in the main canal subwatershed S4.
Figure 47. Schematic diagram for lumped parameter water quality modeling Using DRAINMOD or DRAINMOD-N or export coefficient approach with two different velocity calculation methods.
Figure 48. Predicted total nitrogen (N) loadings with (solid dark) and without . (solid white) a delivery ratio at the top and predicted total nitrogen loadings for decay parameter k= 0.01 (solid dark) and k=0.05 (solid white) at the bottom.
Figure 49. Measured and predicted cumulative outflows using DRAINMOD- . . 91 DUFLOW for a two-year period (1 996-97) for existing forest
condition (FOREST) and a scenario with 50% agriculture and 50% forest (AGRSO%) in subwatershed S4.
Figure 50. Cumulative nitrate load predicted by DRAJNMOD-DUFLOW . . 94
for a two-year period (1996-97) for existing forest condition and a scena~io with 50% agriculture and 50% forest (AGRSO%) in
subwatershed S4.
Figure 5 1. Frequency histogram of NO3-N concentrations measured at the . . 99 outlet of an agricultural subwatershed T4 over a three-year
period (1 996-98).
Figure 52. Frequency histogram of NO3-N concentrations measured at the . . 99 outlet of a forested subwatershed S4 over a three-year period
(1 996-98).
Figure 53. Frequency histogram of NO3-N concentrations measured at the . . 100 outlet of the subwatershed T5 with a mixed land use over a
three-year period (1 996-98).
Figure 54. Absolute sensitivity of inputs and parameters of a spreadsheet . . 101 based lumped parameter water quality model.
Figure 55. Probability distributions of simulated annual total N load . . . . . 102 predicted by the spreadsheet model linked with @RISK tool
LIST OF TABLES
Page
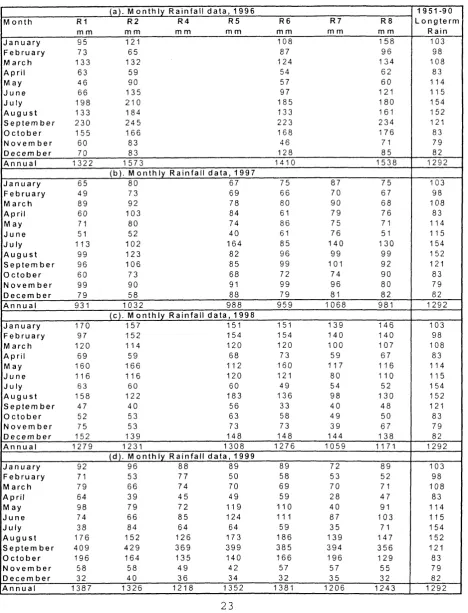
Table 1. Monthly and annual rainfall measured at seven gauges across the . . . study watershed. Blank columns indicate unavailability of data. Long- term rainfall is from National Weather Service Station at Plymouth, NC.
Table 2. Monthly average weather parameters measured above pine forest . . . canopy at Parker Tract,
NC.
Longterm air temperature is from National Weather Service Station at Plymouth,NC.
Table 3. Monthly average weather parameters measured above a grass reference .
at Tidewater Research Station (TRS), Plymouth, NC. Longterm air temperature is from National Weather Service Station at Plymouth, NC.
Table 4. Monthly total Penman-Monteith PET estimated for (a) forested site . . at Parker Tract and (b) agricultural site at Tidewater Research Station (TRS), both near Plymouth, NC.
Table 5. Flow rates for four in-stream stations (C3, C5,
C7
& T5) estimated . .by using stage and velocity measured intermittently during 1 996-98 period.
Table 6. Summary statistics of concentrations of nitrogen components in water . . 34 samples collected at Station T4 from 1996 through 1998.
Table 7. Summary statistics of concentrations of nitrogen components in water . . 34 samples collected at Station T5 from 1996 through 1998.
Table 8. Summary statistics of concentrations of nitrogen components in water . . 35 samples collected at Station S4 from 1996 through 1998.
Table 9. Summary statistics of concentrations of nitrogen components in water . . 35 samples collected at Station C2 from 1996 through 1998.
Table 10. Summary statistics of concentrations of nitrogen components in water . . 36 samples collected at Station C 5 from 1996 through 1998.
Table 1 1. Summary statistics of concentrations of nitrogen components in water . . 36 samples collected at station
C7
from 1996 through 1998.Table 12. Characteristics of lateral and collector ditches and drainage canals in . . 44 forested subwatershed S4.
Table 13. Main soil hydraulic properties of forested subwatershed S4 used . . . 47 as inputs in DRAINMOD.
Table 14. Time of travel (in days) for different events and different fields of . . . 75 forested subwatershed S4 as simulated by DRAmWOD-DUFLOW
model.
Table 15. Spreadsheet-based method for estimating annual total N (TOT-N) . . . 90 load using literature published average N concentrations and
DRAMWAT predicted outflow for computing field loading and an exponential decay method for delivery ratio (D.R.).
Table 16. Spreadsheet-based method for estimating annual NO3-N load . . . . . 91 using measured export coefficient and drainage area for computing
loading at field edge and an exponential decay method for delivery ratio (D.R.).
SUiMhl,ARY AND CONCLUSIONS
This study was conducted on a 10,000 ha watershed near Plymouth in eastern North Carolina to develop lumped parameter water quality models for predicting nitrogen loading from coastal plain watersheds. The watershed was instrumented to measure cumulative effects of land use and management practices on loading of nutrients and sediment from lower coastal plain watersheds. Flow rates and drainage water quality measured at both the field scale and at the watershed scale were used for testing models developed to predict hydrology and nutrient transport. Hydro-meteorologic and water quality data collected over a near four-year (1 996-99) period on the study watershed were summarized. Rainfall data from several rain gauges distributed across the watershed were used as model inputs. Daily weather data measured at two weather stations (one at forest site and another at the agricultural site) were used to estimate daily PET for grass and forest references. These data were also used as model inputs. Soil hydraulic properties for the model were based on literature published data for the soil series identified using SCS soil survey report.
It was hypothesized that the nitrogen loading to downstream receiving waters is mostly dependent on the hydrology (drainage outflows) as a result of storm events of different sizes and patterns. This means that the hydrology and flow routing part should be accurately predicted before testing water quality components of the model. The lumped parameter models developed were based on a field scale hydrologic model, DRAINMOD, that has been successfully tested for predicting water table depths and outflow rates from poorly drained, high water table soils.
Two DRAINMOD based watershed scale distributed hydrologic/hydraulic models, DRAMMOD-DUFLOW and DRAINWAT were tested for their ability to predict drainage flow rates and cumulative flow volumes from subwatersheds ranging in size from 7 10 ha to 8 140 ha, and having multiple land uses. The predictions of daily drainage rates and total outflow using DFUINWAT were in excellent agreement with measured data for the subwatershed S4, which had fairly homogeneous soils and vegetation. The
predictions were somewhat poorer for the agricultural subwatershed T4, which was more heterogeneous with respect to soils, crops, and water management practices. Predicted outflows and stages for two other subwatersheds, C2 and C 5 , were in reasonable
agreement with observed data, but the agreement va~ied among storm events. The model was able to accurately predict both low flow events during dry periods as well as peak drainage rates during the summer tropical events that occurred on a large 8 140 ha
watershed with mixed land use. Some of the errors were attributed to weir submergence during large events caused by the hurricanes and to backwater conditions due to beaver dams. For most of the subwatersheds tested, the model gave reliable predictions of drainage outflows when general published soil property data were used as input. These results
provide a basis for using these general soil property data in the watershed scale models. It was concluded that these hydrologic models can be used to reliably predict outflow rates
and volumes, and therefore, can be linked with water quality models to predict cumulative total nitrogen loading from the poorly drained coastal watersheds.
Models with different levels of complexity and input requirements were evaluated in this study. However, models based on DRAINMOD (DRAINMOD-DUFLOW and
DRAINWAT) were used to develop and test the comprehensive lumped parameter water quality models. Lumped parameter water quality transport and transformation models were derived based on the primary assumption that the rate of change in nitrogen concentration is directly proportional to the concentration (i.e. first order kinetics). This leads to the assumption that concentration in drainage water decays exponentially with time o f travel in the canals and coastal streams. Field experiments were conducted to measure in-stream processes and parametrise the in-stream model. The hydrologic models were linked internally or externally with the exponential decay equations to route the nutrients to the watershed outlet. Other methods based on only DRAINMOD and/or simple rainfall-runoff models, including an export coefficient (average annual loading) approach that does not need field hydrology and concentration, were also identified for estimating nutrient export at the field edge. A constant decay parameter, that lumps all the transformation processes in the canal network, was assumed for all methods. Different methods of estimating travel time needed to compute a delivery ratio using the decay parameter were developed. GIs based and simple spreadsheet based lumped parameter methods were tested for predicting nitrogen loads.
Most of the models considered were tested with data from a 2950 ha experimental forested subwatershed. Both DRAINMOD-DUFLOW and DRAINWAT based models with the exponential decay equation for nutrient transformation predicted annual nitrate loads within reasonable error. The GIs based approach was encouraging as a spatial analysis tool for prediction and assessment of annual N loads from lands with multiple land uses and management practices. Simple, easy to use, spreadsheet based export coefficient models were also analyzed. Results for the forested watershed S4 indicated that there was not much difference in annual loads estimated by using travel time on day- by-day basis using the DRAINMOD based model and the annual average travel time obtained from velocity-area relationships, where average velocity was obtained from long term model simulations. These results indicate that the net effect of in-stream processes on nitrogen loads can be reasonably estimated by these lumped parameter models which assume an exponential decay of concentration with time of travel.
The uncertainty associated with input parameters on the field hydrology, flow routing, and nutrient transformation/transport on nitrogen loading predicted by the lumped parameter models was discussed. An analysis of uncertainty of the results of the field scale model DRAINMOD-N showed that the predicted subsurface drainage was most sensitive to lateral saturated hydraulic conductivity than to eight other inputs. However, the results of the watershed scale model (DRAINMOD-DUFLOW) analysis, applied to the 2950 ha forested S4 subwatershed, showed that uncertainty of inputs for maximum surface storage and lateral hydraulic conductivity have much less impact on the
field edge. The parameters most affecting predicted peak outflow rates and total outflow in watershed scale nod el FLDGrSThlIDRAINWAT were, in order of importance, time of concentration, channel bottom slope, soil hydraulic conductivity, and channel roughness. The simulated outflow was only moderately dependent on channel depth and width, rooting depths or drainable porosity.
A sensitivity analysis using the decay coefficient, average velocity, and the field loading in the lumped parameter models indicated that predicted nitrogen load at the watershed outlet is more sensitive to loading at the field edge (predicted drainage outflows and export concentrations) than to velocity and the decay coefficient. Although model
predictions of N loads were shown to be relatively insensitive to the decay rate parameter, the uncertainty of the decay rate produced the widest confidence limits of all properties and parameters investigated, affecting the overall uncertainty of the model predictions. Analysis of the sensitivity of DRAINMOD-DUFLOW predictions to reaction coefficients showed that denitrification rate was more sensitive than either the mineralization rate or the dispersion coefficients.
The study concluded that a lumped parameter water quality model using a DRAINMOD
1. Case studies should be conducted on the application of the watershed scale models developed in this research. Such studies on 10,000 to 50,000 ha watersheds in the lower coastal plain would allow evaluation of effects of land uses and management practices on nitrogen loads. They would also identify data gaps, effects of model parameter uncertainty on predicted nitrogen loads, and further research needs for application of this technology.
2. Models with different levels of complexity and input requirements were evaluated in this study. A GIs based system for organizing input data and visual display of the outputs of the different models should be developed. Such a modeling system could provide hierarchical methods of selecting the most reliable and appropriate model based on data availability and the objectives of analyses to be conducted.
3. DRAINMOD based hydrologic/hydraulic models should be tested with multiple
years of flow data from multiple sites with different land uses and management practices for their ability to predict drainage flow rates with a minimal field calibration. This will allow evaluation for using both the published soil hydraulic properties as well as the effects of variation due to weather.
4. The models should also continue to be refined to accurately predict not only flow rates at the watershed outlets but other fluxes such as water table depths and flow rates at in-stream locations to verify the internal consistency of the model. This would first provide increased accuracy of predicted nitrogen loading rates at the field scale, in which the fluxes are dependent upon the predicted field water table depths and flow rates at the field edge. Secondly, it would allow to accurately predict the velocity distribution in the canal network used in estimates of travel time component of delivery ratio of nitrogen.
5 . Soil hydraulic properties used in calibration of the models tested herein need to be processed and linked in a GIs data base format such that DRANMOD based GIs
models can be easily used for processing input parameters. This will facilitate use
of G I s models in spatial analysis of nutrient exports in the watershed.
6. Additional field experimental studies need to be conducted to determine the nitrogen decay rates for in-stream processes in a range of canal/ditch system typical of the coastal plain. This should include a study of the variability of decay parameter on a seasonal basis.
with different land uses and management practices. Flow and water quality data collected at this study watershed and other sites need to be systematically processed and analyzed to (a) develop export coefficients (average annual field loads) specific to each land management practice, (b) to estimate annual exports using measured average annual concentration data with DRAINMOD predicted annual average outflows, and (c) to determine statistical distributions and their parameters for nitrogen components for conducting uncertainty analysis of predicted nitrogen loads at the watershed outlet.
8. Extensive field validation of DRAINMOD-N for both agricultural and forested fields is needed to provide a more reliable means of estimating export coefficients for N loading from the fields with different land uses and management practices.
9. As with hydrologic/hydraulic models, DRAINMOD based lumped parameter water quality models developed herein should also be tested with multiple site years of data to calibrate the decay parameter for different nitrogen components. Testing of these lumped parameter models is more challenging but necessary on agricultural lands with complex combinations of land uses and management practices, as they discharge larger nutrient loads to the receiving waters compared to the forested lands.
10. Further efforts including dye tracer study for measuring velocities and travel times are needed to develop and validate velocity-drainage area relationships for lower coastal plain watersheds. This will improve reliability of method for estimating travel times and delivery ratios used in G I s and spreadsheet based lumped parameter models.
1 1. Testing of the GIs based lumped parameter water quality models for watersheds with multiple land uses is needed. Spreadsheet based models should also be
tested. These methods will be very useful tools for the planners and land managers to visualize and evaluate the effects of land management practices for making management decisions.
12. The next big step is to link the lumped parameter water quality models with an uncertainty analysis component. The research on linking DRAINMOD-DUFLOW
based lumped water quality model with an uncertainty analysis component is already underway. Possibility of linking MS-EXCEL spreadsheet based model with a decision tool such as @RISK is being explored to conduct uncertainty analyses of nitrogen predictions using Monte Carlo simulations.
LUhWED PARAMETER WATER QUAIJITY MODELING OF COASTAL WATERSHEDS
Water quality problems in North Carolina coastal rivers and estuaries, such as the Neuse, are attributed to excessive nutrients, primarily nitrogen (N), but also phosphorus (P). Runoff water from all land contains some of these nutrients, which are necessary for healthy surface waters. However, they cause problems when present in excessive amounts. Nutrients are delivered to estuaries by discharge from rivers and streams, atmospheric deposition through rainfall, and groundwater discharge. They are derived from point sources (wastewater treatment plants, industrial and municipal discharges) and from nonpoint sources (runoff from agncultural and forested lands, rural communities and atn~ospheric deposition with rainfall). Scientists studyng the Neuse River Estuary system have concluded that N is the limiting element controlling plant growth, alga blooms and associated water quality problems. The N.C. Department of
Environment, Health and Natural Resources
(DEHNR)
has proposed rules 15A NCAC 2B.023 1 - .0236 (North Carolina Register, 1996) with the goal of reducing the average annual load of nitrogen delivered to the Neuse River Estuary by a minimum of 30 percent of the average annual load for the period 1990 through 1995 by the year 200 1.A large percentage of N entering coastal rivers and estuaries originates from agncultural and forested lands. The Division of Water Quality (DWQ) esti~nates that agricultural lands and forests contribute 54% and 15 %, respectively of the Neuse River Basin N load at New Bern (NC
DWQ, 1997). Through research conducted in the coastal plain soils over many years (Gambrel1
et al., 1975; Gilliam et a]., 1979; Skaggs et al., 1980; Skaggs and Gilliam, 198 1 ; Gilliam and Skaggs, 1984; Deal et al., 1986; Evans et al., 1993; Amatya et al., 1998a; Chescheir et al., 2003;
1996) we have determined both the magnitude and the factors affecting nutrient losses from agricultural and forested soils. We have also researched the use of riparian buffers and controlled drainage to reduce N and P losses to drainage waters (Gilliam et al., 1979; Skaggs and Gilliam,
1981 ; Jacobs and Gilliam, 1985; Deal et al., 1986; Gilliam, 1987; Evans et al., 1993; Arnatya et al., 1998a) and have developed models for predicting effects of land use and management practices on nutrient losses at the field edge (Parsons et al., 1989; Wright et al., 1992; Chescheir et al., 1992; Skaggs et al., 1995a; 1995b; Skaggs and Chescheir, 1999). However, these models cannot be directly applied to predict nutrient loading at the watershed scale. Because of in- stream processes, N and P loads at the watershed outlet are usually substantially less than the cumulative loads at the field edge. Watershed scale models that will consider these in-stream processes are needed to assess proposed methods for reducing nutrient loads to coastal streams and estuaries.
land uses (crops), fertility, cultural and other management practices and their distribution on the watershed? How will nutrient and sediment loads vary from year-to-year due to variability of rainfall? Is it more effective to reduce nutrient loading from field scale catchments in close proximity to the watershed outlet than from fields further upstream? If so, what is the relative importance? Answers to these questions are important to the development of strategies for targeting management practices and land uses to effectively and efficiently reduce nutrients at the watershed and river basin scales.
O Agriculture
0 Managed Forest Natural Forest
@ Automatic Stations
6 9 Manual Stations
Fl Rainfall Stations
@ Stream Sections
Figure 1 . Location of watershed study site near Plymouth in lower coastal plain o f North Carolin a.
As mentioned above, models are currently available to predict losses of nutrients and sediment at the field edge. Research is continuing to expand and refine these methods, but acceptable models are available for most management practices. We also have reliable methods for predicting the hydrology in the lower coastal plain at both field and watershed scales (e.g., Konyha and Skaggs,
developed specifically for the poorly drained soils of the lower coastal plain, to describe drainage outflows, we do not have acceptable methods for predicting nutrient loads at the watershed outlet. Models (e.g.. WASPS with submodel EUTR04, Arnbrosc st al., 199 1 ; CE-Qua1 RIV 1, Dortch et al., 1990; HSPF, Johanson et al., 198 1) for characterizing in-stream processes do exist, but their hydrologic submodels were not developed for conditions of the lower coastal plain, and the large number and uncertainty of the input parameters makes their application questionable (Reckhow, 1994, l996a, 1 996b; Whitehead, 1992; Kao and Hong, 1996; Beck, 1987; Kumar and Heatwole, 1994).
The goal of this project was to develop a robust model that will predict N loading from lower coastal plain watersheds on a monthly, seasonal or annual time frame without prohibitive input requirements. First, the reliability of our existing hydrologicihydraulic model for lower coastal plain conditions was tested by predicting daily flow rates from subwatersheds with varylng land uses. Then efforts were made to predict N loading with a relatively simple lumped parameter component for nutrient delivery. Two approaches for developing the N delivery part of the model were explored. The first approach used a simplification of an existing comprehensive .
model such as EUTR04 to predict monthly or less frequent cun~ulative N loads for lower coastal plain conditions. The second approach was based on the assumption that change in N load from a given field is exponentially dependent on time in transient as the drainage water moves from the field through the network of ditches, canals and streams to the watershed outlet. Thus, N
loading was predicted with empirically determined attenuation coefficients which would depend on such factors as drainage canal and stream conditions and season of the year. Both approaches were evaluated and the most promising chosen for further development.
HYPOTHESIS
Our hypothesis was that variations in nitrogen loading at the watershed outlet is most affected by hydrology (variation in timing and intensity of storm events) and hydraulics (time required for drainage water to travel from the field edge through the conveyance system to the outlet). We believed that methods developed in our previous research could be used to simulate the
hydrologic and hydraulic processes with reasonable levels of certainty, since these processes are well understood and the parameters (such as weather data, stream dimensions and slope)
controlling these processes can be reasonably quantified. On the other hand processes controlling nitrogen transformations are much more complex and are not nearly as well
OBJECTIVES
The overall objective of this project was to develop and test lumped parameter models for approximating in-stream processes that affect nitrogen loading at the outlets of lower coastal plain watersheds. These lumped parameter model were coupled with existing mechanistic hydrologic and hydraulic models to predict nitrogen loading at the watershed outlet. Specific objectives were:
1. to develop a lumped parameter model by determining the relative importance of processes and parameters used in complex models that simulate nitrogen
transformations and lumping or omitting the processes or parameters according to their importance in nitrogen loading at the watershed outlet;
2. to develop a second lumped parameter model by assuming simple exponential decay of nitrogen with time and empirically determining attenuation constants dependent on channel characteristics and seasonal conditions;
3. to quantify with field experiments the processes affecting in-stream attenuation of nitrogen and to determine variability of parameters used to describe those
processes;
4.
to evaluate the two lumped parameter models by comparing their predictions with field measured data and with predictions of more complex process based models; and5 . to determine the uncertainty of the lumped parameter models due to errors in
DATA COLLECTION .ANID ANALYSIS
METHODS
Site description
The study site is an intensively instrumented 10,000 ha watershed located near town of Plymouth in Washington County, NC (Fig. 1). The watershed is drained by two primary outlets on
Kendricks Creek, which flows to the Albemarle Sound in the north. The first outlet located at C7
drains about 8140 ha of land in the southern portion of the watershed, whose boundary is shown by a thick line in Figure 2. The remaining 1860 ha of land in the north and north-west drains to the second outlet at T5, about 1.5 km north of C7 (Fig. 1). The soils are very poorly drained and consist of both mineral (Portsmouth and Cape Fear series) and organic (Belhaven and Pungo series). Land uses include cropland (36%), managed forested lands (52%), unmanaged forested wetlands and riparian areas (1 1 %) and areas covered by buildings, lawns, roads, etc. (about 1%).
These percentages of forested and crop lands are typical for the region.
The drainage systems on the watershed include the major types used in the Coastal Plains. The primary system for both agncultural and forested lands is a network of field ditches and canals which divide the watershed into a mosaic of regularly shaped fields and blocks of fields (Fig. 2). Field ditches, which provide both surface and subsurface drainage, are spaced 80 to 100 m apart and range in depth from 1 .O to 1.5 m on agncultural lands and 0.6 to 1.2
m on forested lands.
Some of the forested lands do not have field ditches. The field ditches drain to a network of collector and main canals, all of which eventually lead to the watershed outlet. The watershed has flashboard riser facilities for controlled drainage on about 50% of the land.Land uses, soil types, water management practices, fertilizer applications, location and
characteristics of riparian buffer areas, and detailed information on crops and cultural practices were documented for the entire site. A geographic information system (GIs) has been developed to organize the data with respect to distribution in time and space. The GIs is based on stream, canal, road, and field data digitized from 1 :4800 orthophotos and verified by field
reconnaissance. Soil properties and other parameters determined for hydrologiciwater quality modeling are included in the GIs database.
Meteorology
Meteorological data are the key to assessments of hydrologic and water quality impacts at any location. Meteorological data are continuously measured and recorded at three weather stations located across the watershed (Fig. 2). Measurements at these stations include rainfall, solar radiation, net radiation, air temperature, relative humidity, and wind speed and direction.
Rainfall. Rainfall is being continuously measured by automatic tipping bucket gauges that are connected to these three weather stations (R2, R3, and R6) shown in Figure 2. The data at R2 and
The gauges at R2 and R3 are located at a standard height above the open ground whereas the
gauge at R6 is located above the tree canopy on a 22 m tall tower equipped with the CRlOX weather station. Moreover, there is also an automatic gauge at a standard height in an open area near R6. Data from this open area is used for the hydrologic analysis and modeling. Similarly, an additional weighing gauge near R2 serves as a backup at Tidewater Research Station (TRS). Rainfall is being measured with automatic tipping bucket rain gauges at 5 additional locations ( R l , R4, R5, R7, and R8) distributed on the site (Fig. 2). All of these stations are also equipped with manual rain gauges as backups.
Other weather parameters. The weather station at the managed forest site (R6) is mounted on a 22 m tower that can adjust the elevation of the instruments. The instruments are currently
located 7 m above the ground surface (2 m above average canopy height of 5 m). The sensors are raised every year before the beginning of the growing season to maintain at about 2m above the average tree canopy. The weather stations at the agricultural water management site (R2) and near the north entrance to the TRS (R3) include instrumentation on 3 m towers. The stations at
R2 and R6 measure air temperature, soil temperature, relative humidity, solar radiation, wind speed, and wind direction every 30 seconds and store the average values in the data loggers on a half-hourly basis. The data from two different weather stations (R2 and R6) are used and
analyzed to estimate potential evapotranspiration (ET) for short crop and forest reference vegetations, respectively. Data from R3 has not yet been used in this study.
Hydrology
Field scale monitoring. Drainage water quality and pollutant loading at the field edge are being determined from measurements at the outlets of 12 agricultural fields, 1 1 managed forested areas and 1 natural forested wetland site (Fig. 2). Eight of the agricultural sites (HI
-
H8) are on an intensively instrumented field experiment to study the interaction of water table management and fertility practices. Losses of fertilizer nutrients and sediment via surface runoff and subsurface drain outflow are measured on a continuous basis (Munster et al., 1997). The hydrology anddrainage water quality of a 135 ha wetland ( W l ) is also being continuously monitored at the field scale (Chescheir et al., 1995). Results from these two studies have been used to modify and test process-based simulation models for predicting the hydrology and water quality at the field edge from managed agricultural land and from natural wetlands (Chescheir et al., 1994; Breve et a]., 1997a; 1997b). Additional field scale gauging stations (TO and T3) are located at the outlets of fields on which swine lagoon effluent is irrigated. These sites are located on the Tidewater Research Station (TRS) where studies are being conducted to determine impacts of irrigating lagoon effluent on quality of shallow groundwater.
Field scale measurements are being conducted at 11 sites on a managed forested area (Fig. 2).
the sites (F8) was harvested (clear cut) during the summer of 1997
Field scale monitoring includes flow measurement and surface water quality sampling from field ditches or collector canals and water table measurement and shallow groundwater sampling in the field. Instrumentation at each flow measurement and surface water quality sampling station includes sharp crested V-notch weirs, water level recorders (located upstream and downstream of the weir), automatic samplers, and microprocessors to store the data and control the samplers. Flow rates are measured by a riser-culvert structure with 120' sharp-crested V-notch weir(s) on 7
ditch outlets draining field scale areas. Stage data upstream and downstream of the weir are being continuously recorded using data loggers. Water table measurement and shallow groundwater sampling stations in the field are equipped with water level recorders and microprocessors on
100 m m PVC wells and 3-50 mm PVC groundwater sampling wells screened at various depths. The water level recorders used at all stations are equipped with potentiometers to translate elevation to digital input for the microprocessors.
Microprocessors at the flow measurement and surface water quality sampling stations are programmed to control the sampler in either a flow proportional composite mode or a storm event discrete mode. The microprocessor normally operates in the flow proportional composite mode. In this mode, it prompts the sampler to take a sample when the calculated cumulative flow is greater than a specified amount. The microprocessor can be manually changed to a discrete mode when intense sampling of a storm event is desired. In discrete sampling mode, the microprocessor takes flow proportional samples until it is triggered into an intense sampling mode by a change of water elevation exceeding a specified limit. The discrete sampling mode is designed to increase the number of samples collected during the rising limb of the hydrograph when greater concentrations of nutrients and sediments are likely to occur.
Canal and stream monitoring. Gauging and sampling stations are located at 30 locations on selected canals and natural streams to determine water quality changes and pollutant transport through the canal and stream network (Fig. 2). Equipment similar to that installed at the field scale flow measurement and surface water quality sampling stations has been installed at 15 canal and stream monitoring stations to continuously record canal water levels and flow rates and to automatically sample for water quality. Five of the 15 canal and stream monitoring stations have sharp crested V-notch weirs while the other 10 stations measure flow though culvert, canal, or channel sections. The five stations with weirs have a riser-culvert structure with 120' sharp- crested V-notch weir(s). Stage data upstream and downstream of the weir are being continuously recorded using data loggers. Three of the 10 stations without V-notch weirs are equipped with Doppler velocity meters. For the 15 remaining stations without instrumentation, flow rates are manually determined and grab samples are being collected at biweekly intervals.
Intensive storm event sampling and flow measurements are usually conducted to detennine pollutant loading and in-stream water quality changes for testing prediction n~odels. The events are 3 to 5 days in duration in each of the winter, spring, summer, and autumn seasons. During an intensive sampling event, manual grab san~ples are collected at 94 additional locations over the watershed two or three times per day. Most of the additional sampling locations are along three specific main canal sections: the main canal draining through S2, the main canal draining through T4, and the main canal draining through AG4 (Fig. 2). Exact scheduling of event sampling depends on hydrologic conditions, as determined by our continuous monitoring, and weather forecasts. Only one intensive event sampling was, however, conducted in .April 1997 at the beginning of this project. Details of the instrumentation and n~onitoring procedures on this watershed have been given by Chescheir et al. (1998).
Water quality
Nutrient and sediment concentrations. Water san~ples (both grab and composite) collected at the above different monitoring stations were analyzed for different nutrient constituents and sediments e.g. N03-N, NH4-N, TKN, TP, and TSS in the soil chemistry laboratory, Depart~nent of Soil Science, North Carolina State University. Before being brought to the laboratory these samples, collected in 200 mL nalgene bottles, were stored in a large freezer at the Tidewater Research Station. The bottles were then transported to the laboratory (a 2.5-hour drive) in coolers packed with ice. Laboratory analyses of TKN, NH4-N, NO,-N and TP were colorimetric and done according to US-EPA (1 979). Procedures of APHA (1 989) were followed for analysis of
TSS. Values of concentrations were reported in r n g ~ - ' .
Nutrient and sediment loadings. Nutrient and sediment loadings at the field outlets, in-stream monitoring stations and subwatershed and watershed outlets were computed as the product of concentrations and the average volume of flow for a given period. Results were summed to obtain daily, weekly, monthly, and annual nutrient and sediment loadings.
Physical characteristics. Physical characteristics of water such as dissolved oxygen (DO) in r n g ~ - ' , temperature (OC), conductivity, and turbidity were measured at all in-stream monitoring
stations. These parameters were ~neasured whenever grab samples were taken which was normally on a bi-weekly basis.
In-stream process measurements. Two stream sections have been instrumented for field experiments (Fig. 3) to determine input parameters to in-stream process models. These sections are located in agricultural lands with organic soils on southwestern part of the watershed (Fig. 2). The first section A1-PI is on a canal, part while the second is the lateral ditch with outlet at P2. These experiments include precise measurements andlor estimates of flow and seepage rates and concentrations for nutrient balances, biomass studies, and sediment water interaction studies. Reaches (Fig. 3) were selected that have only one inflow and one outflow point. Lateral inflow from other canals, ditches or fields is minimal. Nutrient and water balances were determined for each reach. Automatic samplers and flow measurement devices were installed at the inflow and outflow points. Flow was continuously measured and discrete water quality samples were collected so as to create concentration time series with flow. Water quality samples were
analyzed for nitrogen
(TKN,
NO,-N, and NHd-N), phosphorus (total and ortho), carbon (TOC), chlorides and pH. Two sample data sets of water elevation and concentrations of nitrogen components measured during June 1998 at A1 and P1 stations are shown in Figures 4 and 5,respectively. Data in Figure 6 show the cumulative load of nitrate computed for stations A1 and
P1 for the same period. Suspended solids concentrations were also monitored at stations
upstream and downstream of each reach. The procedures described earlier were followed for the analysis of water samples for these constituents, except for TOC, which was analyzed according to ASTM (1 988). Detailed procedures are described by Birgand (2000).
; Set of groundwater level wells
1
7
-
Bn dge or p~ er CulvertGroundwater sarnpllng wells Surface water grab-smpllng sltes
\
@ Sedlment traps
-
Velocity meters0
Water level recorderB
&earn water iar&lmg stah onSJun 6Jun 7-Jun 8Jun SJun 10-Jun I l-Jun 12-Jun
Date
o Samples
- - - - -
- Stage NH4 -36- NO3-.;
TKN/
Date
Figure 6. Measured cumulative nitrate (NO$ load at inlet A1 and outlet P1 of the agricultural canal in June 1998.
Temperature was measured continuously for each reach. Temperature ("C), conductivity,
dissolved oxygen (DO), and pH were also collected manually on a biweekly basis at several field outlets, in-stream locations, subwatershed and watershed outlets. Sediment traps (Giraud, 1992) have been installed at four locations along each reach and at three locations downstream of each reach to determine sediment deposition rates. A sample of the data, showing variation in
temperatures along the water and sediment-water interface is shown in Figure 7 for the month of June 1998. More detailed data and their analyses are presented in Birgand (2000). Atmospheric deposition and litterfall into each reach were also sampled and quantified. Sediment,
atmospheric deposition and litter samples were analyzed for nitrogen content.
An assessment of the stream biomass was performed on each reach to determine the quantity of nutrients stored or taken up from the streams. Floating algae and macrophytes biomass were estimated by measuring the dry biomass. Nitrogen content was quantified for the biomass samples. Knowing the total biomass and the nitrogen concentration in the biomass gave an estimate of the nitrogen stored in the plant community for each reach.
Figure 7. Measured temperatures at different depths of water and sediment water surface at P l station in June 1998.
compute fluxes of nitrate and ammonia to and from the sediment. These experiments were conducted to determine input parameters for both complex process based models and lumped parameter models. Results from these experiments will be used to determine input parameters and the statistical distribution of measured values which will be required in subsequent error analyses. Distributions of the measured values can be used to determine the uncertainty involved in choosing input parameters. The uncertainty of a parameter as well as the effect of the
Concentration
(mglL)
0 1 2
3
45
6 7 80 4 - - - i - - - t - T - - - C - 4 , 1 7-t----T----t---T-t-~---
k
i
:
1:
Water column Sediment interfaceI .
Concentration (mg/L)
0 2 4 6 8 10 12 14 16
Sediment
0
0 Water column 0
0 0
o Sediment surface
0
0
DATA ANALYSIS
Meteorology
Rainfall. Breakpoint rainfall data measured by datalogger at R1, R2, R6, R7, and
RS
gauges were processed to obtain daily rainfall. Daily cumulative rainfall only at four of these rain gauges(Rl
,
R2,
R6
8( R8) are plotted for the years 1996, 1997 and 1998, 1999 in Figures 10 and 1 1, respecti\rely. The seasonal and annual variation of rainfall among these gauges is evident, especially in 1996 (Fig. 10, top) with tropical storms and hurricanes during the summer-fall period. Variation was smallest in the relatively dry year, 1997 (Fig. 10, bottom), followed by1998 (Fig. 11, top). Measured monthly and annual rainfall for seven rain gauges is shown in Table 1 along with long term normal rainfall measured at the National Weather Service (NWS) station near Plymouth, NC, for the 1950-90 period. Data clearly shows that summer and fall of 1997 had lower rainfall compared to 1996 and 1998. Similarly, the first six months of 1997 and 1999 had relatively lower rainfall than two other years. Monthly rainfall observed at all stations for that period was also consistently lower than the long term normal, except for a few of the stations in April 1997. The highest rainfall of the 4-year period occurred during the first six months of 1998 in all gauges. There was as much as 69 mm difference in the rainfall between the gauges R1 and R2 in June of 1996. A difference of 20-40 mm or more was found to be common between at least two gauges during the summer and fall period. Based on annual data there was no definite pattern in rainfall (Fig. 12). Annual rainfall was greatest in 1996 due to three summer- fall tropical storms. Annual rainfall in 1996 was as much as 21 % (R8) higher than the long term normal of 1292 mm at Plymouth station. Similarly, station R1 had as low as 931 mrn in the relatively dry year 1997, which was 27.9 % lower than the long term amual value of 1292 mm (Table 1, Fig. 12).
Other weather parameters. The monthly average weather parameters (air temperature, relative humidity, wind speed and net radiation) measured at two weather stations, forest, R6 and
agricultural site, R2, are presented in Tables 2 and 3, respectively, for the years 1996 through June of 1999. Long term (1950-90) air temperatures measured at NWS station at Plymouth are also presented for comparison. These weather parameters were used to estimate daily potential evapo-transpiration (PET) using Penman-Monteith neth hod for pine forest and short crop reference vegetation (Jensen et al., 1990). Maximum stomata1 conductance kom a previous pine plantation study site in North Carolina (Amatya and Skaggs, 2001) and perjodically measured leaf area index (LAI) together with a LAI function developed by McCarthy et al. (1992) were used for pine forest PET. Plots of estimated daily PET for these two vegetation surfaces are shown in Figures 13 and 14, respectively. Daily PET for pine forest vegetation varied from as low as zero during the winter to over 7 mm during the summer. Peak PET rates for both sites were often between 5 to 6 mmlday in May to July, although the forest site had some higher values between 6 and 8 mrn/day. PET data for monthly and annual periods are presented in Table 4 for forested and agricultural sites. Annual PET varied from 970 mm in a wet year, 1996, to 1042 mrn for the pine forest in 1998. Annual PET for the forested site was 6% and 8% higher than for the
1 1 I I T s i r i I I T8 1 , I I , I ~ , , I, ~ , , , , , ,IZIII
0 30 60 90 120 150 180 210 240 270 300 330 360
Day of the Year
0 30 60 90 120 150 180 210 240 270 300 330 360
Day of the Year
1
L-- -- D a y o f t h e y e a r7--
-i
1997I
I D a y o f t h e y e a r
D a y o f t h e y e a r
L
D a y o f t h e y e a r0 3 0 6 0 9 0 1 2 0 1 5 0 1 8 0 2 1 0 2 4 0 2 7 0 3 0 0 3 3 0 3 6 0
Day o f t h e Y e a r
0 3 0 6 0 9 0 1 2 0 1 5 0 1 8 0 2 1 0 2 4 0 2 7 0 3 0 0 3 3 0 3 6 0
D a y o f t h e y e a r
0 3 0 6 0 9 0 1 2 0 1 5 0 1 8 0 2 1 0 2 4 0 2 7 0 3 0 0 3 3 0 3 6 0
D a y o f t h e Y e a r
0 3 0 6 0 9 0 1 2 0 1 5 0 1 8 0 2 1 0 2 4 0 2 7 0 3 0 0 3 3 0 3 6 0
D a y o f t h e Y e a r
Table 1. Monthly and annual rainfall measured at 7 gauges across the study watershed. Blank columns indicate unavailability of data. Longterm rainfall is from National Weather Service Station at Plymouth, IVC.
( a ) . M o n t h l y R a i n f a l l d a t a , 1 9 9 6
M o n t h R 1 R 2 R 4 R 5 R 6 R 7 R 8
m m m m r n m m m m m m m m m
J a n u a r y 9 5 1 2 1 1 0 8 1 5 8
F e b r u a r y M a r c h A p r i l
M aY J u n e J u l y A u g u s t S e p t e m b e r O c t o b e r N o v e m b e r
F e b r u a r y M a r c h A p r i l M a y J u n e J u l y A u g u s t S e p t e m b e r O c t o b e r N o v e m b e r
. . . - - . - - - - -
( c ) . M o n t h l y R a i n f a l l d a t a , 1 9 9 8
J a n u a r y 1 7 0 1 5 7 1 5 1 1 5 1 1 3 9 1 4 6
F e b r u a r y M a r c h A p r i l M a y J u n e J u l y
A u g u s t S e p t e r n b e r O c t o b e r N o v e m b e r
D e c e m b e r 1 5 2 1 3 9 1 4 8 1 4 8 1 4 4 1 3 8
A n n u a l 1 2 7 9 1 2 3 1 1 3 0 8 1 2 7 6 1 0 5 9 1 1 7 1
( d ) . M o n t h l y R a i n f a l l d a t a , 1 9 9 9
J a n u a r y 9 2 9 6 8 8 8 9 8 9 7 2 8 9
F e b r u a r y 7 1 5 3 7 7 5 0
M a r c h 7 9 6 6 7 4 70
A p r i l 6 4 3 9 4 5 4 9
M a y 9 8 7 9 7 2 11 9
J u n e 74 6 6 8 5 1 2 4
J u l y 3 8 8 4 6 4 6 4
A u g u s t 1 7 6 1 5 2 1 2 6 1 7 3
S e p t e m b e r 4 0 9 4 2 9 3 6 9 3 9 9
O c t o b e r 1 9 6 1 6 4 1 3 5 1 4 0
N o v e m b e r 5 8 5 8 4 9 4 2
D e c e m b e r 3 2 4 0 3 6 34
A n n u a l 1 3 8 7 1 3 2 6 1 2 1 8 1 3 5 2
1 9 5 1 - 9 0
L o n g t e r n R a i n
1 0 3 9 8 l o 8
Table 2. Monthly average weather parameters measured above pine forest canopy at Parker Tract, NC. Longterm air temperature is from National Weather Service Station at Plymouth, NC.
1996 1997
Air Rel. Wind Net Radi- Air Rel. Wind Net Radi- L o n ~ t e r m - Temp Hum. Spd. ation Temp Hum. Spd. ation Air Temp D e g . C O/O mls ~ ~ l m ' l d a y Deg. C O/O mls ~ ~ l m ' l d a y Deg.
c
January 6.1 79.9 5.4 3.7 5.6
February 7.7 73.3 5.5 5.9 6.6
March 9.3 73.9 6.4 8.3 12.2 71.4 2.4 4.6 10.5
April 16.7 69.6 6.3 12.1 13.0 67.2 2.3 12.0 15.7
May 19.7 76.7 2.2 13.9 17.7 69.2 2.5 16.0 19.8
June 23.3 80.9 1.6 15.3 21.4 80.2 1.8 14.9 23.5
July 24.9 83.6 1.9 15.0 24.7 85.5 1.3 15.0 25.6
August 22.9 86.4 1.3 13.5 23.2 82.0 1.2 15.8 25.2
September 21.3 84.9 2.1 10.2 21 .O 85.4 1.3 11.5 22.2
October 15.8 79.6 2.0 9.1 15.4 86.1 1 .O 8.9 16.4
November 7.8 79.1 2.2 5.7 9.7 81.6 0.8 5.7 11.3
December 8.5 82.1 2.6 2.3 6.5 81.3 1.2 4 .O 7.0
1998 1999
January 7.8 86.2 1.2 2.3 7.6 84.5 1.5 3.8 5.6
Table 3. Monthly average weather parameters measured above a grass reference at Tidewater Research Station (TRS), Plymouth, NC. Longterm air temperature is from National Weather Service Station at Plymouth, NC.
1996 1997
Air Rel. Wind Net Radi- Air Rel. Wind Net Radi- Longterm
Temp Hum. Spd. ation Temp Hum. Spd. ation Air Temp
Deg.C '10 mls ~ ~ l r n ~ l d a y Deg. C % mls ~ ~ l m ~ l d a y Deg. C
January 6.1 79.9 5.4 2.7 7.5 74.1 5.4 4.4 5.6
February 7.7 73.3 5.5 4.5 10.9 79.9 6.9 4.5 6.6
March 9 . 3 73.9 6.4 6.2 14.5 72.9 11.1 8.4 10.5
April 16.7 69.6 6.3 9.1 15.4 68.8 12.6 10.4 15.7
May 20.2 76.8 4.2 8 . 8 20.7 70.0 17.4 12.6 19.8
June 23.0 76.0 3.3 10.3 23.3 76.4 20.7 11.0 23.5
July 23.3 78.4 4.0 9.7 25.3 79.4 24.5 10.4 25.6
August 21.9 80.9 2.3 8.8 25.2 74.6 23.4 10.9 25.2
September 20.0 81.9 3.6 7.0 22.4 77.9 20.8 8.2 22.2
October 16.5 76.5 3.8 6.5 16.3 78.5 15.8 6 . 5 16.4
November 8.5 77.5 3.7 4.4 10.6 78.7 4 . 5 4.5 11.3
December 9.8 80.9 3.9 3.4 8.0 79.7 4.7 3.9 7.0
1998 1999
January 9.4 82.9 4.6 3.2 9.0 79.8 2.2 1.7 5.6
February 11.2 82.1 6. I 4.4 8.9 76.3 2.5 5.0 6.6
March 12.6 75.5 5.4 7.9 9.9 70.3 2.8 7.4 10.5
April 17.2 75.2 5.2 10.4 16.0 73.0 3.0 10.2 15.7
May 21.2 79.3 2.8 10.3 19.4 81.1 2.4 I I .9 19.8
June 25.1 77.8 2 . 3 11.8 23.0 87.4 1.8 11.9 23.5
July 25.8 78.6 1.3 12.2 26.6 87.5 1 . 3 13.7 25.6
August 25.3 79.6 1.7 10.0 25.2 88.4 1.4 11.7 25.2
September 22.9 80.7 2.5 8.9 21.5 91.4 2.0 7.5 22.2
October 16.7 75.9 2.0 7.1 15.7 87.9 1 . 5 4.2 16.4
November 12.7 77.1 2.3 4.2 12.6 82.3 1 . 8 1.1 11.3
December 9.4 81.6 2.8 2.8 7.6 80.7 1.9 -0.5 7.0
Table 4. Monthly total Penman-Monteith PET estimated for (a) forested site at Parker Tract and (b) agricultural site at Tidewater Research Station (TRS), both near Plymouth, NC.
a . F o r loblolly p i n e ( P i n u s t a e d a L . ) a t f o r e s t site
I ~ o n t h Y e a r, m m
---
1 2 3 0 3 7 4 1 4 0
T o t a l , m m : 9 7 0 9 9 8 1 0 4 2 9 7 3
b . F o r s h o r t g r a s s a t a g r i c u l t u r a l site
M o n t h
1 2 3
4
5 6 7
8
9 1 0 1 1 1 2 T o t a l , m m :
<---.--- Y e a r , m m - - - >
1 9 9 6 1 9 9 7 1 9 9 8 1 9 9 9
3 6 2 6 3 7 3 8
5 6 3 7 4 4 5 2
6 4 8 1 8 2 8 6
1 1 1 1 0 1 1 0 5 1 1 5 1 0 4 1 4 3 1 0 4 1 2 2 1 1 3 1 2 9 1 2 2 I 1 4 1 1 1 1 3 0 1 2 2 1 4 1 9 1 1 3 6 1 0 2 1 2 1
7 4 9 6 9 0 7 2
7 3 7 0 6 8 5 1
4 2 3 9 4 4 3 2
3 8 2 9 3 8 3 9