INVESTIGATION
Allelic Diversity and Its Implications for the Rate
of Adaptation
Armando Caballero* and Aurora García-Dorado†,1 *Departamento de Bioquímica, Genética e Inmunología, Facultad de Biología, Universidad de Vigo, 36310 Vigo, Spain, and
†Departamento de Genética, Facultad de Ciencias Biológicas, Universidad Complutense de Madrid, 28080 Madrid, Spain
ABSTRACT Genetic variation is usually estimated empirically from statistics based on population gene frequencies, but alternative statistics based on allelic diversity (number of allelic types) can provide complementary information. There is a lack of knowledge, however, on the evolutionary implications attached to allelic-diversity measures, particularly in structured populations. In this article we simulated multiple scenarios of single and structured populations in which a quantitative trait subject to stabilizing selection is adapted to differentfitness optima. By forcing a global change in the optima we evaluated which diversity variables are more strongly correlated with both short- and long-term adaptation to the new optima. We found that quantitative genetic variance components for the trait and gene-frequency-diversity measures are generally more strongly correlated with short-term response to selection, whereas allelic-diversity measures are more correlated with long-term and total response to selection. Thus, allelic-allelic-diversity variables are better predictors of long-term adaptation than gene-frequency variables. This observation is also extended to unlinked neutral markers as a result of the information they convey on the demographic population history. Diffusion approximations for the allelic-diversity measures in afinite island model under the infinite-allele neutral mutation model are also provided.
T
HE analysis of the genetic structure of subdivided popula-tions is a key issue in most evolutionary and conservation genetics studies. Genetic variation in subdivided populations is usually estimated as gene diversity (or expected heterozy-gosity) from gene-frequency data. In addition, genetic dif-ferentiation among subpopulations is universally estimated by Wright´s (1943, 1969)fixation index (FST), by its multi-allelic version (GST, Nei 1973), or by a number of statistics closely related toFST, all of them based on differences in gene frequencies among subpopulations. Moreover,FSTorGST, es-timated from neutral molecular markers, also provides a ref-erence point for evaluating the strength of divergent selection on quantitative traits (Leinonenet al.2008; Whitlock 2008). Allelic-diversity measures,i.e., measures based on the number of different allelic types segregating in the population, are also widely used, particularly in conservation genetics studies. For example, it is recognized that the number of allelessegregating in a population gives basic information regarding pastfluctuations in population size (Neiet al.1975; Luikart
et al.1998). Moreover, the number of rare alleles can be used as an indicator of the amount of gene flow between sub-populations (Slatkin 1985; Barton and Slatkin 1986). In addi-tion, since the number of alleles can be used as an objective conservation criterion, the applications of allelic diversity to conservation issues have been widely investigated (Schoen and Brown 1993; Simianer 2005; Caballero and Rodriguez-Ramilo 2010; Caballeroet al.2010). In this respect, different coefficients of allelic subpopulation differentiation have been proposed for the partition of allelic diversity within and between subpopulations in structured populations (ElMousadik and Petit 1996; Petitet al.1998; Compset al.2001; Foulley and Ollivier 2006; Caballero and Rodriguez-Ramilo 2010). Another differentiation statistic (D) related to allelic diversity was proposed by Jost (2008) for the purpose of estimating differentiation among subpopulations using a partition of genetic diversity in (orthogonal) independent components within and between groups. A substantial debate has been generated recently on whether D should be considered an alternative or a complement for GST(Heller and Siegismund 2009; Jost 2009; Ryman and Leimar 2009; Gerlachet al.2010; Leng and Zhang 2011; Meirmans and Hedrick 2011; Whitlock 2011; Wang 2012).
Copyright © 2013 by the Genetics Society of America doi: 10.1534/genetics.113.158410
Manuscript received May 9, 2013; accepted for publication October 8, 2013; published Early Online October 11, 2013.
Supporting information is available online at http://www.genetics.org//lookup/ suppl/doi:10.1534/genetics.113.158410/-/DC1.
This article is dedicated to the memory of Jim Crow.
1Corresponding author: Dpto. de Bioquímica, Genética e Inmunología, Facultad de
The partition of diversity in gene-frequency-diversity or allelic-diversity components leads to rather different conser-vation strategies (e.g., Caballeroet al.2010), suggesting a com-plementarity between both types of diversity measures. There is, however, a lack of knowledge about the evolutionary impli-cations of allelic diversity. An aspect on which allelic diversity might have important implications is the response to selection for adaptation toward a changing environment. Whereas short-term response to selection depends on additive genetic variance and, thus, on the expected heterozygosity (Falconer and Mackay 1996), long-term response and selection limits might be more related to the number of alleles initially avail-able for selection. Biallelic locus selection models have shown that the contribution of rare alleles to the selection limit is strongly influenced by the initial population size, so that population bottlenecks restrict the overall response to selec-tion (Robertson 1960; James 1970; Hill and Rasbash 1986). This suggests that the response to long-term selection will increase with the overall number of alleles segregating in the loci controlling the selected trait and could be expected to be larger when more alleles are initially segregating per locus in a set of multiallelic marker loci. Accordingly, in a struc-tured population it may be hypothesized that the long-term rate of adaptation is more dependent on allelic differentiation among subpopulations than on gene-frequency differentia-tion. Thus, the possibility of a given subpopulation to adapt under a changing environment may depend on the possibility of receiving rare advantageous alleles by migration from other subpopulations (Blanquart and Gandon 2011).
There is also a lack of theoretical predictions for allelic-diversity measures. Ewens (1964, 1972) and Kimura and Crow (1964) provided a simple way to predict the expected number of alleles found in a sample taken from a single undivided population. In the context of structured populations, Tillier and Golding (1988) obtained approximations for the expected number of alleles in samples taken from a single subpopulation that exchanges migrants with other subpopulations. However, these approximations are restricted to very small sample sizes, because the multiple combinations of different allelic types must be taken into account in the calculations. Rannala (1996) derived the distribution of allele frequencies in a sample taken from an island population of fluctuating size, giving a general framework for the analysis of allelic-type frequen-cies. However, no direct predictive formula for the expected number of alleles per subpopulation was provided in his study. In this article, we focus our interest on investigating the relationship between adaptive potential and gene-frequency or allelic-diversity measures. We carried out computer simu-lations of single undivided or structured popusimu-lations that have reached a mutation–selection–drift equilibrium for a quantita-tive trait subject to stabilizing selection toward given optima. By changing the selection optima and allowing the population to readapt we investigated the relationship between different gene-frequency and allelic-diversity measures and short- and long-term response to selection. In addition, we developed pre-dictive equations for the within- and between-subpopulation
components of allelic diversity by using a diffusion approxima-tion approach in afinite island model with infinite-alleles neu-tral mutation.
Methods
Wefirst describe the partition of genetic diversity in a structured population through gene-frequency measures or through allelic number measures.
Measures of variation based on gene frequencies
Let us consider a structured population withnsubpopulations, where the frequency of allelekfor a given locus in subpopula-tioniispi;k, andKTis the total number of alleles in the whole population. The expected heterozygosity within subpopulations (HS) and the total expected heterozygosity (HT) are
HS¼121
n Xn
i¼1
XKT
k¼1
p2i;k !
; (1)
HT¼12
XKT
k¼1
Xn
i¼1
pi;k n
!2
(2)
(Nei 1973). The between-subpopulation component of ge-netic diversity (HT2HS) is also the average Nei´s minimum distance between subpopulations
DG¼ 1
n2
2 4Xn
i;j¼1
dij 3
5; (3)
wheredij¼1 2
PKT
k¼1ðpik2pjkÞ 2
is the distance between subpo-pulations iandj, and the statisticGST(Nei 1973) is
GST¼ ðHT2HSÞ=HT¼DG=HT: (4)
Measures of variation based on allelic numbers
A measure of diversity and differentiation referring to the number of segregating alleles in the population can be made in a way analogous to that for gene-frequency diversity as above (Caballero and Rodriguez-Ramilo 2010). In that ap-proach,aiis the number of alleles present in a random sam-ple of ggenes obtained from subpopulation i(ElMousadik and Petit 1996). Its expected value is ai¼PKT
k¼1ð12PikÞ, where Pik is the probability that allele k is not present in the sample taken from subpopulationi(rarefaction method-ology; Sanders 1968; Hurlbert 1971; Kalinowski 2004). When whole subpopulations, instead of samples, are consid-ered,Pik = 0 when the allele is segregating in the subpop-ulation and 1 otherwise. Then, the within-subpopsubpop-ulation component of allelic diversity is the average allelic number across subpopulations minus one,
AS¼ 1
n Xn
i¼1
ai !
The average allelic distance between subpopulationsiandj
(the average number of alleles present in a given subpopu-lation that are absent in the other) can be obtained as
dA;ij¼ 1 2
XKT
k¼1
ð12PikÞPjkþPik
12Pjk
(Weitzman 1998; Foulley and Ollivier 2006), and the average distance between all subpopulations is
DA¼ 1
n2
2 4Xn
i;j¼1
dA;ij 3
5: (6)
Hence, a global term (AT) is defined as the sum of both components,
AT¼ASþDA¼
2 41
n Xn
i¼1
0 @aiþ1
n Xn
j¼1
dA;ij 1 A 3
521; (7)
which indicates the average pairwise diversity of subpopu-lations,i.e., the number of different alleles available in each pairwise grouping of subpopulations, minus 1. Note thatAT is not the total number of alleles segregating in the popula-tion (KT), but generally a number substantially lower. From the above expressions, a definition of the coefficient of allelic differentiation is
AST¼ ðAT2ASÞ=AT¼DA=AT: (8) An alternative statistic proposed by Jost (2008) to measure genetic differentiation among subpopulations based on gene frequencies, but highly related to allelic diversity, is
D¼ ½DG=ð12HSÞ½n=ðn21Þ: (9)
Neglecting, for simplicity, the termn/(n–1) that corrects for thefinite number of subpopulations, and noting thatKeS¼ 1=ð12HSÞ andKeT¼1=ð12HTÞare the effective numbers of alleles (Kimura and Crow 1964; Crow and Kimura 1970; Jost 2008) of the subpopulations and the total population respectively, D can be expressed as D ðKeT2KeSÞ=KeT: Thus,Dis a measure of diversity in terms of effective numbers of alleles.
Studying indicators of adaptive potential in unstructured and subdivided populations
We performed computer simulations with the objective of investigating the extent to which different genetic measures account for the rate of adaptation, both in unstructured and subdivided populations. Simulations were carried out with an in-house C program available on request from thefirst author. In brief (the detailed procedure is explained below), we considered a quantitative trait under stabilizing selection with a given optimum, in the case of an unstructured population, or with different local optima for each subpopulation, in the case of a structured population. To begin with, we ran different
simulations of populations for a wide range of demographic and genetic parameters until an equilibrium was achieved. Each equilibrium provided a different set of initial genetic-diversity measures corresponding to different scenarios. Then, we simulated a shift in the trait’s optima, as could occur due to some change in the environmental conditions, and we tracked the adaptive process (response to selection) as the population mean approached the new optima. We then in-vestigated the relationship between the response to selection that occurred in each simulation and the amount of initial diversity provided by the different genetic-diversity variables. For the unstructured population scenario, we simulated a population with a constant numberNof diploid individu-als. A quantitative trait under stabilizing selection was as-sumed to be controlled by 10 unlinked QTL. In addition, 100 multiallelic neutral unlinked loci (markers) were also con-sidered. New alleles for markers and QTL appeared with Poisson probability at a rate uper generation according to an infinite-alleles model. Each new QTL allele had an addi-tive heterozygous effect on the quantitaaddi-tive trait obtained from an exponential distribution with mean 0.25 environ-mental standard deviations and a positive or negative sign was assigned with equal probability. The genotypic value of each individual was the sum of the values of their allelic effects and the phenotypic value was obtained by adding to the genotypic value an environmental deviation obtained from a normal distribution with mean zero and variance 1.0. Parents were chosen according to a probability proportional to theirfitness, obtained from the functionwi= exp[–(Zi–
Opt)2/2v2] (Turelli 1984), where wi is thefitness of indi-viduali, Ziis its phenotypic value, Opt is the optimum value
for the quantitative trait (Opt = 0), and v2 is an inverse measure of the intensity of stabilizing selection. Then, they were mated at random. We assumedv2= 25, which repre-sents moderately intense stabilizing selection (Garcia-Dorado and Gonzalez 1996; Mackay 2010).
For the subdivided population scenario, we considered the evolution of the same quantitative trait and genetic markers (simulated according to the procedures described above) for an island model with random migration among subpopulations. In this case, different local optima were considered for the different subpopulations withfixed values (Opt = +5, +4, +3, +2, +1,–1,–2,–3,–4,–5 for then= 10 subpopulations).
With the objective of establishing the relationship be-tween the different measures of initial genetic variation and the evolutionary change, simulations in which several param-eters were randomly chosen for each run were carried out. Thus, the size (N) of each unstructured population, or of all the subpopulations of each subdivided one, were obtained from a uniform distribution between 100 and 1000. In addi-tion, the mutation rate (u) varied uniformly between 0.00001 and 0.0004 for the unstructured population, while, for the subdivided population, the mutation rate was maintained fixed (u= 0.00001) and the migration ratem= 10–xvaried
randomly between 0.0001 and 0.1, which was achieved by sampling x from a uniform distribution between 1 and 4. Thus, for a given run, a random combination of N and u
(unstructured population scenario) orNandm(structured population scenario) was applied, allowing for a wide range of population genetic parameter values across simulations. Ten sets of 2000 runs were carried out for the single undi-vided population andfive sets of 2000 runs for the structured population scenario. Simulations for the structured population scenario were also run withfixed values of the demographic parameters (Nandm).
For each unstructured population, the diversity measures evaluated were the additive genetic variance (VA) for the quantitative trait, the average heterozygosity (H* for the QTL; H for the neutral markers), and the average number of segregating alleles (K* for the QTL; K for the neutral markers). In the subdivided population, the statistics analyzed for the quantitative trait were the within (VW), between-subpopulation (VB), and total (VT) genetic components of the variance and the QST index (QST =VB/[2VW+VB]; Spitze 1993). Furthermore, we computed diversity estimates based on gene frequencies [HS,DG,HT,GST; see expressions (1)– (4)] and estimates of allelic diversity [AS,DA,AT,KT,AST,D; expressions (5)–(9)], for QTL (denoted by an asterisk) or for neutral markers (without asterisk).
Ordinary Pearson correlation coefficients were obtained between the different diversity variables, measured before the change in the optimum, and the short-term response to selection (arbitrarily defined until generation 10;R10), long-term response to selection between generations 10 and 100 (R10–100orR10–50, andR50–100), and total response during the whole 100 generations period (RT). Multiple linear regression analyses were also carried out using the response to selection as dependent variable and the different genetic-diversity variables as independent ones. All analyses were made with the SPSS package (v. 20).
Evaluation of neutral diffusion predictions for allelic-diversity statistics
To evaluate the precision of the diffusion approximations of allelic variables under a neutral island model, computer simulations were carried out with the C program referred to above assuming a population subdivided into n= 10 sub-populations, each with constant census size N = 1000, where migration among subpopulations occurred under afinite
island model, the number of immigrants being Poisson dis-tributed with ratem,i.e., with meanNmfor the number of immigrants per generation and subpopulation. The population was run for 200,000 generations assuming random mating (including random self-fertilization). In each generation, mu-tation to new allelic variants (infinite-alleles model) for 100 unlinked multiallelic neutral loci occurred with Poisson prob-ability and rateu. The allele types for each marker locus in the last 20,000 generations were used to calculate the pop-ulation allelic variables (AS,DA, andAT) from Equation 5–7, which were averaged over loci to obtain estimates of AST (Equation 8). The total number of alleles of the population (KT) was also recorded. Simulated values were compared to the corresponding diffusion approximations.
Results
The extent to which the different initial genetic-diversity measures are correlated with the rate of adaptation was investigated by carrying out multiple simulation runs with a range of initial demographic and genetic parameter values corresponding to different effective population sizes and muta-tion or migramuta-tion rates, thus implying a substantial variamuta-tion in responses to selection across runs (seeSupporting Information,
Figure S1for an example of selection responses in a partic-ular case). Wefirst present the results for single undivided populations and then for structured populations.
Correlation between diversity measures and response to selection in single undivided populations
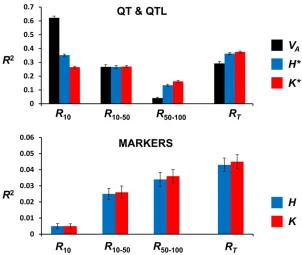
To ascertain to what extent each variability measure (quan-titative genetic variance, gene-frequency, or allelic-diversity variables) accounts for the response to selection, we carried out a correlation analysis of each variable with response to selection. The variables in this scenario are the initial additive genetic variance (VA), the average initial heterozygosity for the QTL (H*), the average initial number of segregating alleles for the QTL (K*), and the corresponding variables for the markers (H,K). The values of the squared correlation co-efficient (R2) with selection response are presented in Figure 1. Figure 1, top, shows thatVAis the best predictor of short-term response (R10), whereas the number of alleles (K*) is the best predictor of long-term (R50–100) and total (RT) responses. Diversity for genetic markers (Figure 1, bottom) predicts long-term and total response better than short-term response, correlations being marginally but consistently larger when based on allelic number. However, for all peri-ods, these correlations were much smaller than those for the quantitative trait (QT) or QTL (note the different scale be-tween the top and bottom of Figure 1).
Correlation between diversity measures and response to selection in subdivided populations
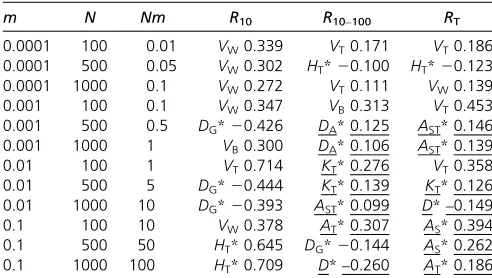
parameters, ordinary correlations were computed between all diversity measures and the short-term (R10), long-term (R10–100), and total response (RT). Table 1 gives the largest ordinary correlations (irrespective of sign) for each combina-tion of parameter values. Regarding neutral genetic marker variables, correlations between diversity variables for genetic markers and response to selection were always very small and nonsignificant, so they are not included in the table. This sug-gests that when demographic parameters, such asNandm, are invariable, genetic markers do not convey any information on response to selection for a quantitative trait.
For QT and QTL variables (Table 1), the largest correla-tions with short-term response (R10) were for different gene-frequency measures or the genetic variance for the trait. This holds for the long-term (R10–100) or total (RT) response in the cases withNm,0.5. However, for the cases withNm.
0.5, the largest correlations mostly involved allelic measures (underlined), suggesting that these convey more information on long-term response than gene-frequency measures in this scenario.
Variable demographic parameters: We carried out simu-lations where the values ofNandmwere randomly changed across runs. The above results withfixedNmvalues (Table 1) suggest different outcomes for highly isolated subpopulations (Nm,0.5,i.e.,FST.0.3) or less isolated subpopulations (Nm . 0.5,i.e., FST ,0.3). In fact, an inspection to the response to selection achieved for different values of the number of migrants (Nm) per generation and subpopulations (seeFigure S2) shows that the two scenarios should be ana-lyzed separately. In the very highly isolated subpopulation scenario (Nm , 0.5), an increase in migration implies higher short- and long-term response. In the less isolated
subpopulations scenario (Nm.0.5), however, an increase in migration implies higher short-term response but lower long-term response. Thus, in what follows, analyses are made separately for these two levels of migration.
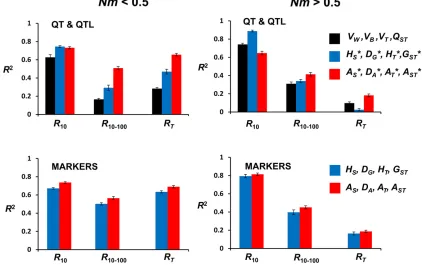
To see which type of variables predicts better the response to selection, we carried out four sets of regression analyses, each including the four main diversity measures. Thus, we performed separate analyses for the quantitative genetic parameters (VW,VB,VT, andQST), the gene-frequency vari-ables for QTL (HS*,DG*,HT*, andGST*), the allelic number variables for QTL (AS*,DA*,AT*, andAST*), and the corre-sponding sets for marker variables (HS,DG,HT, andGSTfor gene-frequency variables or AS, DA, AT, and AST for allelic variables). Figure 2 shows the values ofR2for each of these regressions. Allfive sets of variables explain a relatively large proportion of the variability for selection response (i.e., show largeR2values), except for the total response for the scenario withNm.0.5.
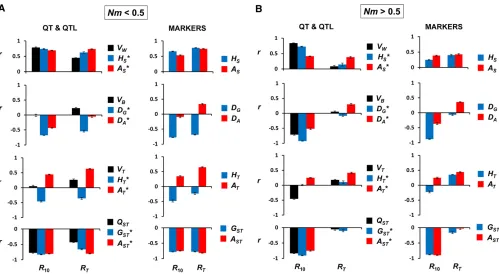
In contrast with the results obtained for the undivided population scenario or the subdivided population scenario with Nm fixed, measures based on neutral marker loci do not account for less response than those based on QTL. Thus, when demographic parameters are variable, diversity meas-ures based on neutral markers are substantially correlated with response to selection for a quantitative trait. The results also clearly show that allelic-diversity variables (Figure 2, red bars) contain more information about long-term or total response than gene-frequency (blue) or quantitative trait (black) variables.
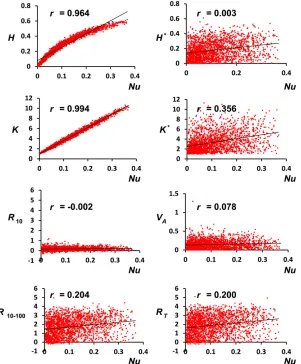
The squared correlations presented in Figure 2 involve five diversity measures. To see more specifically which di-versity variables are more correlated with response, Figure 3 gives the correlation for each of these diversity measures with Figure 1Squared correlation coefficients (R2) between initial population genetic-diversity variables and response to selection (R10, response to selection until generation 10;
short-term and total response. Correlation coefficients for all variables are presented inTable S1. For the strongly subdi-vided scenario (Nm,0.5; Figure 3A), the correlations with the largest magnitude correspond to measures of internal diversity (Figure 3A, top, withr.0) and of genetic differ-entiation between subpopulations (Figure 3A, bottom, with
r,0). This holds for allfive sets of variables and for both short-term and total response. The measure showing the largest correlation with short-term response is the within-subpopulation additive variance (VW), a correlation that can be ascribed to causality, since short-term response depends directly on this parameter. For total response, however, the best predictors are the allelic measures of genetic differen-tiation (ASTandAST*).
For the mild subdivision scenario (Nm.0.5; Figure 3B), short-term responses are positively correlated with all meas-ures of within subpopulations variability (Figure 3B, top), the largest correlation corresponding to the within-subpopulation additive variance (VW), and negatively correlated with all measures of genetic differentiation (Figure 3B, bottom) or of between-subpopulation genetic distances (VB, DG*,DA*, DG, DA). However, regarding total response, the best predictors are the allelic-diversity variables, both for QT-QTL and markers.
Neutral diffusion predictions of allelic-diversity statistics
In what follows we use diffusion approximations to derive predictions for allelic-diversity measures under an infi nite-island neutral model. Let us assume a neutral locus under infinite-allele mutation with rateuper generation, in a pop-ulation subdivided in nideal subpopulations of sizeN, fol-lowing an island model of migration among subpopulations with ratem. Therefore, the expected gene-frequency differ-entiation isGST1/[1 +M] withM= 4Nm[n/(n–1)]2+ 4Nu[n/(n–1)] (Takahata 1983), and the expected effective size of the population (Wright 1943) is
Ne¼Nn=ð12GSTÞ: (10) The expected number of alleles whose frequency lies within the rangeptop+dpin the equilibrium population isf(p)
dp, where
fðpÞ ¼ uð12pÞ ðu21Þ
p (11)
(Ewens 1964; Kimura and Crow 1964; Crow and Kimura 1970), where u = 4Neu. Although Equation 11 strictly applies to a random mating population, we show that it provides good approximations regarding several proper-ties of a subdivided population under a wide range of conditions.
Under the infinite-island model, the distribution of allele frequencies within subpopulations (ps) is given by the beta distribution with parametersa=Mpandb=M(12p),i.e.,
uðps;pÞ ¼ G½M
G½MpG½Mð12pÞps
Mp21ð12p
sÞMð12pÞ21 (12)
(Wright 1937, 1940), whereGdenotes the gamma function, and p is the whole population allele frequency. Thus, the total number of alleles segregating in the population is
KT¼
Z 1
p¼1=ð2NnÞfðpÞ dp (13)
(Ewens 1964, 1972; Crow and Kimura 1970). This latter expectation can also be approximated with a generally lower precision by Ewens (1972) formula,
KT
X2Nn
i¼1
u
uþi; (14)
and byKTulogð2NnÞ with an even lower precision. By considering expressions (11) and (12) jointly it is possible to obtain predictions of diversity measures in a subdivided population. This approach has been previously followed by Barton and Slatkin (1986) to obtain the distribution of rare alleles in a subdivided population. The expected number of alleles segregating in each subpopulation is
KS¼
Z 1
p¼1=ð2NnÞ fðpÞ
h
12LðpÞ i
dp; (15)
where
LðpÞ¼ Z 1=2N
ps¼0
uðps;pÞdps (16)
is the cumulative distribution function of uðps;pÞ between 0 and 1/2N, which gives the probability that a given sub-population lacks an allele that has frequencypin the overall population. Likewise, the expected number of alleles com-mon to two subpopulations is
Table 1 The largest (irrespective of sign) ordinary correlation between diversity measures and response
m N Nm R10 R10–100 RT
0.0001 100 0.01 VW0.339 VT0.171 VT0.186 0.0001 500 0.05 VW0.302 HT*20.100 HT*20.123 0.0001 1000 0.1 VW0.272 VT0.111 VW0.139 0.001 100 0.1 VW0.347 VB0.313 VT0.453 0.001 500 0.5 DG*20.426 DA*0.125 AST*0.146 0.001 1000 1 VB0.300 DA*0.106 AST*0.139 0.01 100 1 VT0.714 KT*0.276 VT0.358 0.01 500 5 DG*20.444 KT*0.139 KT*0.126 0.01 1000 10 DG*20.393 AST*0.099 D*–0.149 0.1 100 10 VW0.378 AT*0.307 AS*0.394 0.1 500 50 HT*0.645 DG*20.144 AS*0.262 0.1 1000 100 HT*0.709 D*–0.260 AT*0.186
The scenario refers to a subdivided population withn= 10 subpopulations of sizeN, and migration ratemper generation, mutation rateu= 0.00001 and strength of stabilizing selection given byv2= 25. Results are based on 2,000 simulations per
combination ofNandmvalues. The variables included in the model refer to the quantitative trait and QTL:VW,VB,VT,QST,HS*,DG*,HT*,GST*,AS*,DA*,AT*,
AST*,D*, andKT*(see text for definitions). In all cases, these correlations were
significantly different from zero withP,1025. Allelic-diversity parameters are
shown underlined.R10, response to selection until generation 10;R10–100, response
KcS¼
Z 1
p¼1=ð2NnÞ
fðpÞ h12LðpÞ i2
dp: (17)
The expected allelic diversity within subpopulations (AS) and the expected average allelic difference between subpo-pulations (DA) are then
AS¼KS21; (18)
DA¼KS2KcS: (19) Using Equations 7 and 8, this gives AST¼ ðKS2KcSÞ=
ð2KS2KcS21Þ;which can be computed as
AST¼
R1
1=ð2NnÞfðpÞLðpÞ
12LðpÞ
dp R1
1=ð2NnÞfðpÞ
12L2 ðpÞ
dp21:
(20)
All the above expressions can be modified to account for sampling ofggenes within each subpopulation (gnover the whole population). Thus, the total number of segregating alleles in the overall sample of gncopies is
KTðgnÞ¼ Z 1
p¼1=ð2NnÞ
fðpÞ½12ð12pÞgn dp: (21)
This can also be approximated by Equation 14, replacing 2Nnby gn.
Accordingly, the expected values ofKSandKcSwould be obtained as above (Equations 15 and 17, respectively) replacing expression (16) with
LpðgÞ¼ Z 1=2N
0 uð
ps;pÞdpsþ
Z 1
1=2Nuð
ps;pÞð12psÞgdps: (22)
Precision of the diffusion approximations
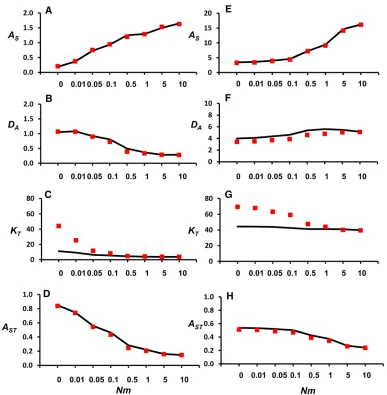
Figure 4 plots predicted and simulated values of the allelic-diversity measures (AS, DA, KT, and AST) against Nm for a range ofmvalues. They are computed for samples ofg= 100 neutral genes from each subpopulation for two different mutation rates (a more comprehensive list of results is shown inTable S2andTable S3). In general, predictions forASand DAare rather accurate, although those forDAslightly under-estimate the simulation values for the large mutation rate scenario. Predictions forKT, however, are well above the val-ues obtained through simulations for low valval-ues ofNm. The predictions ofASTare very precise in all cases.
Discussion
The increasing availability of molecular genetic markers for almost any species enables the estimation of variation through gene-frequency diversity (expected heterozygosity) and Figure 2 Squared correlation coefficients (R2) between initial population genetic-diversity variables and response to selection (R
10, response to selection until generation 10;R10–100, response from generations 10 to 100;RT, total response until generation 100) for a structured population. The scenario refers to a subdivided population withn= 10 subpopulations,Nmmigrants per generation and subpopulation, mutation rateu= 0.00001, and strength of stabilizing selection given byv2= 25. The variables included in the model are quantitative trait (QT) variables (V
gene-frequency differentiation (Wright’sfixation index and its derivatives). For multiallelic markers, such as microsatellite loci or allozymes, the number of alleles segregating per locus in the population corrected for sample size is usually also calculated in most genetic-diversity analyses. However, other measures of allelic diversity, such as allelic differenti-ation among subpopuldifferenti-ations are not normally considered. These allelic-diversity estimates can be applied, not only to multiallelic markers but also to biallelic ones, such as SNPs, if different multilocus haplotypes are regarded as alleles (see Pérez-Figueroaet al.2012 for an example of application).
The issue regarding the distinction between diversity based on “frequencies”and diversity based on “types”has been a topic of general interest in the field of ecology re-garding species diversity (Hill 1973; Jost 2007). This dis-tinction has also been discussed in the conservation (Petit
et al.1998; Toroet al.2009; Caballero and Rodriguez-Ramilo 2010; Caballeroet al.2010) and evolutionary genetics (Jost 2008; Meirmans and Hedrick 2011; Whitlock 2011; Wang 2012)fields. In this article, we have focused on the evolution-ary implications of allelic-diversity measures regarding its abil-ity to predict long-term adaptation in single and structured populations. We thus addressed whether the allelic-diversity statistics add something relevant to other genetic-diversity
measures in the evolutionary context. Our simulations show that, in fact, allelic-diversity measures are good predictors of long-term response to selection. We have also provided pre-dictions for the allelic-diversity measures for a simple neutral model and start the discussion with this issue.
Theoretical predictions of allelic-diversity measures
(a formula that assumes panmixia in the population) pre-dicts too many alleles with too small frequencies (often well below the smallest possible value 1/2Nn), which does not match the real distribution for a highly structured population. However, these extremely rare alleles make only a slight con-tribution to the prediction of the number of alleles in single subpopulations (AS), the allelic differences between pairs of them (DA), or the allelic differentiation index (AST), which are based on the subpopulation gene-frequency distribution (Equation 12). These predictive equations for the number of alleles in subpopulations can be useful, since previous approx-imations were limited to small sample sizes (Tillier and Golding 1988) or did not focus on obtaining predictive equations for the expected number of alleles (Rannala 1996).
An alternative to the above infinite-allele model that is occasionally used to predict the number of segregating alleles per locus is to assume that each locus contains a virtually infinite number of mutable sites with overall mutation rateu
and to compute the expected number of segregating alleles per locus as the expected number of segregating sites (S) per locus. Several studies have been devoted to obtaining predictions of S in structured populations (Tajima 1989;
caseu= 0.00001, however, both approaches give predictions relatively close to the values obtained by simulation.
Correlation between diversity measures and response to selection
Our results with a single undivided population clearly show that, whereas additive variance is the main factor accounting for the short-term response to selection, as expected from basic theory (Falconer and Mackay 1996), the late and total response are less dependent on the initial additive variance and more strongly correlated with the overall initial number of alleles available for selection (Figure 1). However, to un-derstand the causes of this correlation, it is useful to consider the correlations of response with the diversity measures for genetic markers, which are of course much smaller than those observed for the quantitative trait (QT) and QTL. What is striking in this respect is that the initial number of marker alleles K (or the corresponding initial heterozygosity H) is more strongly correlated with long-term than with short-term response (Figure 1, bottom). This should be ascribed to the information thatKorHconvey on the number of new muta-tions that are expected to occur during the adaptive process. The reason is that the expected number of new mutations is proportional to Nu, andK is the best indicator forNu (r= 0.994), followed byH(r= 0.964). This is illustrated in Figure 5, which also shows, in support of the previous argument, that the initial genetic variance VAand the short-term response scarcely depend onNu(r= 0.078,r=20.002, respectively). Similarly, the correlations of VAwith K or withH are very small (r=20.004 or 0.085, respectively). On the contrary, long-term and total response are more dependent onNu(r= 0.2), because they depend on the future mutational input. Figure 5 also suggests that the larger correlation of late re-sponse with K, compared to the corresponding correlation withH, is due to the fact that, in agreement with theoretical expectations, the relationship betweenHandNuis not linear, unless Nuvalues are very small, while the relationship ofK
withNuremains linear for a much larger range ofNuvalues. It is worthwhile to note that the correlation of the initial number of QTL alleles (K*) with response also increases in the long term, although the relative increase is more modest that in the case ofK. Furthermore, the correlation ofK* with
Nu (r= 0.356), although smaller than that estimated for neutral markers, is much larger than the correlation between
VAand Nu (r= 0.078). Therefore, it seems reasonable to infer that the reason why the number of QTL alleles is more informative on long-term adaptive potential than the initial additive variance is mainly that it contains more information on the expected mutational input of adaptive variability.
For a subdivided population the situation is more complex, as selection, migration, and drift have a combined impact on local adaptation. On the one hand, when an adaptive equilibrium has been attained, dispersal is generally expected to reduce the level of local adaptation, because the input of suboptimally adapted migrants increases within-subpopulation genetic variance (Lenormand 2002). On the other, for a low
migration rate scenario, the process of local adaptation after an environmental change can be enhanced by migration (Blanquart et al. 2012). In fact, when selection fluctuates in time, the level of local adaptation is maximized at inter-mediate rates of migration (Blanquart and Gandon 2011). Analogously, our simulation results indicate that, for low migration rates (Nm, 0.5), increasing migration substan-tially increases short- and, mainly, long-term response ( Fig-ure S2) but, for less subdivided populations (Nm.0.5), increased migration causes an increase of short-term response but smaller late response, having little effect on total response. Thus, we analyzed these two different scenarios independently. When there is no variation in demographic parameters (fixed N and m), the variability on adaptive potential and genetic differentiation are due to random events thatfl uctu-ate through time (including drift and the number of migra-tions and mutamigra-tions that occurred). In this situation (see Table 1), the initial values of the genetic measures for QT and QTL are causal indicators of short-term response, but poor indications of long-term adaptation, while those for neu-tral markers are poor indicators of any response to selection. The results indicate, nevertheless, that allelic-diversity varia-bles correlate more strongly with late and total response for populations that are not heavily structured (Nm.0.5,i.e.,
FSTsmaller than about 0.3), so that allelic-diversity measures become good predictors of adaptation in these scenarios.
The above conclusions generally hold whenNandmvary across replicates (Figure 2 and Figure 3). In the strongly subdivided scenario (Nm,0.5), the best predictors of total response are the allelic measures of genetic differentiation (AST and AST*, with negative correlations). The reason is that, under too strong isolation, subpopulations initially har-bor small amounts of genetic variance, and migration provides only small inputs of variability during adaptation, leading to impaired adaptive potential (Figure S2). In the low-isolation scenario (Nm . 0.5), R2 becomes much smaller for long-term or total response than for short-long-term response since, for this scenario, the metapopulation largely works in the long term like a single undivided population regardless of themvalue, so that the information aboutmcontained in these measures becomes irrelevant to long-term response. Even so, all allelic-diversity measures provide a larger cor-relation with total response than the corresponding variables from gene frequency of QTL or quantitative trait components of variance (see Figure 3B). This supports the relevance of allelic-diversity measures as good indicators of global adaptation.
an association with adaptive potential that can be similar or even larger than that from QTL. In fact, under variableNand
mvalues, the components of genetic variance for the trait and the diversity measures for the QTL usually contribute less information than the genetic markers in the long term. This probably occurs because QTL are strongly constrained by nat-ural selection, at least with the relatively intense stabilizing selection used in our simulations, so that they convey scarce information on the demographic properties of the population. In addition, the amount of information provided by neutral markers can in principle be enhanced by increasing the num-ber of analyzed markers. Therefore, the results support the use of diversity measures obtained from neutral markers to infer the adaptive potential regarding quantitative traits, at least when an important number of markers can be analyzed. In summary, we have shown that allelic-diversity meas-ures can be predicted at least for a neutral infinite-alleles island model and that they may contain information regarding the evolutionary potential for adaptation to putative future environmental changes. Our results also imply that the information on long-term adaptive potential contained in diversity measures from marker loci, including those based on allelic types, is due, to a good extent, to the information that these measures contain onNuandNm.
Acknowledgments
We thank Emilio Rolán-Alvarez, Bill Hill and two anony-mous referees for useful comments. This work was funded by Ministerio de Ciencia y Tecnología (CGL2011-25096 and CGL2012-39861-C02), Xunta de Galicia (10PXIB 310044PR and Grupos de Referencia Competitiva, 2010/80), and Fondos Feder:“Unha maneira de facer Europa.”
Literature Cited
Barton, N., and M. Slatkin, 1986 A quasi-equilibrium theory of the distribution of rare alleles in a subdivided population. Heredity 56: 409–415.
Blanquart, F., and S. Gandon, 2011 Evolution of migration in a periodically changing environment. Am. Nat. 177: 188–201. Blanquart, F., S. Gandon, and S. Nuismer, 2012 The effects of
migration and drift on local adaptation to a heterogeneous en-vironment. J. Evol. Biol. 25: 1351–1363.
Caballero, A., and S. Rodriguez-Ramilo, 2010 A new method for the partition of allelic diversity within and between subpopula-tions. Conserv. Genet. 11: 2219–2229.
Comps, B., D. Gomory, J. Letouzey, B. Thiebaut, and R. Petit, 2001 Di-verging trends between heterozygosity and allelic richness during post-glacial colonization in the European beech. Genetics 157: 389–397. Crow, J. F., and M. Kimura, 1970 An Introduction to Population
Genetics Theory, Harper & Row, New York.
ElMousadik, A., and R. Petit, 1996 High level of genetic differen-tiation for allelic richness among populations of the argan tree [Argania spinosa(L) Skeels] endemic to Morocco. Theor. Appl. Genet. 92: 832–839.
Ewens, W., 1964 Maintenance of alleles by mutation. Genetics 50: 891.
Ewens, W., 1972 Sampling theory of selectively neutral alleles. Theor. Popul. Biol. 3: 87–112.
Falconer, D. S., and T. F. C. Mackay, 1996 Introduction to Quan-titative Genetics, Longman, Harlow.
Foulley, J., and L. Ollivier, 2006 Estimating allelic richness and its diversity. Livest. Sci. 101: 150–158.
Garcia-Dorado, A., and J. Gonzalez, 1996 Stabilizing selection detected for bristle number in Drosophila melanogaster. Evolu-tion 50: 1573–1578.
Gerlach, G., A. Jueterbock, P. Kraemer, J. Deppermann, and P. Harmand, 2010 Calculations of population differentiation based on G(ST) and D: forget G(ST) but not all of statistics! Mol. Ecol. 19: 3845–3852.
Heller, R., and H. Siegismund, 2009 Relationship between three measures of genetic differentiation G(ST), D-EST and G’(ST): how wrong have we been? Mol. Ecol. 18: 2080–2083. Hill, M., 1973 Diversity and evenness - unifying notation and its
consequences. Ecology 54: 427–432.
Hill, W. G., and J. Rasbash, 1986 Models of long-term artificial selection infinite population. Genet. Res. 48: 41–50.
Hurlbert, S. H., 1971 The nonconcept of species diversity: a cri-tique and alternative parameters. Ecology 52: 577–586. James, J., 1970 Founder effect and response to artificial selection.
Genet. Res. 16: 241–250.
Jost, L., 2007 Partitioning diversity into independent alpha and beta components. Ecology 88: 2427–2439.
Jost, L., 2008 G(ST) and its relatives do not measure differentia-tion. Mol. Ecol. 17: 4015–4026.
Jost, L., 2009 Dvs.G(ST): Response to Heller and Siegismund (2009) and Ryman and Leimar (2009). Mol. Ecol. 18: 2088– 2091.
Kalinowski, S., 2004 Counting alleles with rarefaction: Private alleles and hierarchical sampling designs. Conserv. Genet. 5: 539–543. Kimura, M., and J. Crow, 1964 The number of alleles that can be
maintained in afinite population. Genetics 49: 725–738. Leinonen, T., R. O’hara, J. Cano, and J. Merila, 2008 Comparative
studies of quantitative trait and neutral marker divergence: a meta-analysis. J. Evol. Biol. 21: 1–17.
Leng, L., and D. Zhang, 2011 Measuring population differentia-tion using G(ST) or D? A simuladifferentia-tion study with microsatellite DNA markers under a finite island model and nonequilibrium conditions. Mol. Ecol. 20: 2494–2509.
Lenormand, T., 2002 Geneflow and the limits to natural selec-tion. Trends Ecol. Evol. 17: 183–189.
Luikart, G., F. Allendorf, J. Cornuet, and W. Sherwin, 1998 Distortion of allele frequency distributions provides a test for recent population bottlenecks. J. Hered. 89: 238–247.
Mackay, T., 2010 Mutations and quantitative genetic variation: lessons from Drosophila. Philos. Trans. R. Soc. Lond. B Biol. Sci. 365: 1229–1239.
Meirmans, P., and P. Hedrick, 2011 Assessing population struc-ture:FSTand related measures. Mol. Ecol. Resour. 11: 5–18. Nei, M., 1973 Analysis of gene diversity in subdivided
popula-tions. Proc. Natl. Acad. Sci. USA 70: 3321–3323.
Nei, M., 1987 Molecular Evolutionary Genetics, Columbia Univer-sity Press, New York.
Nei, M., T. Mayurama, and R. Chakraborty, 1975 The bottleneck effect and genetic variability in populations. Evolution 29: 1–10. Notohara, M., 1997 The number of segregating sites in a sample of DNA sequences from a geographically structured population. J. Math. Biol. 36: 188–200.
Pérez-Figueroa, A., S. T. Rodríguez-Ramilo, and A. Caballero, 2012 Analysis and management of subdivided populations with METAPOP, pp. 261–276 inData Production and Analysis in Population Genomics: Methods and Protocols, chap 15., edited by Pompanon, F., and A. Bonin. Humana Press, Clifton, NJ. Petit, R., A. El Mousadik, and O. Pons, 1998 Identifying
popula-tions for conservation on the basis of genetic markers. Conserv. Biol. 12: 844–855.
Rannala, B., 1996 The sampling theory of neutral alleles in an is-land population offluctuating size. Theor. Popul. Biol. 50: 91–104. Robertson, A., 1960 A theory of limits in artificial selection. Proc.
R. Soc. Lond. B Biol. Sci. 153: 235–249.
Ryman, N., and O. Leimar, 2009 G(ST) is still a useful measure of genetic differentiation - a comment on Jost’s D. Mol. Ecol. 18: 2084–2087.
Sanders, H. L., 1968 Marine benthic diversity: a comparison study. Am. Nat. 102: 243–282.
Schoen, D., and A. Brown, 1993 Conservation of allelic richness in wild crop relatives is aided by assessment of genetic-markers. Proc. Natl. Acad. Sci. USA 90: 10623–10627.
Simianer, H., 2005 Using expected allele number as objective function to design between and within breed conservation of farm animal biodiversity. J. Anim. Breed. Genet. 122: 177–187. Slatkin, M., 1985 Rare alleles as indicators of geneflow. Evolution
39: 53–65.
Spitze, K., 1993 Population structure inDaphnia obtusa: quanti-tative genetic and allozymic variation. Genetics 135: 367–374. Tajima, F., 1989 DNA polymorphism in a subdivided population: The expected number of segregating sites in the two-subpopu-lation model. Genetics 123: 229–240.
Takahata, N., 1983 Gene identity and genetic differentiation of populations in thefinite island model. Genetics 104: 497–512. Tillier, E., and G. Golding, 1988 A sampling theory of selectively
neutral alleles in a subdivided population. Genetics 119: 721–729. Toro, M., J. Fernandez, and A. Caballero, 2009 Molecular char-acterization of breeds and its use in conservation. Livest. Sci. 120: 174–195.
Turelli, M., 1984 Heritable genetic-variation via mutation selec-tion balance - lerch zeta meets the abdominal bristle. Theor. Popul. Biol. 25: 138–193.
Wakeley, J., 1998 Segregating sites in Wright’s island model. Theor. Popul. Biol. 53: 166–174.
Wakeley, J., 2001 The coalescent in an island model of population subdivision with variation among demes. Theor. Popul. Biol. 59: 133–144.
Wang, J., 2012 On the measures of genetic differentiation among populations. Genet. Res. 94: 275–289.
Weitzman, M., 1998 The Noah’s Ark Problem. Econometrica 66: 1279–1298.
Whitlock, M., 2008 Evolutionary inference from Q(ST). Mol. Ecol. 17: 1885–1896.
Whitlock, M., 2011 G’(ST) and D do not replace F-ST. Mol. Ecol. 20: 1083–1091.
Wright, S., 1937 The distribution of gene frequencies in popula-tions. Proc. Natl. Acad. Sci. USA 23: 307–320.
Wright, S., 1940 Breeding structure of populations in relation to speciation. Am. Nat. 74: 232–240.
Wright, S., 1943 Isolation by distance. Genetics 28: 114–138. Wright, S., 1969 Evolution and the Genetics of Populations: The Theory
of Gene Frequencies, The University of Chicago Press, Chicago, Illinois.
GENETICS
Supporting Information http://www.genetics.org//lookup/suppl/doi:10.1534/genetics.113.158410/-/DC1
Allelic Diversity and Its Implications for the Rate
of Adaptation
Armando Caballero and Aurora García-Dorado
0
2
4
6
8
10
0
20
40
60
80
100
Mean
Generations
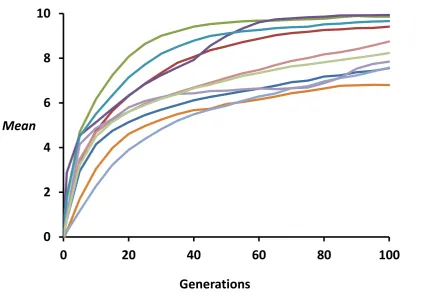
Figure S1 Example of simulated selection responses (change in the phenotypic mean for the selected quantitative trait)
occurred after a change in the selection optimum in the population. The scenario refers to a subdivided population with n =
10 subpopulations, with a subpopulation census size randomly taken between 100 and 1000 and a migration rate among
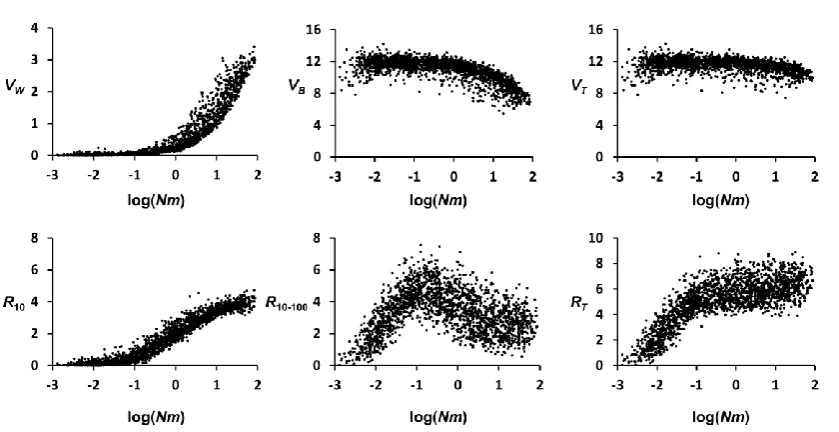
Figure S2 Initial quantitative trait variance components and responses to selection for the simulations plotted
against the number of migrants per generation and subpopulation (Nm, in log10). The scenario refers to a subdivided
population with n = 10 subpopulations, number of migrants per generation and subpopulation (Nm) either < 0.5 or
> 0.5, mutation rate u = 0.00001 and strength of stabilising selection 2 = 25. Results are based on 2,000 simulations
varying the subpopulation size (N) randomly between 100 and 1000, and the migration rate (m) between 0.0001
and 0.1. VW: Within-subpopulation genetic variance; VB: Between-subpopulation genetic variance; VT: Total genetic
variance; R10: response to selection until generation 10; R10-100: response from generations 10 to 100; RT: total
response until generation 100.
The figure shows that whereas the short-term response (R10) increases monotonically with Nm, the late response
(R10-100) increases with Nm for log(Nm) –0.3 (Nm < 0.5), and decreases thereafter. This indicates that, when subpopulations are considerably isolated from one another (Nm < 0.5, corresponding to an expected FST > 1/3),
VW is very low and VB rather high, and late and total response increase with Nm, due to the slow but continuous
increase of Vw at the expense of VB. For higher levels of migration (Nm > 0.5; corresponding to FST < 1/3), VW increases substantially with migration, implying an increase in the short-term response, but VB and VT decline
Table S1 Ordinary correlation coefficients between initial population genetic diversity variables and response to
selection for a structured population
Nm < 0.5 Nm > 0.5
R10 R10-100 RT R10 R10-100 RT
VW 0.786 0.269 0.450 0.839 –0.515 0.084
QT VB –0.011 0.270 0.228 –0.715 0.543 0.052
VT 0.050 0.293 0.264 –0.455 0.468 0.178
QST –0.774 –0.251 –0.431 –0.833 0.536 –0.055
QTL HS* 0.738 0.487 0.623 0.726 –0.387 0.143
DG* –0.678 –0.417 –0.547 –0.930 0.581 –0.082
HT* –0.458 –0.268 –0.357 0.009 0.082 0.105
GST* –0.830 –0.500 –0.659 –0.904 0.544 –0.104
AS* 0.690 0.634 0.734 0.414 0.033 0.382
DA* –0.433 0.079 –0.054 –0.519 0.615 0.299
AT* 0.443 0.598 0.635 0.249 0.175 0.414
KT* –0.385 0.009 –0.100 –0.097 0.428 0.427
AST* –0.805 –0.672 –0.800 –0.749 0.613 0.107
D* –0.621 –0.369 –0.490 –0.889 0.561 –0.072
Markers HS 0.660 0.690 0.774 0.248 0.165 0.401
DG –0.779 –0.550 –0.689 –0.882 0.562 –0.065
HT –0.483 –0.116 –0.234 –0.225 0.454 0.353
GST –0.782 –0.650 –0.774 –0.875 0.473 –0.165
AS 0.531 0.694 0.742 0.385 0.090 0.426
DA –0.091 0.425 0.337 –0.368 0.561 0.360
AT 0.344 0.646 0.648 0.248 0.198 0.441
KT –0.137 0.373 0.280 –0.150 0.458 0.419
AST –0.748 –0.710 –0.816 –0.895 0.601 –0.029
D –0.774 –0.521 –0.662 –0.881 0.568 –0.057
The scenario refers to a subdivided population with n = 10 subpopulations, Nm migrants per generation and subpopulation, mutation rate u = 0.00001 and strength of stabilising selection given by 2 = 25. The variables
Table S2 Comparison between computer simulations and diffusion approximations (E[] in bold face) for different
gene frequency and allelic diversity variables.
u = 0.00001
Nm AS E[AS] DA E[DA] AST E[AST] KT E[KT]
0 0.299 0.301 1.152 1.146 0.794 0.792 12.36 68.198
0.01 0.512 0.547 1.203 1.174 0.701 0.682 10.50 37.366
0.05 0.923 1.059 1.028 0.969 0.527 0.478 7.31 16.269
0.1 1.444 1.277 0.935 0.749 0.393 0.370 6.57 11.208
0.5 1.652 1.483 0.533 0.385 0.244 0.206 5.45 6.223
1 1.628 1.574 0.436 0.330 0.211 0.173 4.94 5.515
5 1.961 1.909 0.365 0.280 0.157 0.128 4.75 4.928
10 2.218 2.080 0.337 0.269 0.132 0.115 4.76 4.853
50 2.431 2.464 0.265 0.248 0.098 0.092 4.64 4.792
100 2.592 2.598 0.283 0.236 0.098 0.083 4.72 4.785
500 3.009 2.782 0.233 0.180 0.072 0.061 4.87 4.779
1000 3.110 2.802 0.217 0.136 0.065 0.046 4.91 4.778
u = 0.0002
0 5.605 4.887 5.945 4.382 0.515 0.473 66.05 112.854
0.01 5.784 5.058 6.049 4.435 0.511 0.467 65.16 110.190
0.05 6.370 5.782 6.402 4.683 0.501 0.448 64.84 101.763
0.1 7.323 6.552 6.854 4.872 0.483 0.427 63.67 94.500
0.5 11.942 10.520 7.653 5.352 0.391 0.337 61.33 74.240
1 15.569 13.205 7.768 5.389 0.333 0.290 61.87 68.030
5 23.456 20.803 7.196 5.249 0.235 0.202 61.55 61.392
10 26.924 24.416 6.750 5.222 0.200 0.176 60.98 60.419
50 33.847 32.129 5.857 4.880 0.147 0.132 60.08 59.614
100 36.821 34.941 5.323 4.777 0.126 0.120 58.88 59.511
500 40.904 38.592 4.822 3.610 0.105 0.086 58.87 59.429
1000 43.009 38.968 4.649 2.707 0.098 0.065 59.92 59.419
The scenario considered refers to a subdivided population with n = 10 subpopulations, each of size N = 1000
individuals, mutation rate u, variable migration rate (m), and no sampling(all subpopulation individuals are
Table S3 Comparison between computer simulations and diffusion approximations (E[] in bold face) for different
allelic diversity variables.
u = 0.00001
Nm g AS E[AS] DA E[DA] AST E[AST] KT E[KT]
0 100 0.188 0.207 1.052 1.072 0.848 0.838 11.250 44.151
50 0.182 0.170 1.047 1.041 0.852 0.860 11.224 37.873
20 0.144 0.129 1.012 1.007 0.876 0.887 10.838 29.597
10 0.119 0.103 0.990 0.986 0.893 0.906 10.596 23.505
1 100 1.293 1.290 0.368 0.337 0.221 0.207 3.950 4.282
50 1.192 1.168 0.367 0.345 0.236 0.228 3.806 4.012
20 0.980 0.982 0.350 0.346 0.264 0.260 3.460 3.568
10 0.792 0.806 0.339 0.347 0.301 0.301 3.196 3.231
1000 100 1.968 1.839 0.250 0.277 0.113 0.131 3.870 3.751
50 1.565 1.569 0.248 0.277 0.137 0.150 3.474 3.487
20 1.189 1.202 0.249 0.277 0.173 0.187 3.084 3.124
10 0.898 0.923 0.248 0.278 0.217 0.231 2.818 2.848
u = 0.0002
0 100 3.439 3.274 3.995 3.431 0.537 0.512 44.390 69.487
50 2.900 2.738 3.510 3.060 0.548 0.528 39.004 58.257
20 2.174 2.085 2.857 2.609 0.568 0.556 31.742 43.646
10 1.629 1.639 2.366 2.295 0.592 0.583 26.290 33.168
1 100 9.441 9.106 5.608 4.803 0.373 0.345 41.140 44.052
50 7.877 7.366 4.894 4.392 0.383 0.374 35.330 38.171
20 5.580 5.392 3.955 3.818 0.415 0.415 28.250 29.810
10 3.865 3.786 3.173 3.180 0.451 0.457 22.940 23.658
1000 100 20.181 20.206 4.847 5.236 0.194 0.206 39.390 28.938
50 15.401 15.320 4.529 5.044 0.227 0.248 33.694 33.583
20 9.451 9.350 3.957 4.358 0.295 0.318 26.608 26.507
10 5.802 5.758 3.283 3.600 0.361 0.385 21.428 21.271
The scenario considered refers to a subdivided population with n = 10 subpopulations, each of size N = 1000
individuals, mutation rate u, variable migration rate (m), and g sampled genes per subpopulation. See main text for

![Table S2 Comparison between computer simulations and diffusion approximations (E[] in bold face) for different](https://thumb-us.123doks.com/thumbv2/123dok_us/1551943.1190507/17.595.89.487.127.659/table-comparison-computer-simulations-diffusion-approximations-bold-different.webp)
