Abstract
YOUNG, STUART. Improved EST Annotation Using Multiple External Databases. (Under the direction of Douglas L. Crawford.)
Expressed sequence tags (ESTs) are the largest existing genomic resource and play an
important role in a wide range of genomic research areas. Correct and useful functional
annotation of EST resources enhances their use with other genomic resources.
Chapter 2 describes problems with the use of BLAST sequence similarity searches to
annotate new species-specific sequence databases. To reduce annotation errors, an
incremental approach is proposed based on comprehensive database searches to verify
functionally similar BLAST hits. In Chapter 3, machine learning models based on protein
motifs are proposed as an alternative or adjunct to sequence similarity methods for functional
annotation. This motif-based approach is particularly suited to the annotation of sequence
fragments such as EST collections. In Chapter 4, a methodology to improve EST collection
annotation by a series of quality control steps is described. This methodology was
implemented on the updated F. heteroclitus EST database using myEST, an open-source EST
annotation platform. The myEST platform implements the methods discussed in the
previous chapters and also incorporates additional steps integrating data from multiple
external databases to improve EST quality control, provide more accurate annotation and
Improved EST Annotation Using Multiple
External Databases
by
Stuart Young
A dissertation submitted to the Graduate Faculty of North Carolina State University
in partial fulfillment of the requirements for the Degree of
Doctor of Philosophy Bioinformatics
Raleigh, North Carolina
2008
APPROVED BY:
____________________________ _________________________ Gregory C. Gibson Craig Sullivan
Chair of Advisory Committee
_________________________ _________________________ Spencer Muse Steffen Heber
ii
Dedication
iii
Biography
Stuart Young earned his B.Sc. Biological Sciences from the University of Leicester,
England, in 1989 before embarking on a career in journalism. Returning to his original
interest in the life sciences, he graduated with an M.S. Bioinformatics from Indiana
iv
Table of Contents
List of Tables ... vii
List of Figures ... ix
Introduction ... 1
1. Annotation... 1
1.1 Homology... 2
1.2 Analogy ... 2
1.3 Orthology ... 2
1.4 Paralogy ... 3
1.5 Sequence similarity ... 3
2. BLAST E-value Cutoffs ... 4
3. Expressed Sequence Tags (ESTs) ... 5
3.1 Condition-specific expression ... 6
3.2 Gene identification in genomic data ... 8
3.3 Alternative splicing prediction ... 10
3.4 Caveat: A High Proportion of Uncharacterized ESTs ... 11
4. A short history of F. heteroclitus ... 11
4.1 Phylogeny... 12
4.2 Fundulus heteroclitus as a Genomic Resource ... 13
5 Machine learning using protein motif inputs ... 18
5.1 An introduction to Decision Trees ... 19
5.2 An introduction to Naïve Bayes ... 20
References ... 23
Chapter 2: Incremental mismatch probability filter improves BLAST annotation accuracy ... 34
Abstract ... 35
Introduction ... 36
Methods ... 38
2.1 UniGene and Swiss-Prot BLAST Comparisons ... 38
v
2.3 Fuzzy Matching of BLAST Annotations ... 39
2.4 Incremental mismatch probability to validate BLAST hits ... 40
Results ... 41
3.1 Estimated proportion of missing orthologues ... 42
3.2 Estimation of annotation quality ... 43
3.3 Estimating the similarity of E-values... 44
3.4 Fuzzy Match Algorithm matches similar annotations ... 45
3.5 The utility of the incremental mismatch probability statistic ... 48
Conclusion ... 54
References ... 60
Chapter 3: InterPro Motif Annotation Trees (IMAT) ... 73
Abstract ... 74
Introduction ... 75
Methods ... 77
2.1 Motif distributions and correlations... 77
2.2 Validating Decision Trees ... 77
2.3 Human UniGene orthologues ... 78
2.4 CluSTr orthologues ... 78
2.5 Eukaryotic orthologues (KOG) ... 79
2.6 Orthologue training/test set selection ... 79
2.7 Swiss-Prot tree training/test set selection... 80
2.8 Motif categorization ... 81
2.9 Swiss-Prot Decision Tree evaluation ... 82
2.10 InterProScan for motif finding ... 83
Results ... 84
3.1 Motif distributions and correlations... 84
3.2 Decision Trees outperform Naïve Bayes ... 85
3.3 Large, fixed length attributes are optimal ... 85
3.4 Swiss-Prot trees predict function ... 86
Conclusion ... 87
vi
Chapter 4: Improved EST database annotation... 105
Abstract ... 106
Introduction ... 107
2.1 Quality control is essential for EST projects ... 108
2.2 Improved data access and interaction ... 109
2.3 Data sharing and interaction across the web ... 110
Methods ... 111
3.1 Organism EST collections ... 111
3.2 BLAST and InterPro motif searches... 112
Results ... 113
4.1 Pre-assembly quality control ... 113
4.2 Quality control during cluster assembly ... 115
4.3 Post-assembly quality control ... 115
4.4 Choice of BLAST database ... 117
4.5 Incremental mismatch probability aids Annotation ... 120
4.6 Mappings between external databases ... 121
4.6.1 Metabolic pathway annotation ... 121
4.6.2 Annotation synonyms ... 123
4.7 Web Interface ... 124
4.8 Data visualization and exploration ... 125
4.7 dbEST Submission... 127
Conclusion ... 128
References ... 131
vii
List of Tables
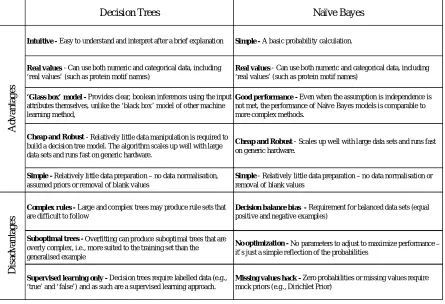
Table 1 - 1 The advantages and disadvantages of Decision Trees and Naive Bayes. ... 29
Table 2 - 1 BLAST of 1,000 human UniGenes. ... 62
Table 2 - 2 Number of annotations that are dependent or poor quality. ... 63
Table 2 - 3 Relative E-values of the next best hits for three mammalian UniGenes. ... 64
Table 2 - 4 Evaluation of FuzzyMatch performance. ... 65
Table 2 - 5 Comparison of Swiss-Prot and Mouse Annotations. ... 66
Table 2 - 6 Evaluation of the incremental mismatch probability method to validate 'best hit' annotations. ... 67
Table 3 - 1 Evaluation of fuzzy matching for human 1,000 and Swiss-Prot annotations. ... 94
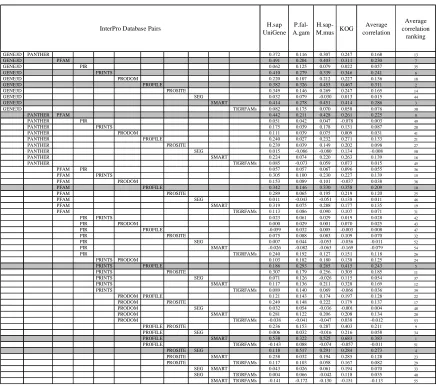
Table 3 - 2 Pairwise correlations of protein motifs from different InterPro databases among three orthologue databases and an expressed sequence tags (EST) collection. ... 95
Table 3 - 3 Pairwise correlations of protein motifs from different InterPro databases for all Swiss-Prot sequences with InterPro hits (total 276,372). ... 96
Table 3 - 4 Decision Tree and Naïve Bayes orthologue prediction performances for five different datasets, including UniGene, Clustr and KOG. ... 97
Table 3 - 5 Incorrect BLAST hits for 1,000 randomly selected human UniGene against Swiss-Prot and the mouse, dog and rat UniGene databases. ... 98
Table 3 - 6 Swiss-Prot protein Decision Tree lookup and prediction performance. ... 99
Table 4 - 1 Funnybase 2.0 EST tissue sample experiments and read counts. ... 133
Table 4 - 2 The three stages of quality control in the myEST pipeline. The pipeline consists of a Pre-Assembly, Assembly and Post-Assembly stages which involve different types of quality control and error checking measures. ... 134
Table 4 - 3 Expressed sequence tag (EST) reads from A. californica were successively and cumulatively assembled using CAP3. The number of contigs and singlets increased with the number of experiments making up the pool of pre-assembly EST reads, as did the number of assembled sequences (contigs and singlets) that had BLAST hits against Swiss-Prot and the RefSeq human, mouse, dog and rat databases (BLAST E-value cutoff: 10-5). ... 135
Table 4 - 4 CAP3 cutoff parameters used in the optimization of K. brevis EST assembly... 136
Table 4 - 5 Pre- and post-filter contig and singlet counts for K. brevis EST assemblies using CAP3 overlap percent identity and overlap length cutoffs. ... 137
Table 4 - 6 The number and quality of BLAST hits and sequence complexity improves dramatically with pre-assembly filtering of K. brevis sequence reads. ... 138
Table 4 - 7 Lack of consistency in Refseq annotation format hinders automated parsing of synonyms. ... 139
viii
ix
List of Figures
Figure 1 - 1 Orthologues and paralogues are two types of homologous sequences. ... 30
Figure 1 - 2 Traditional assembly methods often give incorrect results because they fail to consider alternative splicing. (Pevzner Group) ... 31
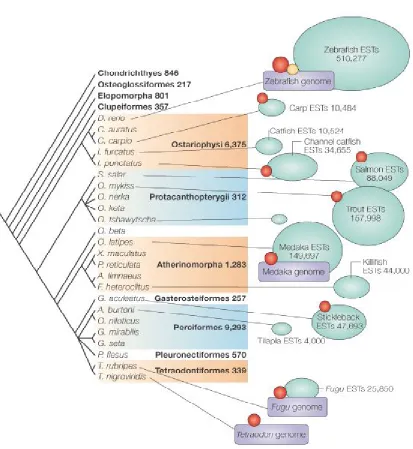
Figure 1 - 3 Distribution of genome sequencing, major EST projects (>1000 sequences), large-insert libraries and radiation hybrid panels in relation to a conventional fish phylogeny. ... 32
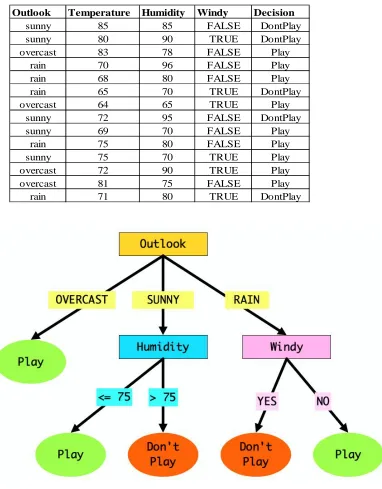
Figure 1 - 4 Decision Tree for deciding whether to play golf. ... 33
Figure 2 - 1 Number of significant hits for 1,000 human UniGenes. ... 68
Figure 2 - 2 FuzzyMatch Algorithm... 69
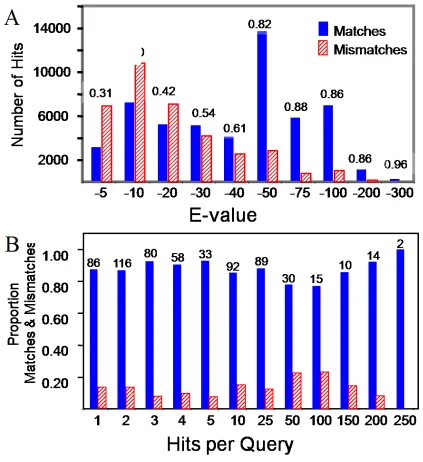
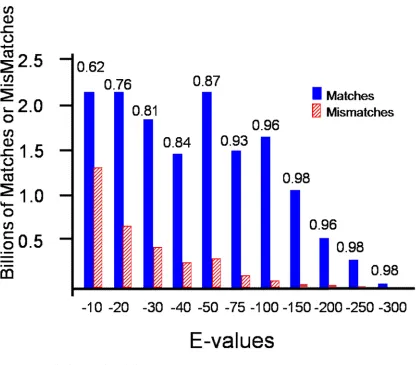
Figure 2 - 3 Matched and Mismatched Annotations. ... 70
Figure 2 - 4 Self-BLAST of Swiss-Prot. ... 71
Figure 2 - 5 Incremental mismatch probability for human UniGene S15967514 (Cytochrome c oxidase subunit 8A). ... 72
Figure 3 - 1 Swiss-Prot training/test set selection based on InterPro hits of orthologue set. 100 Figure 3 - 2 Generation of InterPro-derived attributes for input into machine learning algorithm. ... 101
Figure 3 - 3 Decision Tree generation using InterPro attributes. ... 102
Figure 3 - 4 A workflow for comparing Naïve Bayes and Decision Tree models of motif signatures in three orthologue databases and a 1,000-sequence sample of the human UniGene EST collection. ... 103
Figure 3 - 5 Most InterPro motifs occur in two or more functionally different Swiss-Prot proteins. ... 104
Figure 4 - 1 Distribution of sequences per organism in the dbEST public EST database. ... 142
Figure 4 - 2 The three EST species collections used in the development and testing of the myEST assembly and annotation platform: Fundulus heteroclitus (mummichog), Karenia brevis (red tide) and Aplysia californica (sea hare). ... 143
Figure 4 - 3 The synchronous interaction pattern of a traditional web application (top) compared with the asynchronous communication between server and client of an AJAX application (bottom) (Garrett 2005). ... 144
Figure 4 - 4 The myEST plate display function shows marker and cloned sequence information for each 96-well plate in the collection. ... 145
Figure 4 - 5 Cumulative assembly of A. californica sequence read libraries. ... 146
Figure 4 - 6 Display of database statistics for the F. heteroclitus EST collection. ... 147
x
1
Introduction
The principal focus of this research is the development of improved annotation for expressed
sequence tag (EST) databases. We have accomplished this by developing quality control
methods for the EST database construction process and by the careful integration of external
database searches in the annotation process. This includes a filtering mechanism for BLAST
searches which looks at the overall similarity of possible homologues to proteins in a large
database, rather than just focusing on the query-target pair, and the use of protein motifs and
machine learning techniques to identify unique motif signatures in orthologue groups.
In this introduction we will first briefly clarify what is meant by the term annotation, then
discuss in some detail the benefits and pitfalls of EST sequencing and assembly. Finally, we
will review the use of the estuarine fish Fundulus heteroclitus as a non-model organism and
give a brief overview of the use of machine learning techniques in analyzing biological
annotations.
1. Annotation
The term ‘annotation’ – originally a comment, summary or explanatory notes by an author or
scholar – has come to mean in the biological sense one or more of the following: protein
function, 3-D structure, functional domains, cellular location, post-transcriptional
modification, chromosomal location, association with disease traits, promoter elements,
2
of biological objects using terms from predefined vocabularies. The value of the annotation
lies in the relevance and usefulness of these vocabularies in defining what it is we need to
know about those objects.
The vast majority of biological sequence annotation is based on the notion of homology. To
aid further discussion on this topic, we will first define the meanings of some common terms
used to describe sequence similarity.
1.1 Homology
Homologous genes are two or more genes in the same or in different species that are derived
from a common ancestor (NCBI 2007) (and may or may not share the same function – see
Orthology and Paralogy below). Generally, sequence similarity is assumed to correspond to
homology. This is under the assumption that sequences are conserved due to evolutionary
pressures which act to constrain their structure in order to maintain their function.
1.2 Analogy
Two genes are analogous if they share the same function but are not derived from the same
ancestral gene. This is an example of convergent evolution, similar to bird wings and bat
wings (Webber and Barton 2003).
1.3 Orthology
In the strict sense, orthology is only concerned with evolutionary events, not function (Figure
3
ancestor. By default, orthologues are homologues. Although orthology is defined with
respect to evolution and not function, the more recently two genes shared a common
ancestor, the more likely it is that they have retained similar functions. Moreover,
orthologous genes that have been spared by natural selection from deletion or duplication
over many millions of years are also likely to share overlapping functions. The longer two
orthologous genes have remained in two different organisms under the pressures of natural
selection, the more likely it is that they share the same biological function(s). However, any
proposal to classify two orthologous genes as homologues will be strengthened by additional
evidence such as shared secondary structure (helices, loops, etc.), tertiary/3D structure and
binding site locations.
1.4 Paralogy
Similar to orthology, paralogy is only concerned with evolutionary events, not function
(Figure 1 -1). Paralogous genes are separated by a gene duplication event. Paralogous genes
are often found within a species, but can also be present across species (e.g., the human
hemoglobin gene and the chimpanzee myoglobin gene).
1.5 Sequence similarity
Often measured by percent identity, sequence similarity between two sequences is not
necessarily the same as orthology or parology, but it is a good indicator. Generally speaking,
the higher the percentage identity (proportion of residues in common) between two
4
for the idea of ‘sequence similarity = evolutionary distance = functional distance’ can be
found in the classification of isozymes - different genes whose products catalyze the same
reaction. In many cases, isozymes are coded for by homologous genes that have diverged
over time and the degree of similarity in function is commensurate with the percent sequence
identity.
2. BLAST E-value Cutoffs
A reliance on Basic Local Alignment Search Tool (BLAST) (Altschul, et al. 1990) and other
sequence alignment tools to identify sequences with some degree of homology is common
practice for high-throughput annotation of large biological sequence databases. For example,
the Joint Genome Institute’s Integrated Microbial Genomes (IMG) genome annotation and
analysis system (Integrated Microbial Genomes 2007) uses a BLAST E-value cutoff of 10-5
as a crucial step in the annotation of predicted coding sequences (CDS, or prospective genes).
Genes are assigned to clusters of orthologous groups (COGs) based on a reverse position
specific BLAST (RPS-BLAST) search of NCBI's Conserved Domain Database
(Marchler-Bauer, et al. 2002) (CDD) using an E-value threshold of 10-2.
The Institute for Genomic Research (TIGR) database annotation cutoffs range from 10-5 (for
putative gene annotation assignment using BLASTX against GenBank's non-redundant
amino acid database, nraa (Integrated Microbial Genomes 2007), to 10-10 (for tBLASTX
mapping between potato ESTs and the A. thaliana genome (Research 2007)). TIGR’s
5
reading frames (ORFs), against several protein databases, including GenBank proteins, the
Protein Information Resource (PIR) and Swiss-Prot. A refined search is then performed
using a modified Smith-Waterman alignment on the BLAST hits from the first step. The
setting of the E-value cutoff is left to the database custodians and values as high as 0.1 have
been used (Beckstrom-Sternberg, et al. 2007).
But what is a reasonable E-value cutoff? Generally, no objective criterion is given for setting
E-value cutoffs, although an arbitrary threshold of 10-5 is common. Often, scientists use their
experience to arrive at trusted cutoff scores and supplement these with BLAST searches
against additional databases, such as EST databases. In the absence of any guidelines or
previous experience, one approach is to go by the degree of human intervention in the
annotation process: choose a more stringent cutoff when human intervention is absent and a
more permissive threshold where human intervention is used to quality-check automated
annotations.
In Chapter 2, we propose a more reliable way of setting E-value cutoffs based on an
incrementalist approach using large-scale BLAST searches of the manually curated
Swiss-Prot database.
3. Expressed Sequence Tags (ESTs)
Expressed sequence tags (ESTs) were the first wave of ‘genomic data’ – a convergence of
genomic technology and computational power that made it possible to sample from the
6
from the cell’s whole RNA population (including mRNA, pre-mRNA, siRNA, etc.).
In the sequencing process, each EST is output as a sequence of residue predictions with
varying degrees of base prediction accuracy. Current sequencing technology provides a
‘quality value’ for each residue along the sequence: a measure of the likelihood that the base
prediction is accurate. Overlapping clusters of reads that have very similar sequences are
considered to be fragments originating from different positions along the same original RNA
molecule. In an assembled collection of ESTs, a cluster of contiguous sequences is called a
Contig, whilst EST strands that do not cluster with other sequences are called Singlets.
The technologies that made EST production possible, such as Sanger base-read sequencing
(Sanger, et al. 1977) and nucleic acid amplification by polymerase chain reaction (PCR), and
the infrastructure developed for high-throughput EST production, data management and
analysis are also used to sequence whole genomes (Venter, et al. 2003). With the ‘$1000
genome’ initiative (NIH, 2006) and other advances in genomic sequencing technology, it
might be thought that ESTs are no longer necessary. However, because of their origin, ESTs
represent a powerful genetic analysis tool, particularly when used in concert with other
genomic or clinical data (Zuo, et al. 2005), and are used in many different applications, as
we shall describe in some detail below.
3.1 Condition-specific expression
Since ESTs are samplings of populations of transcripts, we can infer relative levels of
7
sequences making up particular gene clusters, and the numbers and types of gene clusters in
any sample of ESTs. The first publicly available EST database was created in the mid-1990s
to promote the exchange of genomic data, reduce duplication of effort and speed the
identification of disease-related genes (Williamson 1999). This was quickly followed by the
Cancer Genome Anatomy Project (CGAP), a collection over 1 million ESTs from normal,
premalignant and malignant cells (Strausberg, et al. 2000).
By their nature, ESTs can only be used to discover genome translocations or rearrangements
that occur within the expressed portions of genes. This limits their usefulness to questions
relating to the break points within genes. However, this phenomenon has been strongly
implicated in the onset or development of cancer. Chromosome aberrations are common
characteristics of most human cancer cells (Mitelman et al 2004, Futreal et al 2004), which
is thought to occur by the perturbation of regulatory pathways initiating tumerogenesis. The
Mitelman Database of Chromosome Aberrations in Cancer contains over 45,000 examples of
chromosomal aberrations associated with cancer detected by cytogenetic banding
experiments (Mitelman 2006).
EST collections from individuals or organisms can be used to inexpensively detect the
presence and expression of fused genes, or even incorporated into microarrays for quick
assays of various cancer types. EST-based research on prostate cancer in the late 1990s led
to the discovery of three genes specifically expressed in human prostate cancer (Vasmatzis,
8
tools designed for the study of prostate gene expression in normal and disease states
(Hawkins, et al. 1999). EST-based profiling has since been carried out within and between
many different organisms (Cheng, et al. 2006, Cui, et al. 2004, Chen, et al. 2003, Ji, et al.
2006, Lamblin, et al. 2003, Ogihara, et al. 2004).
An extension of EST technology, serial analysis of gene expression (SAGE) was developed
to provide a more cost-effective means of uniquely identifying transcripts. SAGE is based
on the assumption that a 10–14 base pair stretch mRNA can uniquely identify a transcript,
provided that it is derived from a unique region within that transcript. SAGE has been used
to analyze developmental changes in pigment cells (Weeraratna 2003).
Spotted microarrays are another form of large-scale expression assay that could be seen as a
competitor to EST technology. However, although microarrays can be used to assay the
expression levels of 10,000s of genes at once, the sequences have to be first discovered (e.g.,
by using ESTs) and, even then, the microarray assay is ‘closed’ in that it is limited to only
those genes in the array, compared to the ‘open’ form of EST gathering. Nevertheless, these
three different assays can also be seen as complimentary, with ESTs usually preceding the
others in the process of the genetic characterization of a phenomenon.
3.2 Gene identification in genomic data
EST, protein and cDNA databases were recently used to find 282 gene structures out of
1,435 predicted genes in human chromosome 12 that had not been found by automated gene
9
chromosome 12 that have been directly implicated in human disease.
Thus, despite the generally higher quality and coverage of genomic sequence assemblies, the
relatively ‘noisy’ EST data sets are a powerful tool for identifying genes missed by current
gene-finding methodologies. Depending on the depth of coverage of an EST collection,
many exons may be poorly covered by ESTs or missed completely. In such cases, ESTs can
be supplemented or replaced by signature sequence tags (SSTs), which are subsets of probes
that can be used to detect mutants (Mironov and Pevzner 1999). However, the overall utility
of ESTs and their relatively low cost has meant they remain the primary tool for investigating
a novel genome.
Other uses for ESTs include transcription start site and promoter region identification,
improved comparative genomics / QTL mapping (Demeure, et al. 2005) and SNP discovery
and haplotyping. In an analysis of 11 genomic regions containing single nucleotide
substitutions, the SNP discovery application PolyPhred had a prediction accuracy of greater
than 99% with sequences generated using fluorescent dye-labeled primers and approximately
90% for sequences prepared with dye-labeled terminators (Nickerson, et al. 1997). In a later
study, 5,400 novel exonic SNPs were found by aligning public EST data to the draft human
genome sequence, and an additional 12,000 SNPs were found from EST cluster alignments
(Hu, Modrek et al. 2002). Verification of the predicted SNPs using 20 Finnish DNA
samples indicated that 82% of the genomic-aligned SNPs and 63% of the EST-only SNPs
10
known protein coding regions, leaving 6,500 novel SNP predictions. More recently, a study
of 1107 SNPs on EST counts of two alleles (A and B) using a binomial test showed allelic
gene expression variation in 524 SNPs (47%), in accordance with previous studies using SNP
chips and primer extension (Lin, et al. 2005).
Other methods for identifying SNPs tend to build on the phred/phrap information base
(Buetow, et al. 1999, Cheng, et al. 2004) with some significant algorithmic advances, such
as the Bayesian approach used in PolyBayes (Marth, et al. 1999) and a more recent approach
using chromatogram analysis and consensus sequences that is more accurate than PolyPhred
or PolyBayes when tested on HIV datasets (Galves, et al. 2006). NovoSNP is another SNP
detection method that claims a better reduction in false positives than PolyPhred and
PolyBayes at high quality cutoff values (Weckx, et al. 2005). The logical extension of these
approaches is to use the SNPs identified to construct haplotypes associated with tissues or
disease states (Tang, et al. 2006).
3.3 Alternative splicing prediction
ESTs are considered to be completely and correctly spliced mRNAs. As such, they offer the
possibility of reconstructing the splicing patterns of a gene by looking at how the different
exons of a gene are combined in the sequences belonging to that gene cluster in the EST
population in question. Traditional assembly methods are prone to error in alternative
splicing reconstruction (Figure 1 - 2). Given that 30-60% of human genes are alternatively
11
avoided by using a graph representation of the assembly process, in which each transcript
corresponds to a path in the graph or assembly, to arrive at a more accurate assembly and a
ready-made profile of the splicing pattern of the gene cluster (Heber, et al. 2002). Based on
this technique, approximately 65% of the genes from Ensembl, RefSeq, STACK, TIGR,
UniGene and other major sources were found to show evidence of alternative splicing, with
5% of the genes having over 100 predicted alternate transcripts (Leipzig, et al. 2004). A
database of splicing graphs for human genes using transcript information was made
available, including a web interface for viewing splicing graphs and interactively assembling
transcripts, and a catalog of over 1.2 million putative transcripts.
3.4 Caveat: A High Proportion of Uncharacterized ESTs
An important caveat regarding the publicly available EST databases is that there appear to be
high error rates in these datasets. This is manifested by a significant portion of the available
human ESTs not matching human genomic sequences. In an analysis of pairs of ESTs from
dbEST which were reported to derive from a single gene, it was found that as many as 26%
of the pairs do not both align with the sequence of the same gene (Wolfsberg and Landsman
1997). The authors suspected that some of these unusual ESTs result from artifacts in EST
generation.
4. A short history of F. heteroclitus
The mummichog, Fundulus heteroclitus, is a euryhaline fish (i.e., it can survive both in
12
coast of Newfoundland and along the Eastern seaboard of North America to the Gulf of
Mexico. F. heteroclitus populations are commonly found in bays, estuaries and salt marshes
and spawn in shallow water from April to August, becoming sexually mature in one year.
The fish spend much of the winter months burrowed in the mud and some fish survive a
second winter. F. heteroclitus shows striking sexual dimorphism, particularly when
spawning.
4.1 Phylogeny
In the conventional phylogeny, F. heteroclitus is most similar to medaka and lies close to the
two fugu species - fugu and tetraodon. These species are all more similar to each other than
they are to zebrafish. A comprehensive phylogenetic analysis based on mitochondrial
sequences showed that genetic data broadly supports the conventional phylogeny (Figure 1 -
3).
Knowledge of the phylogenetic relationship of F. heteroclitus to other fish species allows us
to infer the applicability of certain comparison data and comparative approaches for
particular problems. The genomes of the pufferfish species Takifugu rubripes and Tetraodon
nigroviridis, the zebrafish (Danio rerio) and the Japanese medaka (Oryzias latipes) are
extremely valuable resources for studying the molecular physiology of fish and other
vertebrates. Phylogenetic analyses of other genes show significant similarities between F.
heteroclitus and medaka (Kawaguchi, et al. 2005, Urushitani, et al. 2003, Nelson 1994).
13
scope of comparison to envelop basic metabolic processes in humans and other vertebrates.
4.2 Fundulus heteroclitus as a Genomic Resource
With its relatively short generation time (9 months to 1 year), ease of rearing and relatively
inexpensive infrastructure requirements, F. heteroclitus is a convenient model for certain
human health conditions. Lactate dehydrogenase (Ldh) is one of the genes that has been
intensively studied in F. heteroclitus. Mutations of Ldh-A have been associated with the
disease exertional myoglobinuria in humans. Ldh is one of many metabolic genes that can be
studied in experiments that are relatively quick and inexpensive in this non-model organism
(NMO). Furthermore, F. heteroclitus genomic resources provide the opportunity for
comparative genomic studies aimed at identifying underlying evolutionary adaptations of
closely related species that show distinct environmental responses. Further investment is
required in marine genomic techniques and resources in order to integrate the results of
comparative genomics to form a detailed understanding of the underlying molecular
mechanisms.
As a simple example of one application of the available genomic data, candidate promoter
regions identified by alignment of EST sequences against BAC bacterial artificial
chromosomes of several species can be mined for motifs (Prakash, et al. 2004) or regions
that show evolutionary selection or conservation. These ‘phylogenetic footprints’
(evolutionarily conserved non-coding sequences) are subject to stabilizing selection and so
14
footprints or the acquisition of conserved non-coding sequences in particular subpopulations
or species, can provide evidence for the evolutionary modification of cis-regulatory elements.
BAC sequences can also be used to ‘bridge’ non-overlapping ESTs and aid in the assembly
of other genomic scaffolds, thereby alleviating somewhat the complications caused by the
multiple chromosomal duplications found in fish. Although chromosomal duplications can
complicate EST definition and scaffold assembly somewhat, fish genomes are ideal
surrogates for the investigation of gene function and allelic differences in other vertebrates,
such as humans, precisely because of the frequent gene and chromosomal duplications in fish
and subsequent divergence and specialization of redundant genes (Karchner, et al. 2002). In
contrast to experimentally inaccessible mammalian systems which may also exhibit
complicating pleiotropic effects, fish systems can be relatively transparent and easy to
manipulate.
Most of the current body of research on F. heteroclitus has been based on wild, outbred
populations. One of the advantages of a comparative genomics approach is the availability
of inbred lines which dramatically reduce the noise due to genotypic variation between
individuals. In addition to the environmental adaptation research discussed above, F.
heteroclitus is used investigate the effect of pollution and other environmental toxins and
challenges because of the intimate physiological contact with all bodily fluid compartments
and tissues through the gills and gastro-intestinal system.
15
non-model organisms is the flexibility of custom production of cDNA libraries, clone
collections and microarrays. Related to this, a final argument for the development of F.
heteroclitus genomic resources such as microarrays is the availability of eQTL (quantitative
trait loci) mapping techniques that can provide useful information about a trait or
physiological phenomenon of interest (Kendziorski, et al. 2006).
As outlined above, the evolutionary adaption of F. heteroclitus to the metabolic challenge of
environmental temperature is gradually being unraveled by a multidisciplinary approach
focusing on comparative genomic analyses. Building on the research data discussed above,
genes evolving by natural selection in F. heteroclitus have been identified by measuring the
expression of metabolic genes and allocating the maximum among-population variation to
genetic distance and examining the remaining variation relative to a temperature (Whitehead
and Crawford 2006). The variation in expression for 22% of the genes studied that regress
with habitat temperature was significantly greater than could be accounted for by genetic
distance alone. Evolution by natural selection was suggested as the most parsimonious
explanation for among-population variation for these genes. The study showed that many
metabolic genes have patterns of variation that cannot be explained by neutral evolution, i.e.,
too much or too little variation, which may reflect important physiological functions.
Besides Ldh-B and other F. heteroclitus metabolic genes that have orthologues in humans
and other vertebrates, F. heteroclitus also expresses the cystic fibrosis transmembrane
16
A phylogenetic comparison of the CFTR gene in several teleost species showed all the major
elements of the human gene are present and the ability of teleosts to rapidly regulate CFTR
expression and activation during salinity adaptation makes the fish an attractive model for
studying the expression and cellular transport of CFTR.
A recent paper indicated that the heat shock response in F. heteroclitus involves a complex
dynamic of multiple isoforms (Fangue, et al. 2006). The paper examined variation in
whole-animal thermal tolerance and differences in the sequence or regulation of the heat shock
protein genes in extreme northern and southern F. heteroclitus populations. The authors
found no fixed differences in amino acid sequence between populations but significant
differences between populations in the expression of many of the genes. This complements
an earlier finding that the Sp transcription factor domains have evolved independently (Kolell
and Crawford 2002) according to the phylogenetic characterization of Sp in mammals and
fSp3, the Sp protein expressed in the liver or heart tissue of F. heteroclitus. The results
suggest that Sp2 should not be considered a member of the Sp family and that only two
domains (zinc fingers and B domain) share similarity outside the Sp family. The zinc fingers
are homologous to other GC-binding domain and the B domain is homologous to
protein-protein interacting domains in the CCAAT-binding/NF-Y transcription factor families,
suggesting these different domains have different evolutionary histories.
The ongoing development of microarray resources for F. heteroclitus, which can be used in
17
interesting physiological traits and responses that are experimentally intractable - or absent in
model species are better illustrated in non-model organisms. Microarray technology can be
successfully applied to non-model species to ameliorate the current poor understanding of the
system-wide environmental stress response in complex, multi-tissue animals (Gracey, et al.
2004). This can either be in the form of hypothesis-driven or discovery-based multi-locus
scans, comparing different populations to identify variations in genomic regions that result in
environmental adaptation (Podrabsky and Somero 2004).
Oligonucleotide microarray analysis also can successfully identify many potential direct
downstream genes and decipher downstream signaling pathways (Chen, et al. 2005). The
temporal pattern of gene expression in response to environmental change can now be
investigated using cDNA microarrays. Traditionally, gene expression analysis has focused
on fold-change analysis, because conventional techniques for time series analysis are
ill-suited to short series of time-ordered data. However, techniques are available to infer
statistically meaningful information from a small set of four or more time-ordered gene
expression measurements (De Hoon, et al. 2002). Finally, another area where comparative
analysis using F. heteroclitus can provide biological insight is the exploration, development
and refinement of different methods of using phylogenetic information in comparative
studies (Garland, et al. 2005).
In summation, F. heteroclitus EST resources can provide an important resource in marine
18
genetics and comparative genomics. As we shall discuss in the following chapters, better
quality control and novel uses of sequence similarity searches and protein motifs can
contribute to improving the annotation of EST databases and enhance the benefits of their use
with other genomic resources.
5 Machine learning using protein motif inputs
The third chapter of this dissertation involves the use of machine learning techniques to
predict protein function. One challenge of using computational techniques such as machine
learning to determine underlying patterns in biological data is retaining the biological sense
of the original data inside the computational model such that the result is readily understood
in biological terms. Machine learning techniques such as neural networks and support vector
machines are commonly used for determining patterns in numerical data. However, the
ability to use non-numeric data is crucial in our choice of machine learning algorithm for the
classification of protein motifs; although many techniques exist for transforming
non-numeric data to non-numeric values, they cannot be meaningfully applied to signatures of protein
motifs in the form of protein motif names. Decision Tree and Naïve Bayes machine learning
approaches were chosen for this study because they can use non-numeric inputs such as
protein motif names and the resulting models can be easily understood by the untrained eye.
The relatively straightforward interpretation of Decision Trees in particular makes them
particularly suitable for the pedagogic function of improving our understanding of the
19
The advantages and disadvantages of Decision Trees are summarized in Table 1 - 1. One
chief advantage of the Naïve Bayes method is that prediction results are easy to interpret:
Naïve Bayes produces a probability score ranging from 0 to 1 for each category and the
category with the highest probability score is considered the ‘correct’ choice. Similarly,
Decision Trees are bifurcating trees of rules with probabilities at each branch point that
provide a decision as to the identity of the sample being tested and also a statistical indication
of the likelihood that the prediction is correct.
5.1 An introduction to Decision Trees
For a brief introduction into how Decision Trees work, take a Decision Tree on whether or
not to play golf: It can be easily understood as an upside-down tree of choices where certain
attributes are forks in the branches Figure 1 - 4. Here, the attributes (or forks) available are:
outlook, temperature, humidity and wind. The branches splitting off from the forks are the
different values of attributes, e.g.: outlook has three values: sunny, overcast and rain.
Depending on the conditions on any particular day, the Decision Tree will be traversed down
its branches to the final leaf - the decision on whether or not to play that day. Similar to the
golf Decision Tree, the decision on whether or not a protein belongs in a particular functional
group can also be represented as a Decision Tree.
Note that not all attributes are necessarily considered important in the construction of a
Decision Tree and some may be left out of the tree. For example, in the golf Decision Tree,
20
regarding the previous outcomes to make it a useful deciding factor compared to the other
attributes. The relative importance of attributes is commonly allocated based on information
gain or the Gini impurity. N-fold cross-validation tests are commonly used to validate
Decision Trees models and provide a measure of their reliability.
5.2 An introduction to Naïve Bayes
The Naïve Bayes machine learning algorithm is a well-studied probabilistic algorithm often
used in automatic text categorization. It is much faster than other popular machine learning
algorithms such as k-Nearest Neighbors, Support Vector Machines or Decision Trees, and it
also performs very well compared to these algorithms, despite its ‘naïve’ assumption of
independence between attributes. In fact, Naïve Bayes has been shown to perform as well as
or better than more powerful classifiers for commonly seen set sizes and numbers of
attributes, even under conditions where attributes are clearly dependent, such as linguistic
analyses (Domingos and Pazzani 1997). Naïve Bayes classifiers have been used in the
prediction of protein-DNA interactions with 44% specificity and 41% sensitivity in
identifying interface residues using the identities of a window of 9 residues and the sequence
entropy of the target residue as input (Yan, et al. 2006), where the Naïve Bayes classifier
performed better than searching for PROSITE DNA-binding motifs.
In mathematical notation, the probability of event A occurring (or being true) given that B
has occurred (or is true) is denoted as P( A | B ), a conditional probability, and the probability
21
Bayes' Theorem is a way of inverting a conditional probability. It states:
When considering, for example, allocating documents to one of several categories based on
the frequencies of words in the document, we are only interested in the maximum size of the
numerator because this represents the greatest probability that a given document belongs to a
particular category:
We can drop the P(words) term since it doesn't change over the range of categories, to arrive
at:
Finally, the naïve assumption occurs if we denote the words in the document as w1, w2, ...
wn, and say that the equation above is equivalent to:
This last step naively assumes that the attributes, in this case, words in a document, are
independent. This is clearly not the case as a word might tend to be commonly used with
other words, so the presence or absence of these other words would affect the likelihood of
finding this word. For this study, the naïve assumption is that the occurrence of a protein ) ( ) ( . ) | ( ) | ( B P A P A B P B A P ) ( ) ( ). | ( words P category P category words P ArgMax category Best categories in category ) ( ). | (
ArgMax P words category P category
category Best categories in category ) ( ). | ( )... | ( ). | (
ArgMax P w1 category P w2 category P w category Pcategory
category
22
motif in a particular protein does not affect the chance of any other motif also being found in
23
References
1
NCBI, Homologous sequences, Available at
http://www.ncbi.nlm.nih.gov/Education/BLASTinfo/Orthology.html, (2007).
2
Webber, C. & Barton, G.J., Increased coverage obtained by combination of methods for protein sequence database searching. Bioinformatics 19 (11), 1397-1403 (2003).
3
Altschul, S.F., Gish, W., Miller, W., Myers, E.W., & Lipman, D.J., Basic local alignment search tool. J Mol Biol 215 (3), 403-410 (1990).
4
Integrated Microbial Genomes, J.G.I., Data Extraction, Transformation, and Loading, Available at http://img.jgi.doe.gov/pub/doc/dataprep.html, (2007).
5
Marchler-Bauer, A. et al., CDD: a database of conserved domain alignments with links to domain three-dimensional structure. Nucl. Acids Res. 30 (1), 281-283 (2002).
6
Research, T.I.f.G., TIGR Solanaceae Genomics Resource, Available at
http://www.tigr.org/tdb/sol/, (2007).
7
Beckstrom-Sternberg, S.M. et al., Complete Genomic Characterization of a Pathogenic A.II Strain of Francisella tularensis Subspecies tularensis. PLoS
ONE 2 (9), e947 (2007).
8
Sanger, F., Nicklen, S., & Coulson, A.R., DNA sequencing with
chain-terminating inhibitors. Proceedings of the National Academy of Sciences of the
United States of America 74 (12), 5463-5467 (1977).
9
Venter, J.C., Levy, S., Stockwell, T., Remington, K., & Halpern, A., Massive parallelism, randomness and genomic advances. Nat Genet.
10
24
11
Zuo, K. et al., [Identification and characterization of differentially expressed ESTs of Gossypium barbadense infected by Verticillium dahliae with
suppression subtractive hybridization]. Molekuliarnaia biologiia 39 (2), 214-223 (2005).
12
Williamson, A.R., The Merck Gene Index project. Drug Discov Today 4 (3), 115-122 (1999).
13
Strausberg, R.L., Buetow, K.H., Emmert-Buck, M.R., & Klausner, R.D., The cancer genome anatomy project: building an annotated gene index. Trends
Genet 16 (3), 103-106 (2000).
14
Mitelman, F., Johansson, B., & Mertens, F., Fusion genes and rearranged genes as a linear function of chromosome aberrations in cancer. Nat Genet 36 (4), 331-334 (2004).
15
Futreal, P.A. et al., A census of human cancer genes. Nat Rev Cancer 4 (3), 177-183 (2004).
16
Mitelman, F., Johansson B. and Mertens F. , Mitelman Database of Chromosome Aberrations in Cancer (2006).
17
Vasmatzis, G., Essand, M., Brinkmann, U., Lee, B., & Pastan, I., Discovery of three genes specifically expressed in human prostate by expressed sequence tag database analysis. Proceedings of the National Academy of Sciences of the United
States of America 95 (1), 300-304 (1998).
18
Hawkins, V. et al., PEDB: the Prostate Expression Database. Nucleic acids
research 27 (1), 204-208 (1999).
19
Cheng, D.J. et al., EST-based profiling and comparison of gene expression in the silkworm fat body during metamorphosis. Archives of insect biochemistry and
physiology 61 (1), 10-23 (2006).
20
Cui, Y. et al., Identification and expression analysis of EST-based genes in the bud of Lycoris longituba. Genomics, proteomics & bioinformatics / Beijing
Genomics Institute 2 (1), 43-46 (2004).
21
Chen, Y. et al., Gene expression profiling in porcine fetal thymus. Genomics,
25
22
Ji, W. et al., Generation and analysis of expressed sequence tags from NaCl-treated Glycine soja. BMC plant biology [electronic resource] 6, 4 (2006).
23
Lamblin, A.F. et al., MtDB: a database for personalized data mining of the model legume Medicago truncatula transcriptome. Nucleic acids research 31 (1), 196-201 (2003).
24
Ogihara, Y. et al., Construction of a full-length cDNA library from young
spikelets of hexaploid wheat and its characterization by large-scale sequencing of expressed sequence tags. Genes & genetic systems 79 (4), 227-232 (2004).
25
Weeraratna, A.T., Serial analysis of gene expression (SAGE): advances, analysis and applications to pigment cell research. Pigment cell research / sponsored by
the European Society for Pigment Cell Research and the International Pigment Cell Society 16 (3), 183-189 (2003).
26
Scherer, S.E. et al., The finished DNA sequence of human chromosome 12.
Nature 440 (7082), 346-351 (2006).
27
Mironov, A.A. & Pevzner, P.A., SST versus EST in gene recognition. Microbial
& comparative genomics 4 (3), 167-172 (1999).
28
Lin, W., Yang, H.H., & Lee, M.P., Allelic variation in gene expression identified through computational analysis of the dbEST database. Genomics 86 (5), 518-527 (2005).
29
Buetow, K.H., Edmonson, M.N., & Cassidy, A.B., Reliable identification of large numbers of candidate SNPs from public EST data. Nat Genet 21 (3), 323-325 (1999).
30
Cheng, T.C. et al., Mining single nucleotide polymorphisms from EST data of silkworm, Bombyx mori, inbred strain Dazao. Insect biochemistry and molecular
biology 34 (6), 523-530 (2004).
31
Marth, G.T. et al., A general approach to single-nucleotide polymorphism discovery. Nat Genet 23 (4), 452-456 (1999).
32
26
33
Weckx, S. et al., novoSNP, a novel computational tool for sequence variation discovery. Genome research 15 (3), 436-442 (2005).
34
Tang, J., Vosman, B., Voorrips, R.E., van der Linden, C.G., & Leunissen, J.A., QualitySNP: a pipeline for detecting single nucleotide polymorphisms and insertions/deletions in EST data from diploid and polyploid species. BMC
bioinformatics [electronic resource] 7 (1), 438 (2006).
35
Heber, S., Alekseyev, M., Sze, S.H., Tang, H., & Pevzner, P.A., Splicing graphs and EST assembly problem. Bioinformatics 18 Suppl 1, S181-188 (2002).
36
Leipzig, J., Pevzner, P., & Heber, S., The Alternative Splicing Gallery (ASG): bridging the gap between genome and transcriptome. Nucleic acids research 32 (13), 3977-3983 (2004).
37
Wolfsberg, T.G. & Landsman, D., A comparison of expressed sequence tags (ESTs) to human genomic sequences. Nucleic acids research 25 (8), 1626-1632 (1997).
38
Kawaguchi, M. et al., Purification and gene cloning of Fundulus heteroclitus hatching enzyme. A hatching enzyme system composed of high choriolytic enzyme and low choriolytic enzyme is conserved between two different teleosts, Fundulus heteroclitus and medaka Oryzias latipes. The FEBS journal 272 (17), 4315-4326 (2005).
39
Urushitani, H. et al., Cloning and characterization of estrogen receptor alpha in mummichog, Fundulus heteroclitus. Molecular and cellular endocrinology 203 (1-2), 41-50 (2003).
40
Nelson, J.S., Fishes of the World. John Wiley and Sons (1994).
41
Prakash, A., Blanchette, M., Sinha, S., & Tompa, M., Motif discovery in heterogeneous sequence data. Pacific Symposium on Biocomputing, 348-359 (2004).
42
Karchner, S.I., Franks, D.G., Powell, W.H., & Hahn, M.E., Regulatory
27
43
Kendziorski, C.M., Chen, M., Yuan, M., Lan, H., & Attie, A.D., Statistical methods for expression quantitative trait loci (eQTL) mapping. Biometrics 62 (1), 19-27 (2006).
44
Whitehead, A. & Crawford, D.L., Variation within and among species in gene expression: raw material for evolution. Molecular ecology 15 (5), 1197-1211 (2006).
45
Marshall, W.S. & Singer, T.D., Cystic fibrosis transmembrane conductance regulator in teleost fish. Biochimica et biophysica acta 1566 (1-2), 16-27 (2002).
46
Fangue, N.A., Hofmeister, M., & Schulte, P.M., Intraspecific variation in thermal tolerance and heat shock protein gene expression in common killifish, Fundulus heteroclitus. The Journal of experimental biology 209 (Pt 15), 2859-2872 (2006).
47
Kolell, K.J. & Crawford, D.L., Evolution of Sp transcription factors. Molecular
biology and evolution 19 (3), 216-222 (2002).
48
Gracey, A.Y. et al., Coping with cold: An integrative, multitissue analysis of the transcriptome of a poikilothermic vertebrate. Proceedings of the National
Academy of Sciences of the United States of America 101 (48), 16970-16975 (2004).
49
Podrabsky, J.E. & Somero, G.N., Changes in gene expression associated with acclimation to constant temperatures and fluctuating daily temperatures in an annual killifish Austrofundulus limnaeus. The Journal of experimental biology 207 (Pt 13), 2237-2254 (2004).
50
Chen, H. et al., Identification of transcriptional targets of HOXA5. The Journal
of biological chemistry 280 (19), 19373-19380 (2005).
51
De Hoon, M.J., Imoto, S., & Miyano, S., Statistical analysis of a small set of time-ordered gene expression data using linear splines. Bioinformatics 18 (11), 1477-1485 (2002).
52
28
53
Domingos, P. & Pazzani, M., On the Optimality of the Simple Bayesian Classifier under Zero-One Loss. Machine Learning 29 (2), 103-130 (1997).
54
Yan, C. et al., Predicting DNA-binding sites of proteins from amino acid sequence. BMC Bioinformatics 7, 262 (2006).
55
Pevzner Group, B.L., University of California, San Diego, Splicing graphs, Available at http://www.cse.ucsd.edu/groups/bioinformatics/ESTs/index.html.
56
29
Table 1 - 1 The advantages and disadvantages of Decision Trees and Naive Bayes.
Compared to other methods, such as neural networks and support vector machines, Decision Trees and naive bayes provide similar performance and produce output parameter values that are easy to extract and understand.
Decision Trees Naïve Bayes
Intuitive - Easy to understand and interpret after a brief explanation Simple - A basic probability calculation.
Real values - Can use both numeric and categorical data, including ‘real values’ (such as protein motif names)
Real values - Can use both numeric and categorical data, including ‘real values’ (such as protein motif names)
‘Glass box’ model - Provides clear, boolean inferences using the input attributes themselves, unlike the ‘black box’ model of other machine learning method,
Good performance - Even when the assumption is independence is not met, the performance of Naïve Bayes models is comparable to more complex methods.
Cheap and Robust - Relatively little data manipulation is required to build a decision tree model. The algorithm scales up well with large data sets and runs fast on generic hardware.
Cheap and Robust - Scales up well with large data sets and runs fast on generic hardware.
Simple - Relatively little data preparation – no data normalisation, assumed priors or removal of blank values
Simple - Relatively little data preparation – no data normalisation or removal of blank values
Complex rules - Large and complex trees may produce rule sets that are difficult to follow
Decision balance bias - Requirement for balanced data sets (equal positive and negative examples)
Suboptimal trees - Overfitting can produce suboptimal trees that are overly complex, i.e., more suited to the training set than the generalised example
No optimization - No parameters to adjust to maximize performance – it’s just a simple reflection of the probabilities
Supervised learning only - Decision trees require labelled data (e.g., ‘true’ and ‘false’) and as such are a supervised learning approach.
Missing values hack - Zero probabilities or missing values require mock priors (e.g., Dirichlet Prior)
30
Figure 1 - 1 Orthologues and paralogues are two types of homologous sequences.
Orthology describes genes in different species that derive from a common ancestor.
31
32
Figure 1 - 3 Distribution of genome sequencing, major EST projects (>1000 sequences), large-insert libraries and radiation hybrid panels in relation to a conventional fish phylogeny.
33
Figure 1 - 4 Decision Tree for deciding whether to play golf.
The golf Decision Tree attempts to decide whether or not to play based on the current weather conditions combined with previous decisions to play or not play on different days. Each row in the table represents a day and each column a weather condition, with the last column showing the decision on that day (Quinlan 1987).
Outlook Temperature Humidity Windy Decision
sunny 85 85 FALSE DontPlay
sunny 80 90 TRUE DontPlay
overcast 83 78 FALSE Play
rain 70 96 FALSE Play
rain 68 80 FALSE Play
rain 65 70 TRUE DontPlay
overcast 64 65 TRUE Play
sunny 72 95 FALSE DontPlay
sunny 69 70 FALSE Play
rain 75 80 FALSE Play
sunny 75 70 TRUE Play
overcast 72 90 TRUE Play
overcast 81 75 FALSE Play
34
Chapter 2: Incremental mismatch probability filter
35
Abstract
New collections of sequences are annotated based on DNA sequence similarity. Potential
problems are that the resulting annotations are uninformative, non-standardized, incorrect or
lacking in essential features that inform scientists. Depending on the database, between 12%
to 85% of annotations are of poor quality. When searching other UniGene mammal
databases with well-annotated Human UniGenes, between 3% to 7% of these genes are
missing. Yet if there was a significant BLAST hit, these Human UniGenes match four or
more sequences at E-values less than 10-100. More problematic was that the annotations were
often dissimilar: for a hit with an E-value of 10-5,69% of sequences had annotations that
differed from the human sequences. This proportion declined to 4% at E-values less than 10
-201
. Using a Fuzzy-matching algorithm, one can determine whether annotations of the best
hits are similar. If best-hits in different databases are the same, they correctly identified the
original annotation 99% of the time. A second computational approach is to calculate an
incremental mismatch probability that indicates the probability that the functional
annotations for the query and target sequences are the same given a hit with a particular
E-value (i.e., a conditional probability). Using very low E-E-values mitigates many of the
problems with annotation, but increases the possibility of missing orthologous sequences.
Alternatively, by using FuzzyMatch to compare the annotation within and among databases,
one can provide a statistic for the likelihood of a correct annotation that significantly reduces
36
Introduction
Annotating genomic coding regions, cDNAs or ESTs is problematic (Crawford 2007, Fields
and Johnston 2002, Tamames and Valencia 2006, Wain, et al. 2002). The first problem is
that there are few widely-accepted rules for naming genes. Thus, most genes have several
names (e.g., 53% of Swiss-Prot genes have 2 or more synonyms) and many names have
different genes associated with them. For example, RAD refers to both “Ras-related
associated with diabetes” and DNA damage repair gene. In mammals GRIM is an enzyme
subunit in oxidative phosphorylation that is also associated with cell death; yet, in Drosophila
GRIM is an unrelated cell death associated protein without enzyme function. To address
these problems, the Human Genome Organization (HUGO) initiated a heroic effort to
provide a single official symbol for genes (Wain, et al. 2002). This single annotation would
have provided a common vocabulary for researchers in which different functions could be
appended. Unfortunately, too many HUGO terms have been arbitrarily replaced one or more
times by non-standard terms (Tamames and Valencia 2006). Without a standard vocabulary,
integrating information from different publications into meaningful functional genomics
becomes much more difficult (Crawford 2007).
The second problem relates to annotating genes based on sequence similarity. Most
annotation schemes use the best BLAST hit, or hit with the lowest E-value to assign a name
to the query sequence. The BLAST E-value is defined as the expected number of
non-homologous sequences with a certain score in a database of a particular size. E-values are
37
BLAST E-values as low as 10-50 against targets with different enzyme functions can occur
(Rost 2002). In addition to the problems of interpreting E-values, the difficulty of evaluating
BLAST hits is compounded by a lack of a unified vocabulary for describing genes. The
assumption is that the best hit is homologous to the query sequence. This homology (defined
as descended from a common ancestral gene (Fitch 2000)) between genes is assumed to be
indicative of functional similarity. Yet, many annotations use BLAST searches with
upper-threshold E-values of 10-1 to 10-10 (Pascal and Tjian 1991, Adams, et al. 1991, Clark, et al.
2003, Lee, et al. 2007). Additionally, even in the most highly investigated genomes there is
a significant frequency of genes annotated with “similar to” or “predicted”: for human,
mouse, rat or dog UniGenes at NCBI these frequencies are 8%, 9%, 24% and 53%
(respectively). Annotation based on these approaches without some form of verification
could create a cascade of errors.
This study quantifies the problems with annotation and explores the utility of the “best
match” approach to naming genes. The data presented here demonstrate that even for
vanishing small E-values(i.e., E-value = 10-100) there are many misannotations (annotations
that are dissimilar to the original UniGene annotation). We suggest a solution for these
problems using fuzzy logic and similarities between genes within databases and suggest that
genes be identified with reference to two or more common databases, for example Human or
38
Methods
2.1 UniGene and Swiss-Prot BLAST Comparisons
For BLAST comparison purposes, 1,000 well-annotated Human UniGene sequences
(hereafter referred to as the ‘human 1,000’ sequences) were selected from NCBI UniGene
Homo sapiens release #196 and WU-BLAST BLASTN alignments were carried out against
three mammalian UniGene databases: Canis lupus familiaris (dog), Mus musculus (mouse)
and Rattus novegicus. BLASTX alignments were also carried out against Swiss-Prot. In all
cases, we used the full-length mRNA for our similarity searches. We used two criteria to
select ‘well-annotated’ sequences. First, we excluded sequences with annotation that
appeared to be based on sequence similarity alone or where the annotations were
uninformative, i.e., genes with annotations containing the words ‘similar to’, ‘predicted’,
hypothetical, ‘unknown’, ‘transcribed locus’, ‘clone’, ‘containing’, ‘like’, ‘repeat domain’,
‘domains’, ‘homolog’, ‘unknown’, ‘amplified sequence’, ‘non-coding RNA’ or ‘associated’.
Second, we manually inspected annotations for specific and emphatic reference to gene
function (i.e., annotations with just clone number or chromosomal location, or ambiguous
terms were excluded).
2.2 BLAST scores, Histograms and E-value
Only BLAST hits less than E-value 10-5 are used. The maximum number of hits per query
was 250, and low complexity regions were filtered using seg. For histograms, each bar
39
that bar. For example if the X-axis is E-Value with -20 and -30, then a bar value of -30
indicates all hits with E-values between 10-21 and 10-30.
2.3 Fuzzy Matching of BLAST Annotations
To determine similar and dissimilar annotations, a simple fuzzy match (Zadeh 1965)
heuristic was developed. The fuzzy match heuristic involved breaking down each pair of
input sentences into their component words, then comparing all combinations of word pairs
containing one word from each set. To increase the effectiveness, some general terms are
excluded (e.g., chain, domain, fragment, family). Each word pair match is given a score
from 0 to 1, which was calculated as follows: the number of 3-letter fragments of the shorter
word that are found in the longer word, divided by the length of the shorter word less the
window width. The highest word pair scores for each word in the sentence with least words
were added together and divided by the number of words in the shorter sentence to arrive at a
match score. If the shorter sentence contained more than one word, the above procedure was
repeated with one word alternately removed from the shorter sentence to arrive at additional
match scores. The highest of the match scores was used as the fuzzy match score. Due to
the nature of the fuzzy match algorithm, shorter, more general descriptions were more likely
to be predicted as similar (e.g., ‘protein kinase’ compared to ‘serine/threonine protein
kinase’). This was not necessarily a drawback with regard to evaluating the performance of
the fuzzy match algorithm as more general annotations could be considered incomplete but